Heiken Ashi 3 AM
- 指标
- Andriy Matviyevs'kyy
- 版本: 26.0
Author's implementation of the classic technical analysis indicator Heiken Ashi.
This indicator makes it easier to identify a trend and is the basis of many strategies.
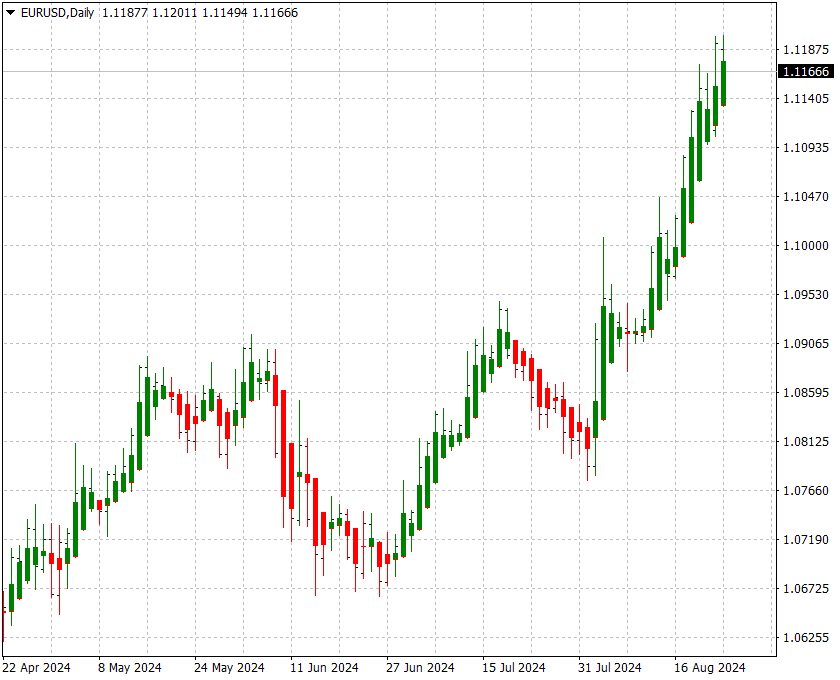
At its core, the Heiken Ashi (HA) indicator is just a way to construct a price candlestick chart.
In the classic version of the indicator, the opening point of the HA candle is the average value between the opening and closing prices of the previous HA candle, and the closing point of the HA candle is the average value between the low, high, open and close prices of the current bar.
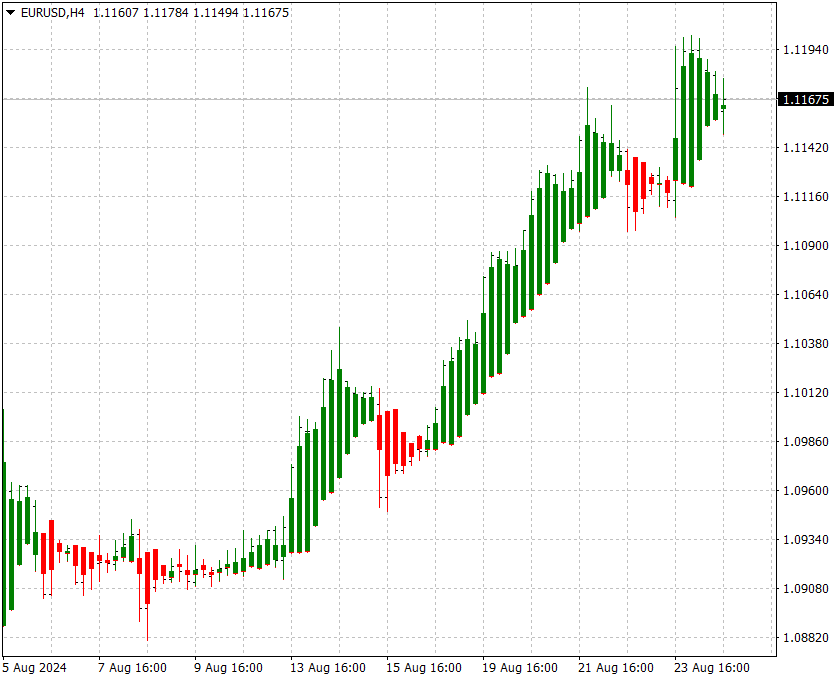
In the presented indicator, the user can independently select the opening and closing prices of the HA candle, the smoothing of such prices, as well as the depth of the shift of the opening price relative to the current candle (in the original HA the shift depth is 1, that is, as mentioned earlier, the opening point of the HA candle is the average value between the opening and closing prices of the previous bar).
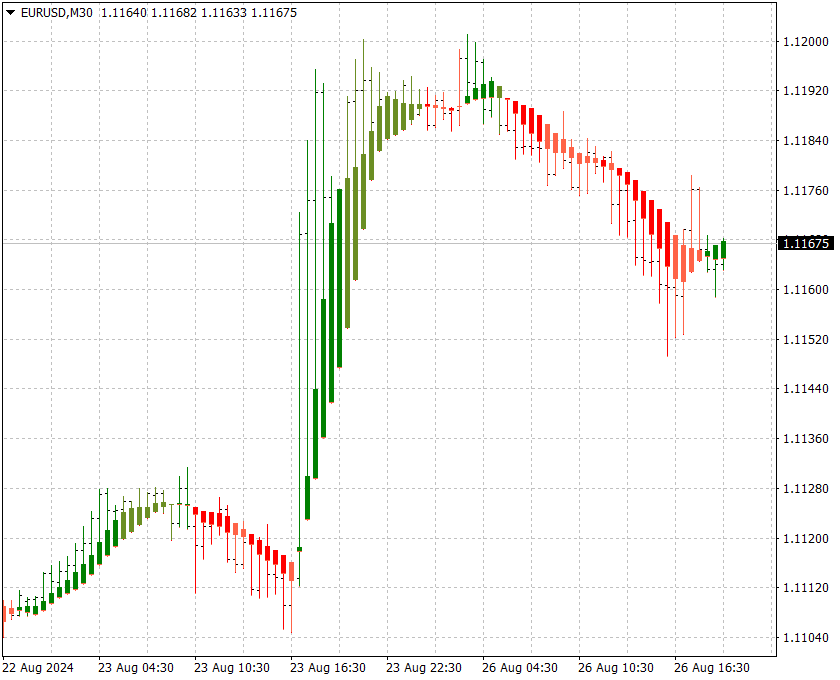
Also, the presented version of the indicator clearly displays the candles on which the trend is weakening, and colors such candles with a lighter color.