Wa Candle Timer MT4
- 指标
- Wachinou Lionnel Pyrrhus Sovi Guidi
- 版本: 2.0
- 更新: 9 二月 2025
Wa Candle Timer MT4
Wa Candle Timer MT4 是一款强大且易于使用的指标,专为在MT5图表上显示下一根K线形成前的剩余时间而设计。此工具帮助交易者掌握K线关闭时间,从而优化交易执行和决策。
🚀 主要功能:
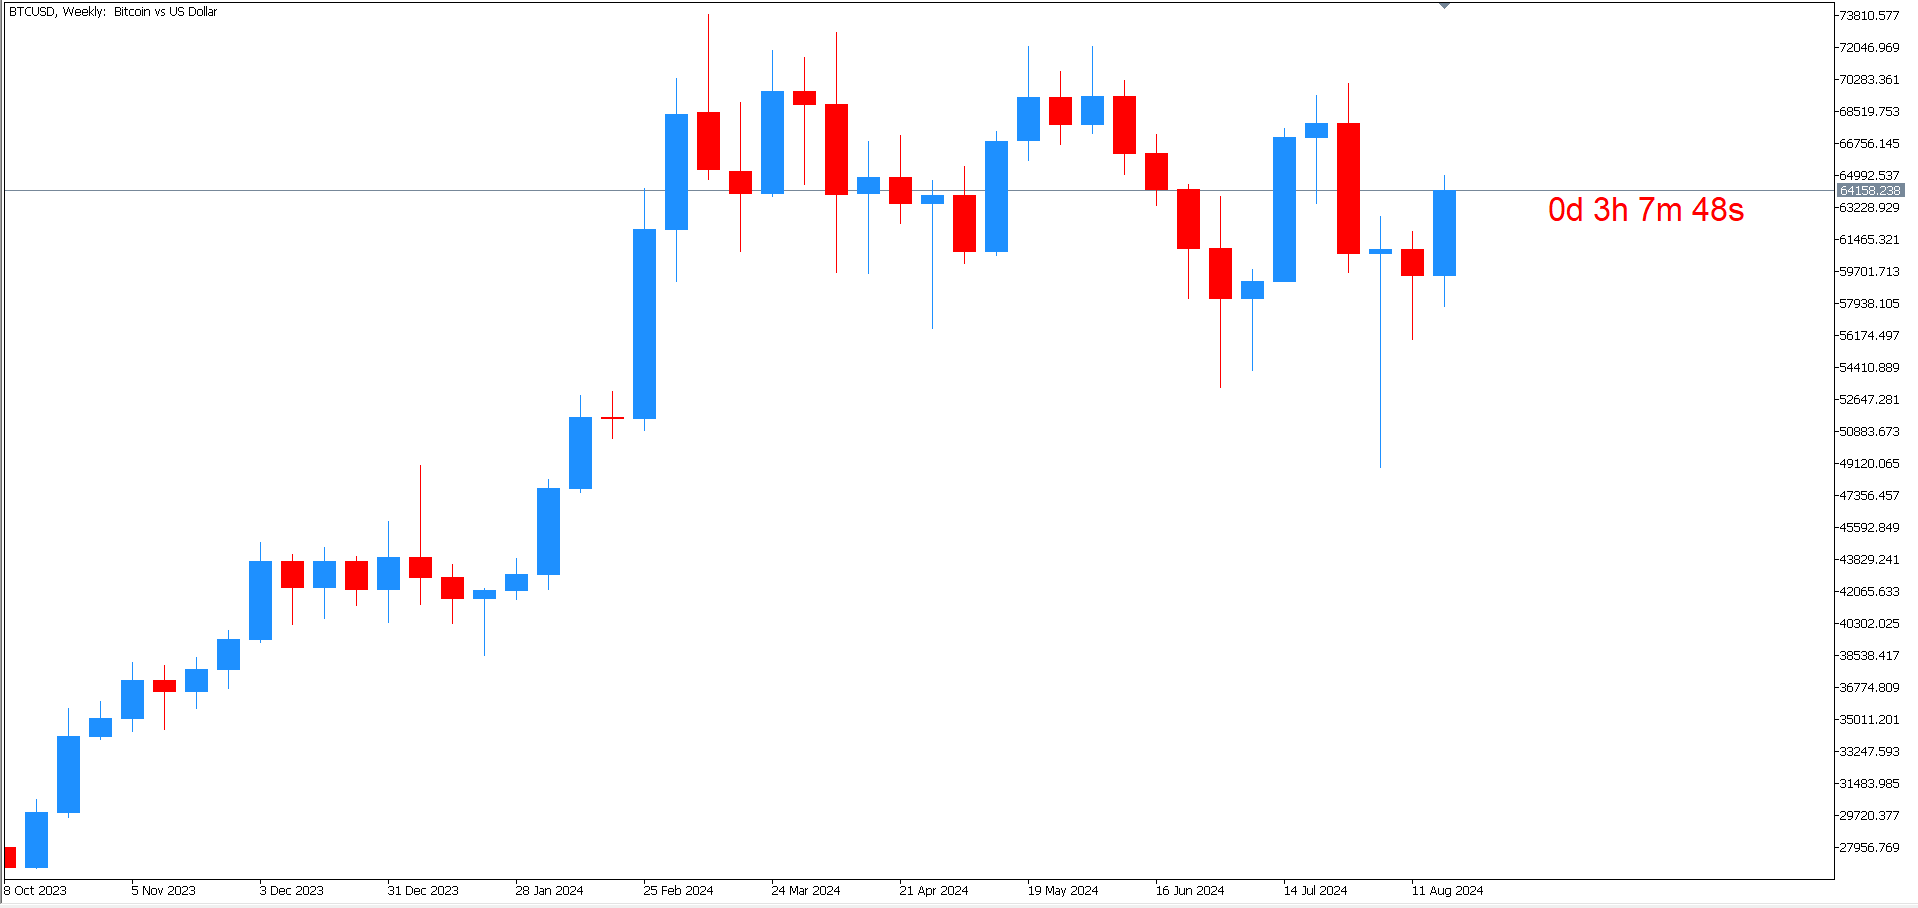
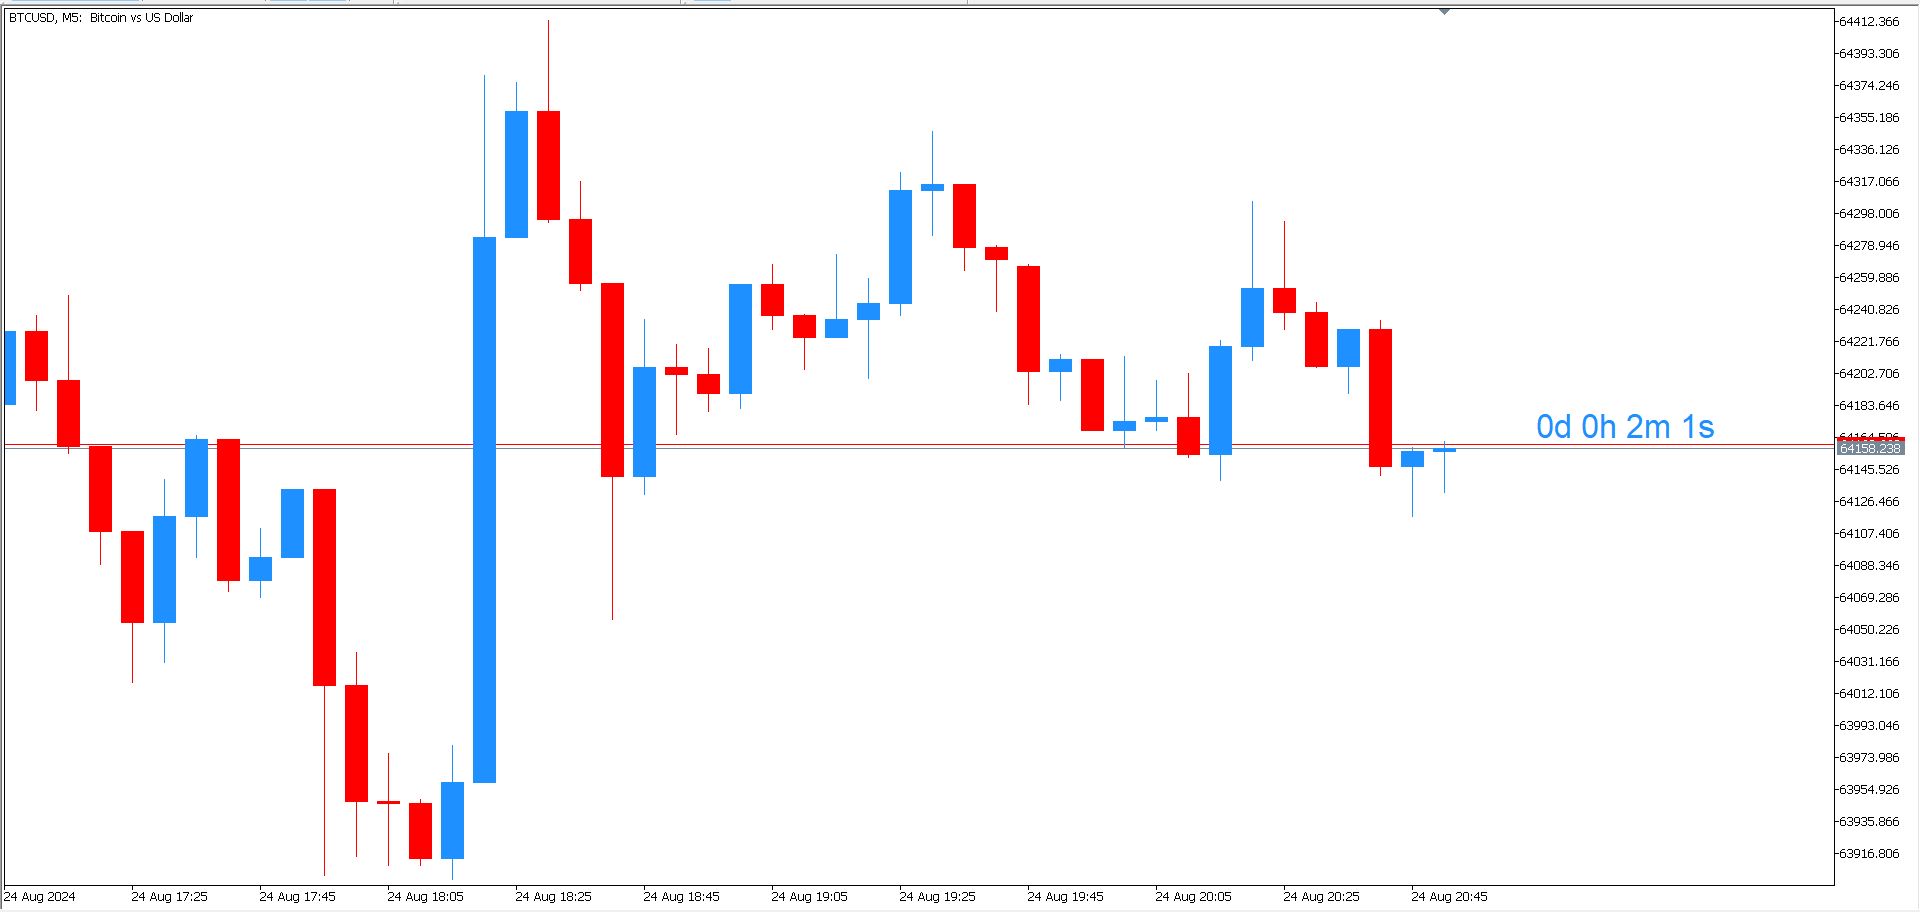
✅ 显示当前K线的倒计时。
✅ 当K线剩余时间少于5%时自动变色。
✅ 支持字体和颜色的完全自定义设置。
✅ 提高时间管理能力,使交易更精准。
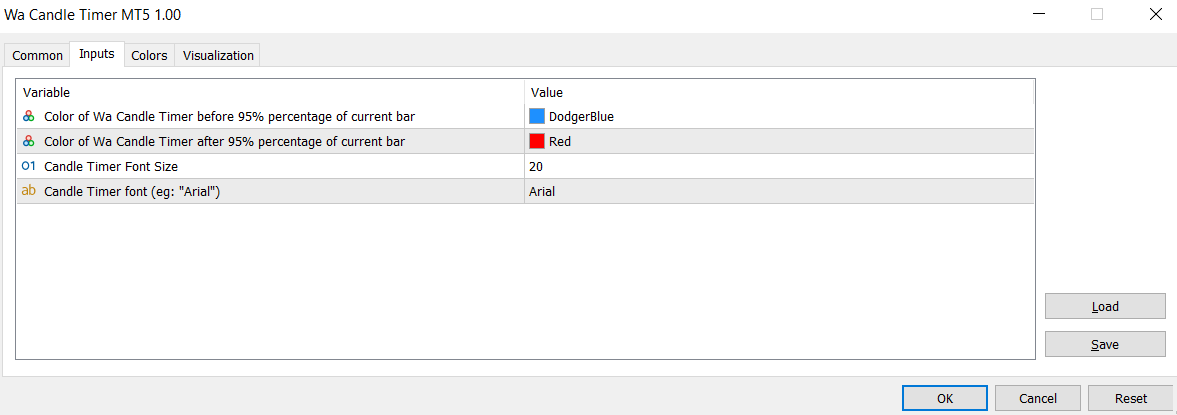
🎨 可自定义设置:
1️⃣ K线倒计时颜色(>5% 剩余时间) – 设置当剩余时间超过5%时的颜色。
2️⃣ K线倒计时颜色(<5% 剩余时间) – 设置当剩余时间少于5%时的颜色。
3️⃣ 字体大小 – 调整倒计时文本的大小,提高可见度。
4️⃣ 字体样式 – 选择您喜欢的字体(例如:"Arial")。
对于依赖精准K线时间的交易者来说,该指标是一个必不可少的工具。使用 Wa Candle Timer MT4 让自己始终领先市场!