Wa Candle Timer MT4
- 指标
- Wachinou Lionnel Pyrrhus Sovi Guidi
- 版本: 1.1
- 更新: 2 九月 2024
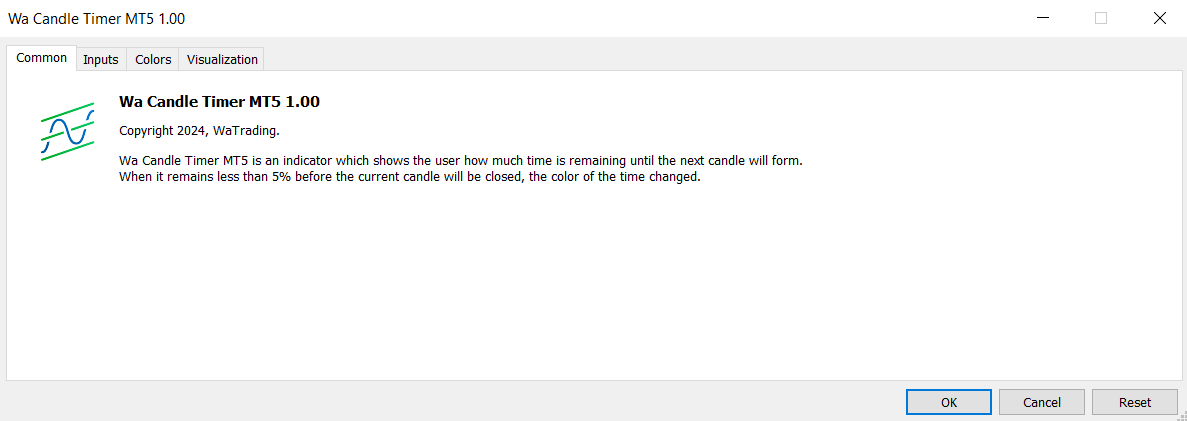
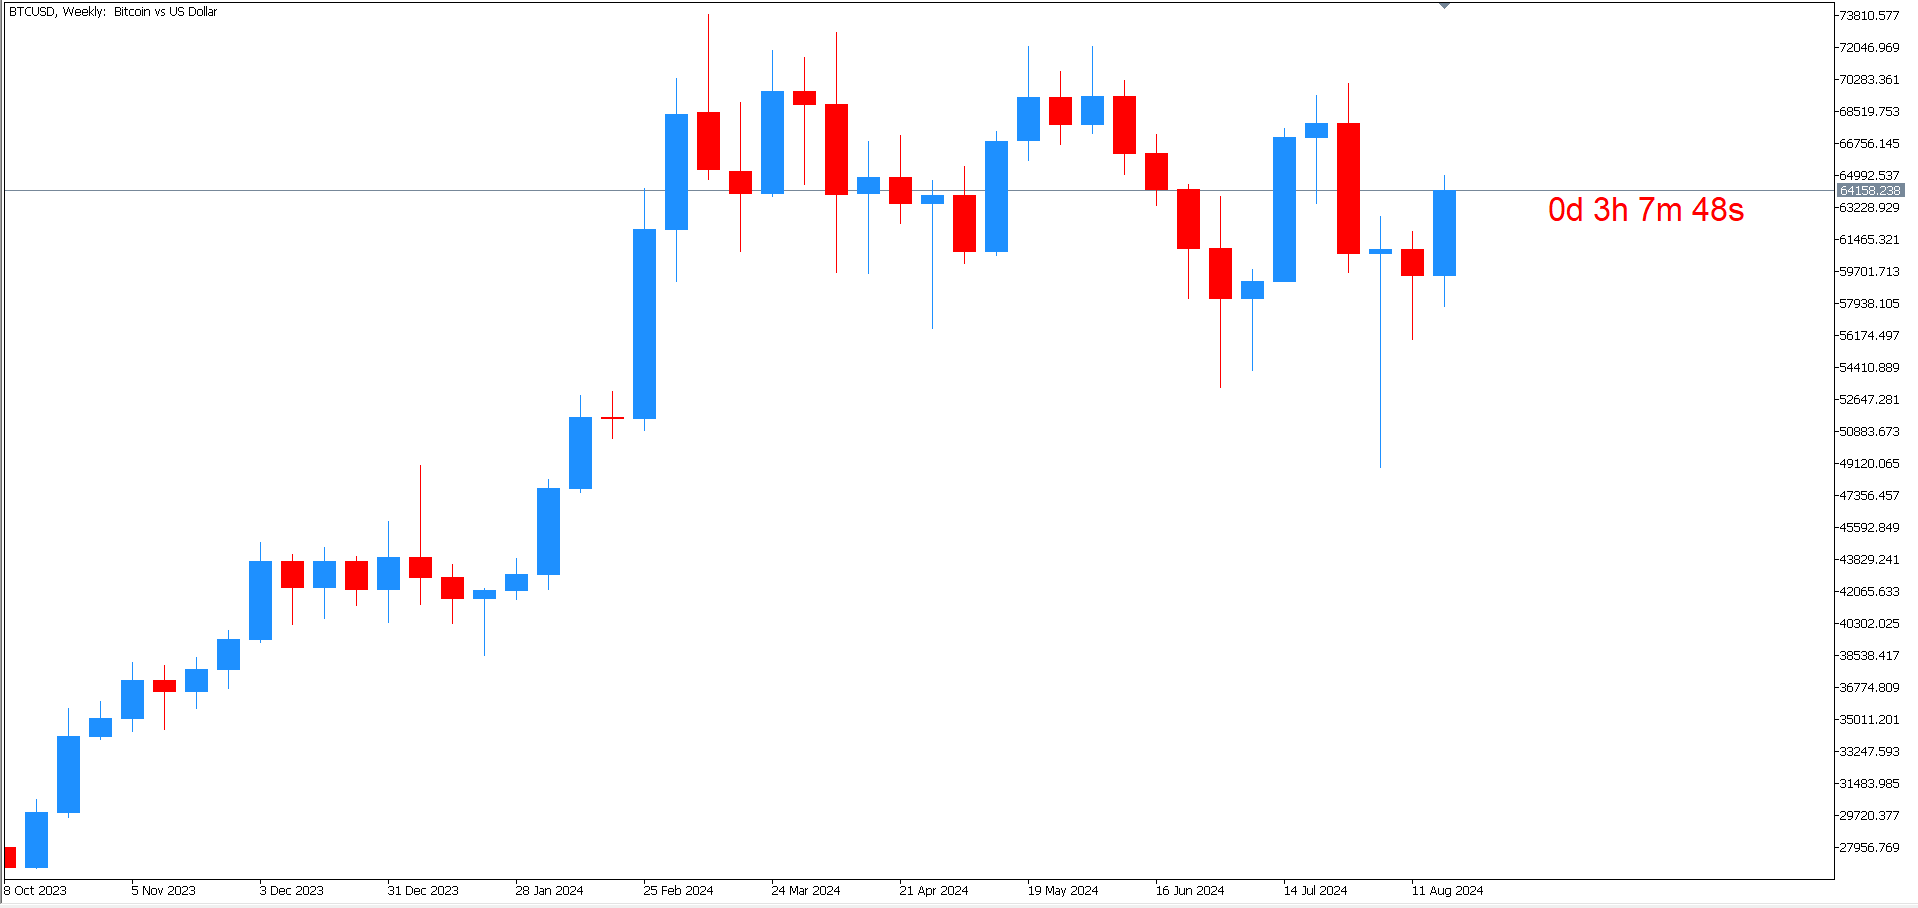
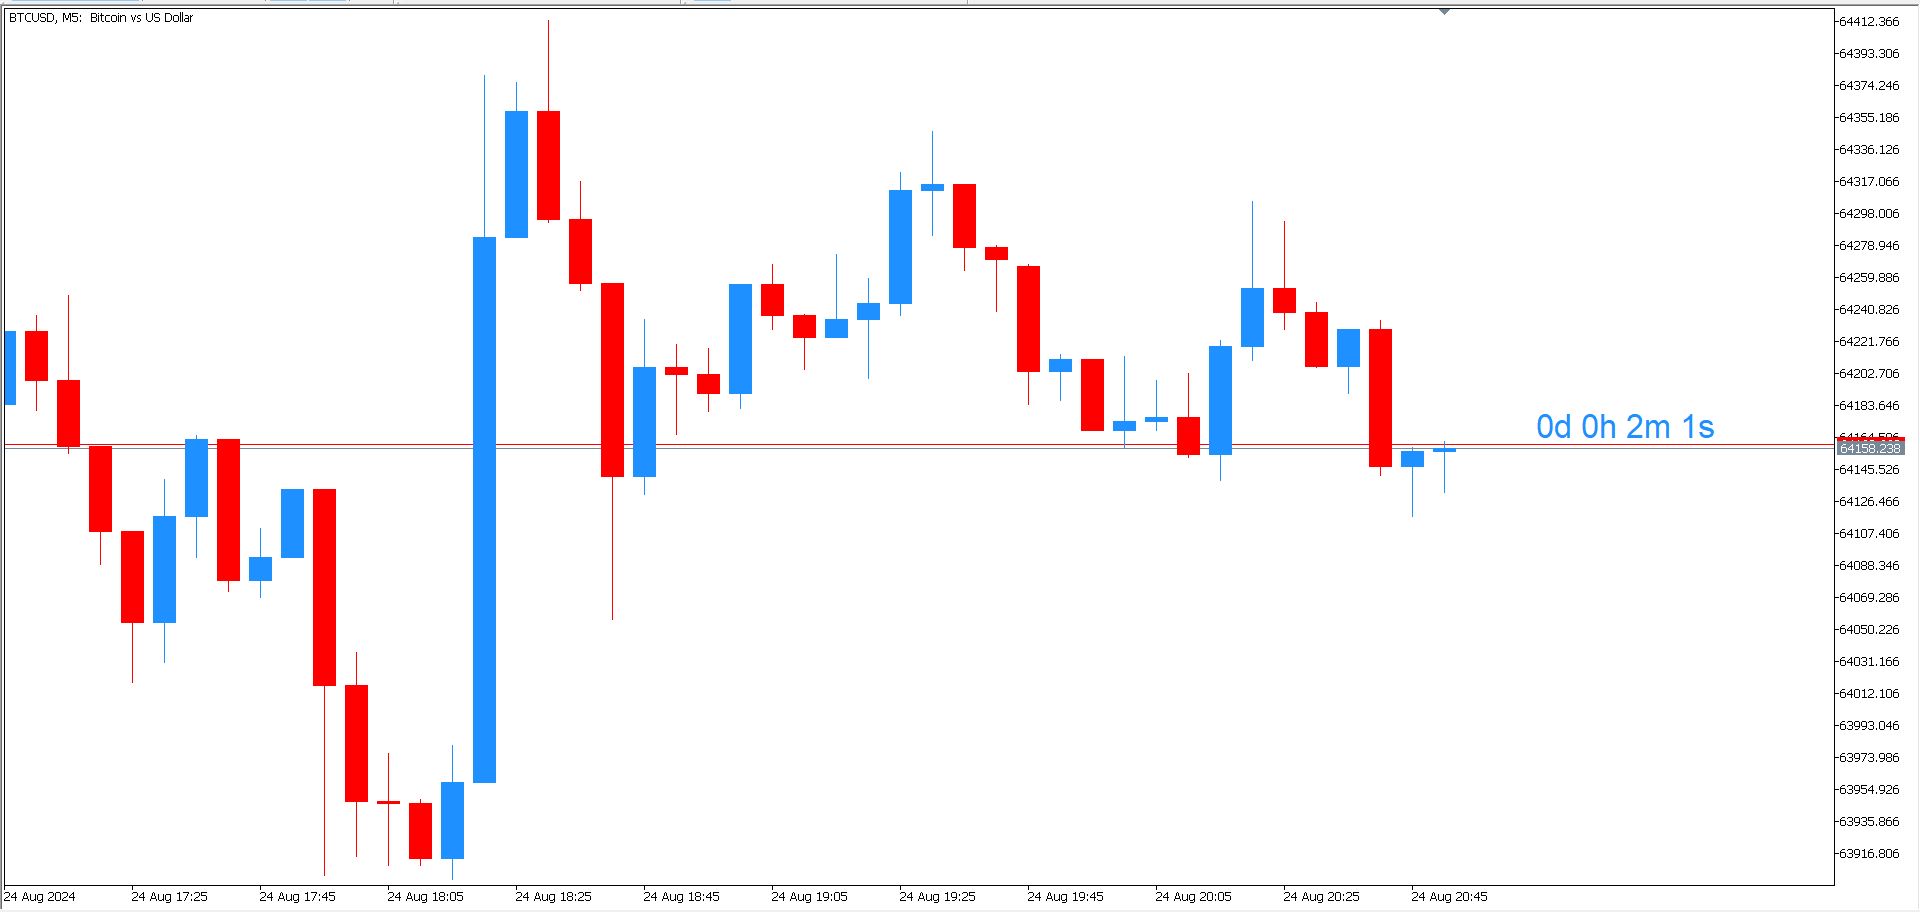
Wa Candle Timer MT4 is an indicator which shows the user how much time is remaining until the next candle will form.
When it remains less than 5% before the current candle will be closed, the color of the time changed.
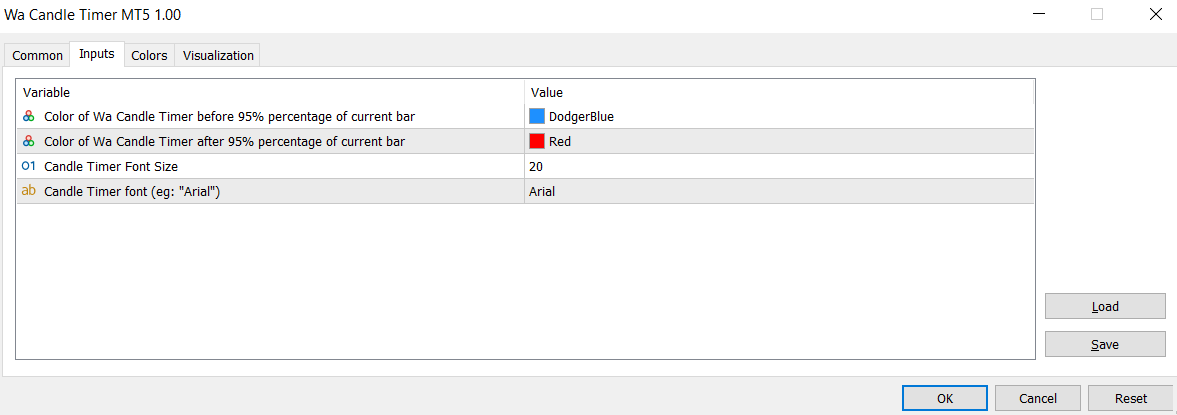
These are the settings:
1- Color of Candle Timer when it remains MORE than 5% percentage of current bar to be closed.
2- Color of Candle Timer when it remains LESS than 5% percentage of current bar to be closed.
3- Candle Timer Font Size.
4- Candle Timer font (e.g.: "Arial").