• 概述
  • 评论
  • 评论
  • 新特性

Trade Sniper

介绍 Trade Sniper:您在市场中的优势。


厌倦了错过有利可图的交易或陷入错误的市场局面?认识 Trade Sniper,这是一种尖端指标,它利用趋势的力量,为您的交易带来绝对优势。

Trend Sniper 不仅仅是另一个普通指标。它是一种复杂的工具,结合了先进的算法和久经考验的交易原则,可帮助您以惊人的准确度发现高概率的交易机会。

以下是 Trade Sniper 成为您在市场上的秘密武器的原因:

增强的趋势检测:我们专有的 AIgo 实时分析多个市场因素,以远远超过传统指标的精确度识别趋势。
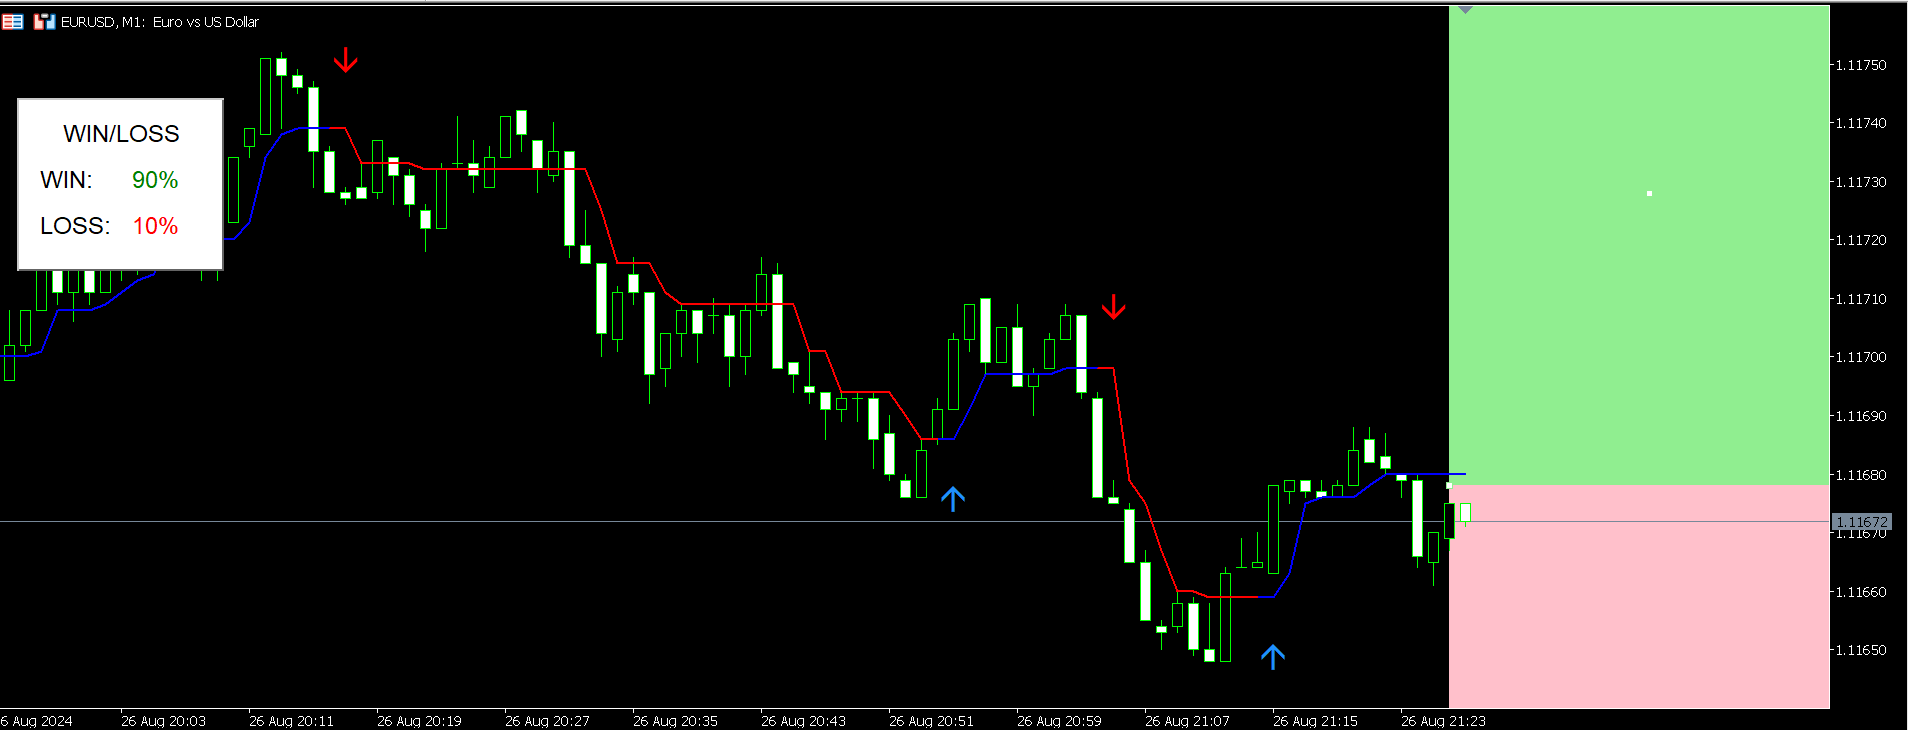
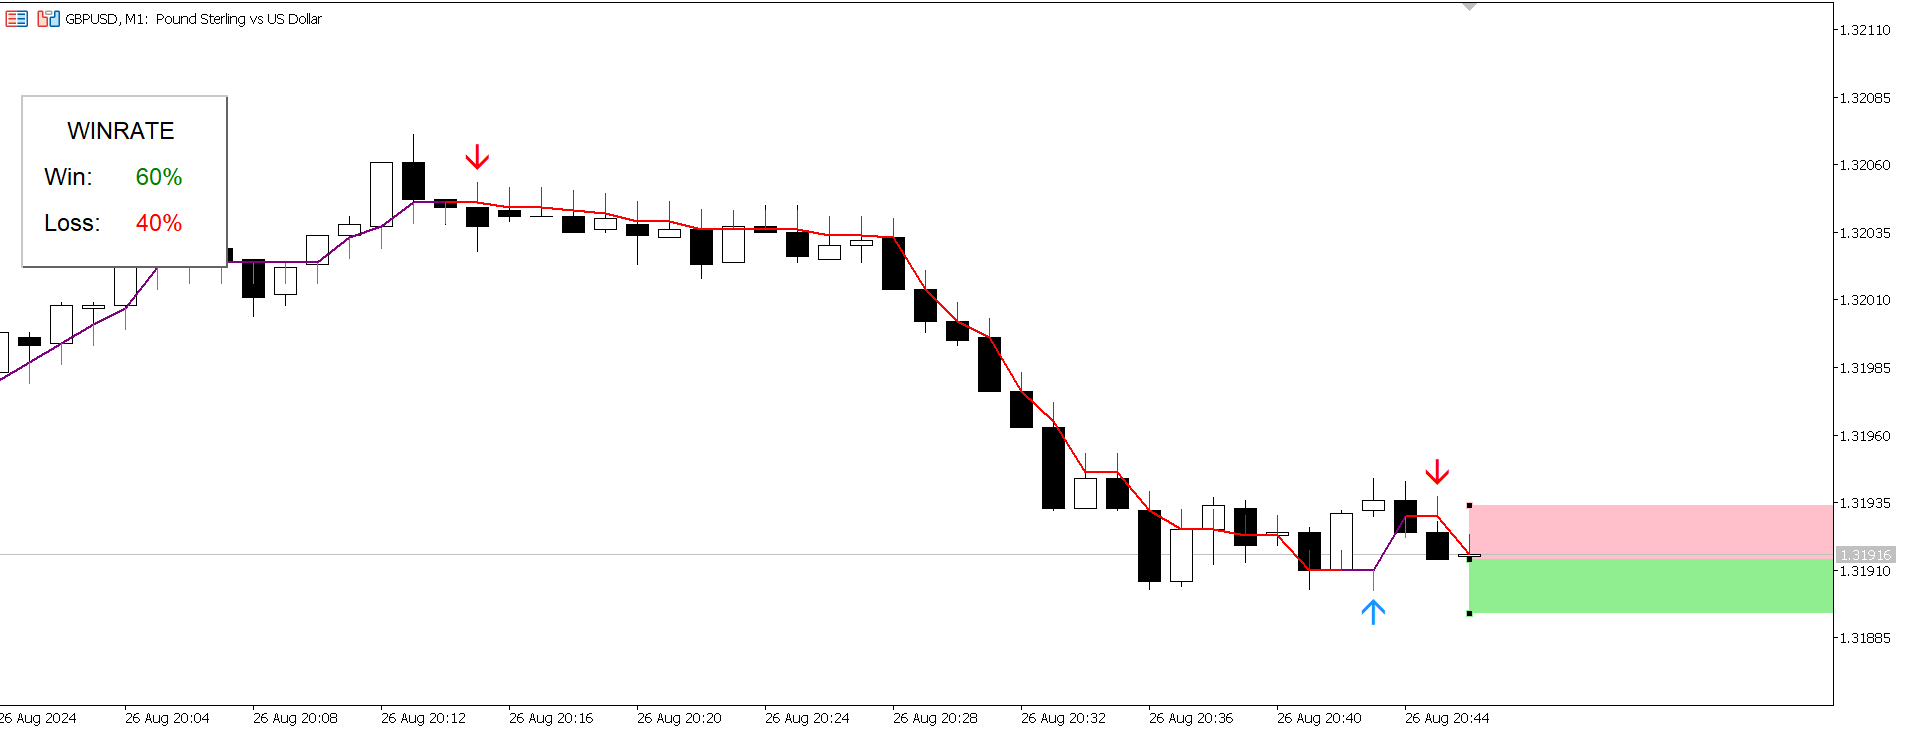
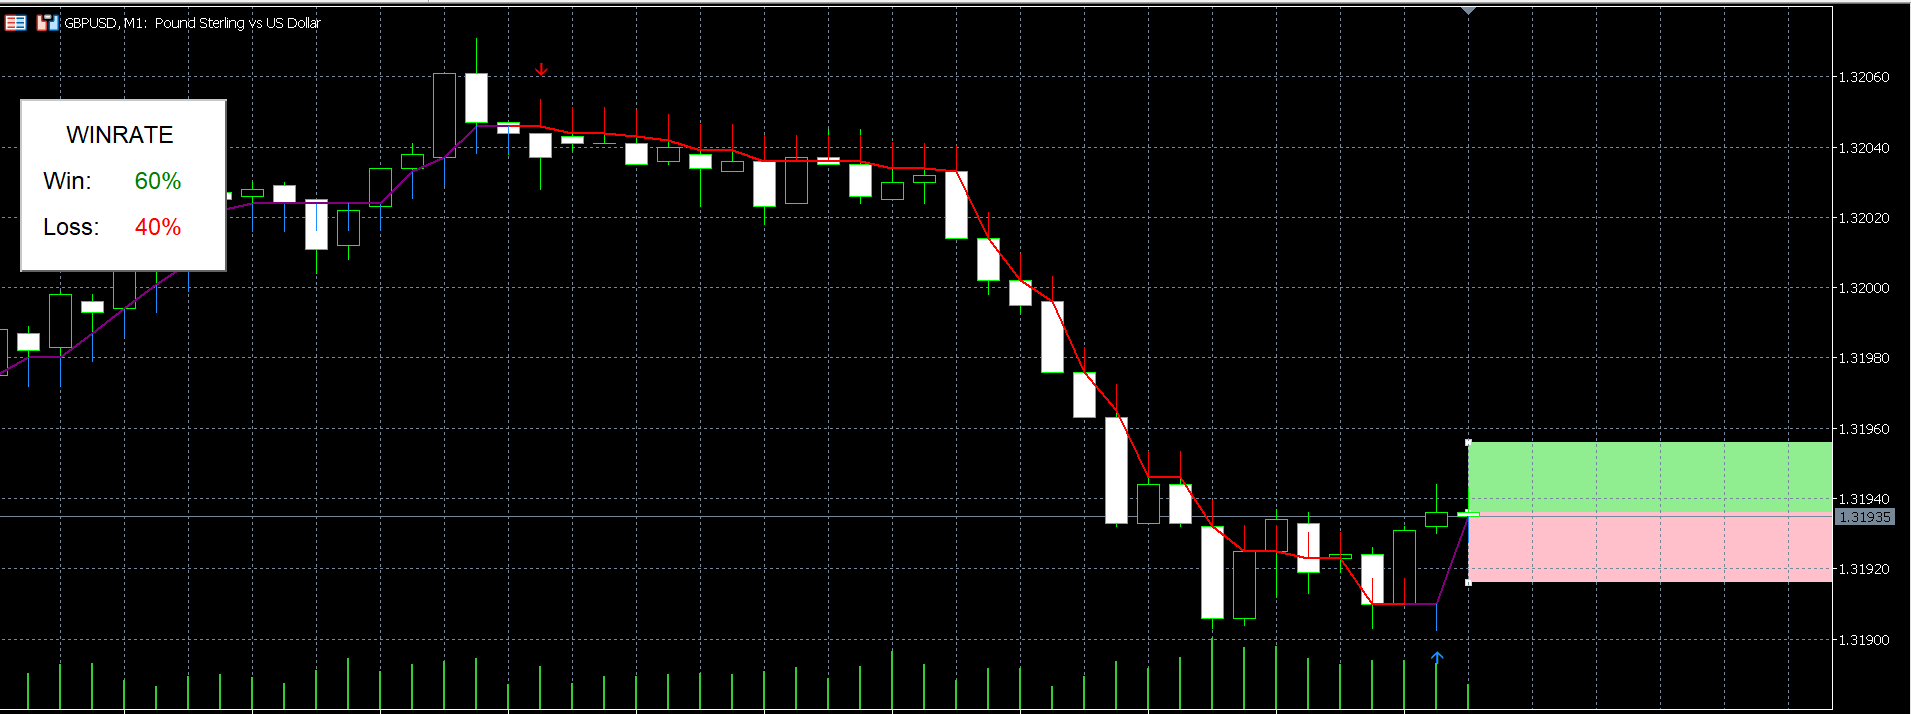
清晰的信号:告别令人困惑的图表混乱。Trade Sniper 在您的图表上为您提供清晰、可操作的买卖信号。
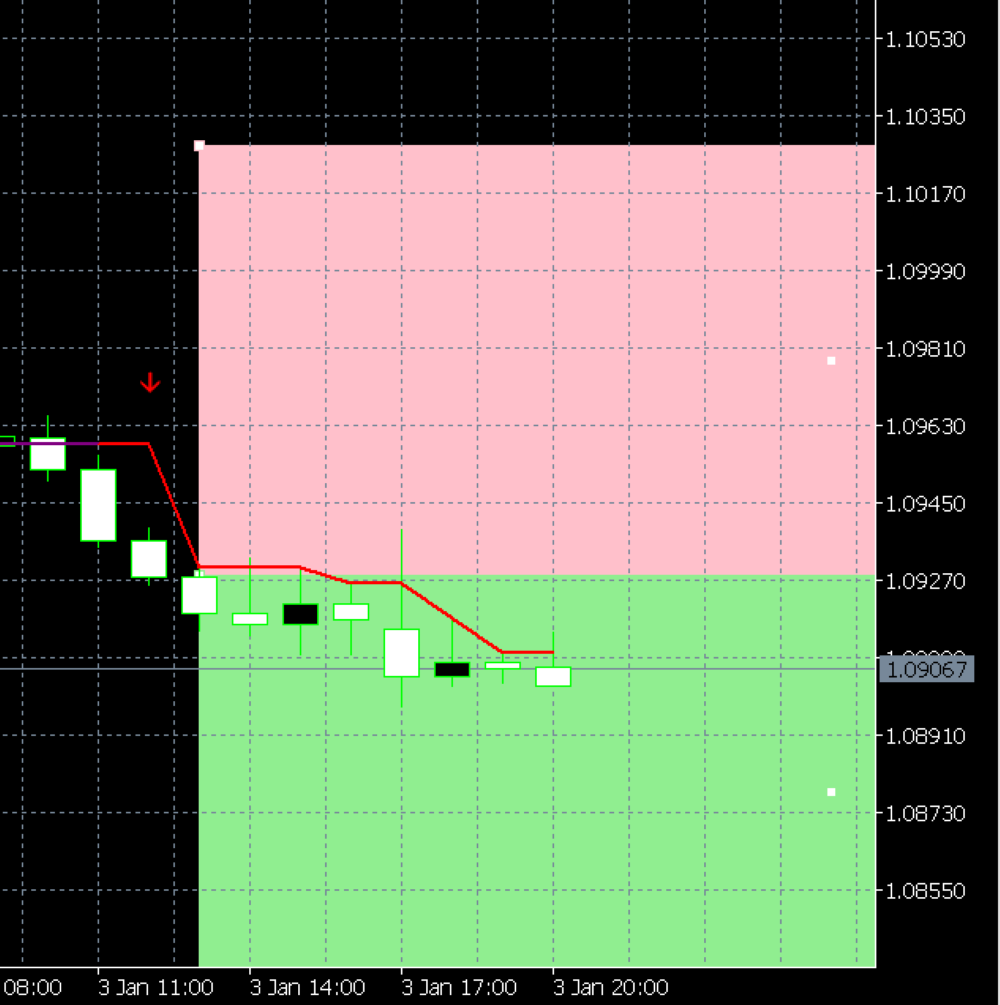
智能风险管理:创新的风险/回报框直观地显示您的潜在盈利和亏损区域,帮助您根据交易策略做出明智的决策。
自适应技术:Trade Sniper 的 AIgo 显示市场状况,确保其在不断变化的市场中保持敏锐的表现。
用户友好界面:尽管技术先进,Trade Sniper 仍然非常易于使用。非常适合新手交易者和经验丰富的专业人士。
绩效跟踪器:使用内置的赢/亏比率显示密切关注参数交易的成功,让您对自己的交易决策充满信心。
可自定义的警报:通过可自定义的警报通知您潜在的设置,再也不会错过交易机会。
Trade Sniper 不仅仅是一个指标 - 它是您的交易伙伴。它不知疲倦地分析市场,帮助您在管理风险的同时识别盈利机会。

无论您是寻求快速剥头皮的日内交易者,还是瞄准更大动作的波段交易者,Trade Sniper 都能适应您的风格。这就像拥有一支专家分析师团队昼夜不停地工作,将复杂的市场数据提炼成清晰、可操作的情报。

不要让另一笔有利可图的交易从您的指尖溜走。使用 Trade Sniper 装备自己,开始以专业人士的信心和精准度进行交易。您通往更稳定、更有利可图的交易的旅程从这里开始!

立即使用 Trade Sniper 升级您的交易武器库 - 交易与卓越交易的交汇!

贡献开发人员 Victor Chukwudumebi Ovorakpor - victorovorakpor - 交易者的个人资料 - MQL5 Algo Trading 社区
推荐产品
Color Histogram Volume Set
Ricardo Almeida Branco
Do you use volume in your reading of the market? Certainly many traders use it, and do not imagine operating without it. The Color Histogram Volume Set indicator allows the user to choose the value that he considers interesting to monitor. When you pass this you will have visual confirmation and if you want you will also have the audible alert that is given by the indicator. Of course, there are other ways to try to find a high volume, such as assessing whether the volume
Value Chart Candlesticks
Flavio Javier Jarabeck
4.67 (9)
The idea of a Value Chart indicator was presented in the very good book I read back in 2020 , " Dynamic Trading Indicators: Winning with Value Charts and Price Action Profile ", from the authors Mark Helweg and David Stendahl. The idea is simple and the result is pure genius: Present candlestick Price analysis in a detrended way! HOW TO READ THIS INDICATOR Look for Overbought and Oversold levels. Of course, you will need to test the settings a lot to find the "correct" one for your approach.
FREE
A countdown timer for the  Volume bar chart generator  and  Tick chart generator  products, which are available for download from the MQL5 Market: Tick chart generator: https://www.mql5.com/en/market/product/29215 Volume bar chart generator: https://www.mql5.com/en/market/product/47197 The counter conveniently displays the number of ticks or transactions (depending on the chart) that need to pass for a new bar to start printing. The user can set the following indicator inputs. Volume type
FREE
Blahtech Market Profile MT5
Blahtech Limited
5 (9)
Was: $249  Now: $99   Market Profile defines a number of day types that can help the trader to determine market behaviour. A key feature is the Value Area, representing the range of price action where 70% of trading took place. Understanding the Value Area can give traders valuable insight into market direction and establish the higher odds trade. It is an excellent addition to any system you may be using. Inspired by Jim Dalton’s book “Mind Over Markets”, this indicator is designed to suit the
Mt5 Market Profile
Mcblastus Gicharu Ndiba
Market Profile Introducing the Market Profile MetaTrader Indicator—your gateway to mastering market dynamics with precision and insight. This powerful tool delivers a classic Market Profile analysis, revealing price density over time and highlighting crucial levels, including the value area and control value for any trading session.  Compatible with timeframes from M1 to D1, it adapts to daily, weekly, monthly, or even intraday sessions, offering you unmatched flexibility. Lower timeframes pro
Aggression Volume
Flavio Javier Jarabeck
4.14 (14)
Aggression Volume Indicator is the kind of indicator that is rarely found in the MQL5 community because it is not based on the standard Volume data provided by the Metatrader 5 platform. It requires the scrutiny of all traffic Ticks requested on the platform... That said, Aggression Volume indicator requests all Tick Data from your Broker and processes it to build a very special version of a Volume Indicator, where Buyers and Sellers aggressions are plotted in a form of Histogram. Additionally,
FREE
Waves Sizer
Flavio Javier Jarabeck
3.4 (5)
Wyckoff fans, enjoy! Ideally to be used with the Weis Waves indicator, but it can be easily used alone, the Waves Sizer puts the range (in resulting Price movement) done by the Price on its market swings. You can control how accurate or loose will be the swings. This tool is very helpful for visually know how much the Price has traveled in your Timeframe. This way you can confront this level of effort with the resulting Volume, etc... Weis Waves indicator: https://www.mql5.com/en/market/pro
FREE
CVD SmoothFlow Pro
Thalles Nascimento De Carvalho
CVD SmoothFlow Pro - 适用于任何资产的无限量分析! CVD SmoothFlow Pro 是寻求精确和无限量分析的交易者的终极解决方案。该专业版利用累计成交量 delta (CVD) 并结合高级噪声过滤,为交易任何金融资产提供所需的灵活性和精确度。 CVD SmoothFlow Pro 提供了什么? 清晰分析 :过滤市场噪声,突显任何金融资产中的重要成交量变动。 ️ 精确计算 :监测买卖差异,提供外汇、指数、加密货币等资产的成交量行为的详细视图。 直观界面 :提供易于理解和高效的分析,数据呈现清晰明了。 趋势识别 :更自信地识别市场趋势,帮助做出明智决策。 实际应用: 实时监测任何资产中买卖双方的平衡。 基于成交量识别趋势反转。 精确过滤,关注外汇、指数、加密货币等资产中的重要变动。 无限制的专业版! 专业版提供无限制的所有功能访问权限,让您能够对任何金融资产进行详细和无限量的分析。
BoxChart MT5
Evgeny Shevtsov
5 (7)
The market is unfair if only because 10% of participants manage 90% of funds. An ordinary trader has slim changes to stand against these "vultures". This problem can be solved. You just need to be among these 10%, learn to predict their intentions and move with them. Volume is the only preemptive factor that faultlessly works on any timeframe and symbol. First, the volume appears and is accumulated, and only then the price moves. The price moves from one volume to another. Areas of volume accumu
Weis Waves
Flavio Javier Jarabeck
2.76 (17)
The original author is David Weis, an expert in the Wyckoff Method. The Weis Wave is a modern adaptation of the 1930's Wyckoff Method, another expert in Tape Reading techniques and Chart Analysis. Weis Waves takes market volume and stacks it into waves according to price conditions giving the trader valuable insights about the market conditions. If you want to learn more about this subject you can find tons of videos in YouTube. Just look for "The Wickoff Method", "Weis Wave" and "Volume Spread
FREE
Wapv Price and volume
Eduardo Da Costa Custodio Santos
BoxInside MT5
Evgeny Shevtsov
5 (3)
This indicator calculates the volume profile and places labels that correspond to the VAH, VAL and POC levels, for each candle individually. Indicator operation features The indicator works on the timeframes from M3 to MN, but it uses the history data of smaller periods: M1 - for periods from M3 to H1, M5 - for periods from H2 to H12, M30 - for the D1 period, H4 - for the W1 period, D1 - for the MN period. The color and location of the VAL, VAH and POC labels on the current candle are consider
FREE
Stackable VWAP
Flavio Javier Jarabeck
3.5 (4)
Volume Weighted Average Price (VWAP) is a trading benchmark commonly used by Big Players that gives the average price a Symbol has traded throughout the day. It is based on both Volume and price. Additionally we put in this indicator the MVWAP (Moving Volume Weighted Average Price). For those who do not know the usage and the importance od this indicator I recommend a great article about this subject at Investopedia ( https://www.investopedia.com/articles/trading/11/trading-with-vwap-mvwap.asp
FREE
This z-score indicator shows the correct z-score of an asset, as it uses the normalized price data for calculation, which is the only correct way. Z-score is only applicable for normal distributed data, therefore not the actual price is considered, but the normalised returns, which were assumed to follow a normal distribution. Returns are mean reverting and assumed to follow a normal distribution, therefore z-score calculation of returns is more reliable than z-score on price, as price is NOT m
Market Marker MT5
Evgeny Shevtsov
3.8 (5)
The indicator displays peak levels of activity formed by the maximum volume, tracks the correlation of the candles on all timeframes (from the highest to the lowest one). Each volume level is a kind of key trading activity. The most important cluster is inside a month, week, day, hour, etc. Indicator operation features A volume level receives Demand status if the nearest volume level located to the left and above has been broken upwards. A volume level receives Supply status if the nearest vol
Volumes Direction MT5
William Oswaldo Mayorga Urduy
卷方向 MT5 通常,当当前音量高于前一音量时,音量指示器具有默认的颜色变化,这很重要但不是很有用。 出于这个原因,这个指标的创建是为了除了正常的交易量之外,当蜡烛看涨或看跌时,它会为它们绘制不同的颜色,默认情况下看涨的蓝色和看跌的红色,但这些颜色可以定制为 商人的味道。 不要忘记查看我的其他指标,它们将帮助您改善交易。 卷方向 MT5 通常,当当前音量高于前一音量时,音量指示器具有默认的颜色变化,这很重要但不是很有用。 出于这个原因,这个指标的创建是为了除了正常的交易量之外,当蜡烛看涨或看跌时,它会为它们绘制不同的颜色,默认情况下看涨的蓝色和看跌的红色,但这些颜色可以定制为 商人的味道。 不要忘记查看我的其他指标,它们将帮助您改善交易。
Introduction to Chart Pattern MT Chart Pattern MT is a chart pattern scanner to detect the triangle pattern, falling wedge pattern, rising wedge pattern, channel pattern and so on. Chart Pattern MT uses highly sophisticated chart pattern detection algorithm. However, we have designed it in the easy to use with intuitive user interface. Chart Pattern MT will show all the patterns in your chart in the most efficient format for your trading. You do not have to do tedious manual pattern detection an
Description The indicator uses market profile theory to show the most relevant trading zones, on a daily basis. The zones to be shown are LVN (low volume nodes) and POC (point of control). An LVN zone is one which represents price areas with the least time or volume throughout the day. Typically, these areas indicate a supply or demand initiative, and in the future, they can turn into important breakout or retracement zones. A POC zone is one which represents price areas with the most time or vo
Gioteen Volatility Index (GVI) - your ultimate solution to overcoming market unpredictability and maximizing trading opportunities. This revolutionary indicator helps you in lowering your losing trades due to choppy market movements. The GVI is designed to measure market volatility, providing you with valuable insights to identify the most favorable trading prospects. Its intuitive interface consists of a dynamic red line representing the volatility index, accompanied by blue line that indicate
VWAP Indicator
LUC JACOBUS A VERHEECKE
4.13 (23)
Volume Weighted Average Price (VWAP) The volume weighted average price (VWAP) is a  trading   benchmark  used by traders that gives the average price a security has traded at throughout the day, based on both volume and price. It is important because it provides traders with insight into both the trend and value of a security. This indicator VWAP V2 is free and is the manual version of the extended Easy VWAP indicator (30 Euro), where the date and time properties are automatically entered. With
FREE
MIDAS Super VWAP
Flavio Javier Jarabeck
4.44 (9)
Imagine VWAP, MVWAP and MIDAS in one place... Well, you found it! Now you can track the movement of Big Players in various ways, as they in general pursue the benchmarks related to this measuring, gauging if they had good execution or poor execution on their orders. Traders and analysts use the VWAP to eliminate the noise that occurs throughout the day, so they can measure what prices buyers and sellers are really trading. VWAP gives traders insight into how a stock trades for that day and deter
FREE
Blahtech Supply Demand MT5
Blahtech Limited
4.54 (13)
Was: $299  Now: $99   Supply Demand uses previous price action to identify potential imbalances between buyers and sellers. The key is to identify the better odds zones, not just the untouched ones. Blahtech Supply Demand indicator delivers functionality previously unavailable on any trading platform. This 4-in-1 indicator not only highlights the higher probability zones using a multi-criteria strength engine, but also combines it with multi-timeframe trend analysis, previously confirmed swings
该指标的独特之处在于交易量核算算法:在所选时段内直接进行累积,而无需参考当天的开始。可以从计算中排除最后的柱线,那么当前数据对之前形成的显着水平(交易量)的影响较小。 为了更精确的计算,默认使用 M1 图表中的数据。规范了价格量的分配步骤。默认情况下,显示的右边框设置为用于分析的数据开头对应的栏,但如果需要,可以设置为您需要的栏。显示的音量带的长度(右边界)由系数调节,也可以向左或向右移动到 0(当前)条或参照当前条进行镜像。 参数: Accumulation period -  累积量计算周期 Number of excluded last bars - 从计算中排除的最后一根柱线的数量   Accumulation price step - 按价格参数的成交量总和步骤 Graph length multiplier -  显示数据的长度比例 Use data from timeframe - 用于分析的图表(时间范围) Graph show shift - 开始显示数据的移位,如果留为0,则数据将从分析数据周期开始时间对应的条开始显示; “-1”——显示在左侧; “-2” - 显示
No Demand No Supply MT5
Trade The Volume Waves Single Member P.C.
No Demand No Supply   This indicator identifies   No Demand –No Supply candles to your chart and plots volume bars colored according to the signal. It can be applied to all timeframes or to a specific one only. It can also be used as regular volume indicator  with exceptional future of WEIGHTED VOLUME. Furthermore is has an alert notification, sound and email when a signals occurs. The indicator does not repaint but the alert will come on two candles back due to the definition of No Demand No Su
Blahtech VWAP MT5
Blahtech Limited
5 (1)
Was: $69  Now: $34   Blahtech VWAP - Volume Weighted Average Price (VWAP) is the ratio of price to total volume. It provides an average price over a specified time interval.  Links [  Install  |  Update  |  Documentation   ] Feature Highlights Configurable VWAP Line Sessions, intervals, anchored or continuous Previous day settlement line Standard Deviation bands Alerts at bar close or real time Automatic Broker or Tick volumes Significantly reduced CPU usage Input Parameters Expert Advisor
Waves PRO
Flavio Javier Jarabeck
For those who appreciate Richard Wyckoff approach for reading the markets, we at Minions Labs designed a tool derived - yes, derived, we put our own vision and sauce into this indicator - which we called Waves PRO . This indicator provides a ZigZag controlled by the market volatility (ATR) to build its legs, AND on each ZigZag leg, we present the vital data statistics about it. Simple and objective. This indicator is also derived from the great book called " The Secret Science of Price and Volum
PZ Penta O MT5
PZ TRADING SLU
The Penta-O is a 6-point retracement harmonacci pattern which usually precedes big market movements. Penta-O patterns can expand and repaint quite a bit. To make things easier this indicator implements a twist: it waits for a donchian breakout in the right direction before signaling the trade. The end result is an otherwise repainting indicator with a very reliable trading signal. The donchian breakout period is entered as an input. [ Installation Guide | Update Guide | Troubleshooting | FAQ | A
Moving VVC mt5
Andriy Sydoruk
The   Visual Volatility Clustering   indicator clusters the market based on volatility. The indicator does not redraw and gives accurate data, does not use closing prices. Uses the opening prices or the highs or lows of the previous completed bar. Therefore, all information will be clear and unambiguous. The essence of the indicator is to divide the price market into certain areas according to a similar type of volatility. This can be done in any way. In this example, the indicator is configure
BoxProfile MT5
Evgeny Shevtsov
4.5 (8)
The indicator displays volume profiles based on the nesting principle. Profiles periods are pre-set so that each subsequent profile has a length twice as long as the length of the previous profile. In addition to profiles, the indicator displays volume clusters sorted by color, depending on the volume they contain. Indicator operation features The indicator works on typical timeframes from M5 to MN, but for calculations uses historical data from smaller timeframes: M1 - for timeframes from M5
FREE
VP hidden
Emr Aljnaby
4 (6)
The indicator works to convert normal volume into levels and determine financial liquidity control points. It is very similar in function to Fixed Volume Profile. But it is considered more accurate and easier to use than the one found on Trading View because it calculates the full trading volumes in each candle and in all the brokers present in MetaTrade, unlike what is found in Trading View, as it only measures the broker’s displayed prices. To follow us on social media platforms: tel
FREE
该产品的买家也购买
TPSpro RFI Levels MT5
Roman Podpora
4.73 (11)
指示       俄罗斯 -        英语   建议 与指示器一起使用     -       TPSpro 趋势专业版 -   MT4版本       交易中的一个关键要素是做出买卖交易工具决定的区域或水平。尽管主要参与者试图隐藏他们在市场中的存在,但他们不可避免地会留下痕迹。我们的任务是学习如何识别这些痕迹并正确解释它们。 主要功能: 向卖家和买家显示活跃区域! 该指标显示所有正确的初始买入和卖出脉冲水平/区域。激活这些水平/区域后,开始寻找切入点,水平会改变颜色并填充特定阴影。此外,还会显示箭头,以便更直观地了解情况。 显示更高时间范围内的级别/区域(MTF 模式) 添加了使用更高时间间隔显示级别/区域的功能。此外,该指标还具有自动趋势检测功能(   TPSproTREND PRO   )。 用于交易的单独专业的逐步算法。 该算法专为日内交易而设计,既可顺势交易,也可逆势交易。每个活动模板均提供详细说明。 适用于多种时间范围 。 TPSpro RFI 水平指标可用于图表上的任何时间范围,从一分钟(M1)开始一直到每月(MN)。 图形和声音警报。 该指标提供图形和声音指示
Atomic Analyst MT5
Issam Kassas
4.42 (19)
首先值得强调的是,该交易指标是非重绘、非延迟的指标,这使其成为手动和机器人交易的理想选择。 用户手册:设置、输入和策略。 Atomic Analyst是一种PA价格行动指标,利用价格的力量和动量来寻找市场上更好的机会。配备了高级过滤器,可帮助去除噪音和假信号,并提高交易潜力。使用多层复杂的指标,Atomic Analyst扫描图表,并将复杂的数学计算转化为任何初学者都能理解并用来做出一致交易决策的简单信号和颜色。 “Atomic Analyst”是专为新手和经验丰富的交易者量身定制的综合交易解决方案。它将高级指标和一流功能融合为一体的交易策略,使其成为所有类型交易者的多功能选择。 日内交易和剥头皮策略:专为快速准确的日内交易和短期交易而设计。 日内和摆动交易策略:可用作追求价格大幅波动的日内和摆动交易者的可靠工具。 多货币和市场:凭借其可靠的精度,在不同的工具和市场上运作。 多个时间框架:可在多个时间框架上使用,性能良好。 稳定性:所有指标均不重绘、不重绘和不滞后,确保可靠的信号。 信号清晰度:提供箭头信号,用于清晰的入场和出场点。 实时警报:通过交易入场、SL和TP警报通知交
Atbot
Zaha Feiz
4.91 (34)
AtBot: 它是如何工作的以及如何使用它 ### 它是如何工作的 “AtBot”指标用于MT5平台,通过结合技术分析工具生成买入和卖出信号。它集成了简单移动平均线(SMA)、指数移动平均线(EMA)和平均真实波幅(ATR)指标,以识别交易机会。此外,它还可以利用Heikin Ashi蜡烛来增强信号的准确性。 购买后留下评论,您将获得特别的奖励礼物。 ### 主要特点: - 不重绘: 信号在绘制后不会改变。 - 不变动: 信号保持一致,不会被更改。 - 无延迟: 提供及时的信号,没有延迟。 - 多种时间框架: 可在任何时间框架上使用,以适应您的交易策略。 ### 操作步骤: #### 输入和设置: - firstkey (TrendValue): 调整趋势检测的灵敏度。 - Secondkey (SignalValue): 定义买入/卖出信号生成的灵敏度。 - masterkey (ExitValue): 控制信号的退出策略。 - h: 切换是否根据Heikin Ashi蜡烛生成信号(真/假)。 - notifications: 启用或禁用信号提醒。 #### ATR计算: ATR测
Gold Stuff mt5
Vasiliy Strukov
4.92 (165)
Gold Stuff mt5 是专为黄金设计的趋势指标,也可用于任何金融工具。 该指标不会重绘,也不会滞后。 推荐时间框架 H1。 购买后立即联系我以获得设置和个人奖励!   你可以在我的个人资料中找到它。   重要! 购买后立即与我联系,以获得说明和奖金!   您可以免费收到我们的强力支持和趋势扫描指标的副本,请私信。大部头书!   设置 绘制箭头 - 打开关闭。 在图表上绘制箭头。 警报 - 打开关闭声音警报。 电子邮件通知 - 打开关闭。 电子邮件通知。 Puch-notification - 打开关闭。 推送通知。 接下来,调整色域。 Gold Stuff mt5 是专为黄金设计的趋势指标,也可用于任何金融工具。 该指标不会重绘,也不会滞后。 推荐时间框架 H1。 购买后立即联系我以获得设置和个人奖励!   设置 绘制箭头 - 打开关闭。 在图表上绘制箭头。 警报 - 打开关闭声音警报。 电子邮件通知 - 打开关闭。 电子邮件通知。 Puch-notification - 打开关闭。 推送通知。 接下来,调整色域。
首先,值得强调的是,这个交易系统是一个非重绘、非重画和非滞后的指标,这使得它非常适合手动和机器人交易。 在线课程,手册和下载预设。 “智能趋势交易系统 MT5”是专为新手和经验丰富的交易者量身定制的综合交易解决方案。它结合了超过 10 个优质指标,具有 7 多个强大的交易策略,使其成为适用于各种市场条件的多功能选择。 趋势跟随策略:提供精确的入场和止损管理,以有效地跟随趋势。 反转策略:识别潜在的趋势反转,使交易者能够利用区域市场的机会。 剃头策略:专为快速准确的日内交易和短期交易而设计。 稳定性:所有指标都不会重绘、不会重画和不会滞后,确保可靠的信号。 定制:支持自定义策略,以满足个人交易偏好。超过 7 种策略和组合可帮助您找到最佳策略。 信号清晰度:提供箭头信号,以指示清晰的入场和退出点。 实时警报:通过交易进出警报使交易者保持了解。 深入分析:提供更高时间框架的趋势分析和实时交易监控。 自适应颜色编码:利用蜡烛颜色编码来显示成交量、趋势和反转蜡烛信号。通过蜡烛颜色分析市场方向。 “智能趋势交易系统 MT5”赋予交易者必要的工具,以便在各种市场条件下做出明智和战略性的交易决策。无论
Quantum Trend Sniper
Bogdan Ion Puscasu
4.8 (49)
介绍   量子趋势狙击指标 ,突破性的 MQL5 指标,正在改变您识别和交易趋势反转的方式!由拥有超过13年交易经验的资深交易员团队开发,     量子趋势狙击指标   旨在通过其创新的方式以极高的准确度识别趋势反转,将您的交易之旅推向新的高度。 ***购买量子趋势狙击指标,即可免费获得量子突破指标!*** 当量子突破指标识别出趋势反转时,它会向您发出警报和信号箭头,并建议您三个止盈水平。 它既适合新手交易者,也适合专业交易者。 量子 EA 通道:       点击这里 MT4版本:       点击这里 建议: 时间范围: 所有时间范围。为了获得最佳结果,我们建议在 M15、M30 和 H1 时间范围内使用它。 货币对:欧元兑美元、英镑兑美元、澳元兑美元、欧元兑英镑、, EURAUD,  XAUUSD 账户类型:ECN、Raw 或 Razor,点差极低 经纪时间:任意 经纪商:IC Markets、Pepperstone with Raw 和 Razor 的点差最低 建议止损:50 点 建议止盈水平:20 点、50 点和
该仪表盘显示所选符号的最新可用谐波形态,因此您可以节省时间并提高效率 /  MT4 版本 。 免费指标:  Basic Harmonic Pattern 指标列 Symbol:   显示所选符号 Trend:     看涨或看跌 Pattern:    形态类型(Gartley、蝴蝶、蝙蝠、螃蟹、鲨鱼、Cypher 或 ABCD) Entry:     入口价格 SL: 止损价 TP1: 第一止盈价 TP2: 第二次获利价格 TP3: 第三次获利价格 Current price:    当前价格 Age (in bars):   最后绘制的模式的年龄 主要输入 Symbols :   从 "28 种主要货币对 "或 "选定符号 "中选择。 Selected Symbols :   希望监控的符号,用逗号分隔("EURUSD,GBPUSD,XAUUSD")。如果您的经纪商为货币对设置了后缀或前缀,您必须在以下两个参数中添加(货币对前缀或货币对后缀)。 Max Iteration:   调整模式的最大迭代次数(如果该值越小,则模式越少,性能越快;如果该值越大,则模式越多,性能
FX Power MT5 NG
Daniel Stein
5 (5)
通过 mql5 和 Telegram 上 的晨间简报获取每日市场更新,包括详细信息和屏幕截图 ! FX Power MT5 NG 是我们长期以来非常受欢迎的货币强度计算器 FX Power 的下一代产品。 这款下一代强度计算器能提供什么?您所喜爱的原版 FX Power 的所有功能 附加功能 黄金/XAU 强度分析 更精确的计算结果 可单独配置的分析周期 可自定义计算限制,以获得更好的性能 为希望查看更多信息的用户提供特殊的多实例设置 无尽的图形设置,可在每个图表中设置您最喜欢的颜色 无数的通知选项,让您再也不会错过任何重要信息 采用 Windows 11 和 macOS 风格的全新圆角设计 神奇的移动指标面板 FX Power 主要功能 所有主要货币的完整强势历史 所有时间框架内的货币强弱历史 所有经纪商和图表的计算结果完全相同 100% 可靠的实时计算 -> 无重绘 可通过下拉列表选择分析时段 通过自定义模式单独配置分析时段 可在一个图表中使用多个实例 可移动 FX Power 显示屏(通过拖放) 适用于高分辨率 QHD、UHD 和 4K 显示器 自动终端配置 针对平板电脑
Trend Screener Pro MT5
STE S.S.COMPANY
4.87 (63)
使用趋势筛选指标释放趋势交易的力量:由模糊逻辑和多货币系统提供支持的终极趋势交易解决方案! 使用趋势筛选器(由模糊逻辑提供支持的革命性趋势指标)提升您的趋势交易。 它是一个强大的趋势跟踪指标,结合了超过 13 种高级工具和功能以及 3 种交易策略,使其成为使您的 Metatrader 成为趋势分析器的多功能选择。 限时优惠:趋势筛选指标终身仅需 50 美元。 ( 原价 250$ ) (优惠延长) 体验趋势筛选器 100% 无需重新绘制的准确性,确保您的交易决策不受过去价格变化的影响。 释放多时间框架和多货币功能的多功能性,使您能够以无与伦比的信心在外汇、商品、加密货币和指数领域进行交易。 利用 Trend Screener 的综合策略套件增强您的交易: - 趋势跟踪策略和趋势延续策略 :趋势筛选器的趋势跟踪策略提供清晰的趋势延续信号,让您有效捕捉趋势走势并管理风险。 - 反转策略和早期入场点策略 :趋势筛选器的反转策略可检测市场方向的潜在变化,使您能够预测趋势反转并利用疲弱的市场趋势。通过早期入场点,您可以在潜在的趋势变化之前定位自己 获取可观的利润。 - 倒卖策略: 趋势筛选器的倒卖
首先,值得强调的是,这个交易工具是非重绘、非重画和非滞后的指标,非常适合专业交易。 在线课程,用户手册和演示。 智能价格行动概念指标是一个非常强大的工具,既适用于新手,也适用于经验丰富的交易者。它将超过20个有用的指标合并到一个指标中,结合了高级交易思想,如内圈交易员分析和智能资金概念交易策略。该指标侧重于智能资金概念,提供有关大型机构交易方式的见解,帮助预测它们的动向。 它在流动性分析方面尤其擅长,有助于理解机构的交易方式。它擅长预测市场趋势,并仔细分析价格波动。通过将您的交易与机构策略对齐,您可以更准确地预测市场走向。该指标多才多艺,擅长分析市场结构,识别重要的订单区块,并识别各种模式。 它擅长识别BOS和CHoCH等模式,理解动量的转变,并突出显示供需强劲的关键区域。它还擅长发现强大的不平衡,并分析价格创造更高高点或更低低点的模式。如果您使用斐波那契回撤工具,该指标可以满足您的需求。它还可以识别相等的高点和低点,分析不同的时间框架,并通过仪表板显示数据。 对于使用更高级策略的交易者,该指标提供了工具,如公平价值差指标和优惠和折扣区域的识别。它特别关注高时间框架订单
AT Forex Indicator MT5
Marzena Maria Szmit
5 (4)
The AT Forex Indicator MT5 is a sophisticated trading tool designed to provide traders with a comprehensive analysis of multiple currency pairs. This powerful indicator simplifies the complex nature of the forex market, making it accessible for both novice and experienced traders. AT Forex Indicator uses advanced algorithms to detect trends, patterns and is an essential tool for traders aiming to enhance their forex trading performance. With its robust features, ease of use, and reliable signal
TrendMaestro5
Stefano Frisetti
note: this indicator is for METATRADER4, if you want the version for METATRADER5 this is the link:  https://www.mql5.com/it/market/product/108106 TRENDMAESTRO ver 2.4 TRENDMAESTRO recognizes a new TREND in the bud, he never makes mistakes. The certainty of identifying a new TREND is priceless. DESCRIPTION TRENDMAESTRO identifies a new TREND in the bud, this indicator examines the volatility, volumes and momentum to identify the moment in which there is an explosion of one or more of these data a
TPA True Price Action indicator reveals the true price action of the market makers through 100% non-repainting signals strictly at the close of a candle! TPA shows entries and re-entries, every time the bulls are definitely stronger than the bears and vice versa. Not to confuse with red/green candles. The shift of power gets confirmed at the earliest stage and is ONE exit strategy of several. There are available now two free parts of the TPA User Guide for our customers. The first "The Basics"
FxaccurateLS
Shiv Raj Kumawat
WHY IS OUR FXACCCURATE LS MT5 THE PROFITABLE ? PROTECT YOUR CAPITAL WITH RISK MANAGEMENT Gives entry, stop and target levels from time to time. It finds Trading opportunities by analyzing what the price is doing during established trends. POWERFUL INDICATOR FOR A RELIABLE STRATEGIES We have made these indicators with a lot of years of hard work. It is made at a very advanced level. Established trends provide dozens of trading opportunities, but most trend indicators completely ignore them!
Auto Order Block with break of structure based on ICT and Smart Money Concepts (SMC) Futures Break of Structure ( BoS )             Order block ( OB )            Higher time frame Order block / Point of Interest ( POI )    shown on current chart           Fair value Gap ( FVG ) / Imbalance   -  MTF      ( Multi Time Frame )    HH/LL/HL/LH  -  MTF      ( Multi Time Frame )  Choch  MTF      ( Multi Time Frame )  Volume Imbalance     ,  MTF          vIMB Gap’s Power of 3 Equal High
Advanced Supply Demand MT5
Bernhard Schweigert
4.5 (14)
任何新手或专业交易者的最佳解决方案! 该指标是一款独特、高质量、且价格合理的交易工具,因为我们已经整合了许多专有功能和新公式。 依据此更新,您将能够显示双重时间帧区域。 您不仅可以显示一个较高的时间帧,还可以同时显示图表时间帧,加上更高的时间帧:显示嵌套时区。 供需双方所有交易者都会喜欢它。 :) 重要信息披露 高级供需的最大潜力,请访问 https://www.mql5.com/zh/blogs/post/720245   想象您的交易如何得以改善,是因为您能够精准定位入场或目标位吗? 构建于新的底层算法,它可以更轻松地识别出买卖双方之间的潜在失衡。 这是因为它以图形方式展示供需最强劲区域,及其过去的表现(显示旧区域)。 这些功能旨在帮助您更轻松地发现最佳入场区域和价位。 现在您可以针对您的交易品种和时间帧来优化和编辑区域强度! 高级供需指标适用于所有产品和时间帧。 它是一个新的公式,非常新的功能是两个区域强度函数可由用户输入进行调整! 这在交易中是一大优势。 当您学习如何使用专有功能,例如带有价格游离最小 X 因子的区域强度时,您能够判断该区域强劲与否。 供需区域用作警报触发器
ICT, SMC, SMART MONEY CONCEPTS, SMART MONEY, Smart Money Concept, Support and Resistance, Trend Analysis, Price Action, Market Structure, Order Blocks, BOS/CHoCH,   Breaker Blocks ,  Momentum Shift,   Supply&Demand Zone/Order Blocks , Strong Imbalance,   HH/LL/HL/LH,    Fair Value Gap, FVG,  Premium  &   Discount   Zones, Fibonacci Retracement, OTE, Buy Side Liquidity, Sell Side Liquidity, BSL/SSL Taken, Equal Highs & Lows, MTF Dashboard, Multiple Time Frame, BigBar, HTF OB, HTF Market Structure
ICT,SMC,智能货币概念,支撑和阻力,趋势分析,价格行为,市场结构,订单区块,突破区块,动量转变,强大的不平衡,HH/LL/HL/LH,公允价值差距,FVG,溢价和折扣区域,斐波那契回撤,OTE,买方流动性,卖方流动性,流动性空白,市场交易时间段,NDOG,NWOG,银弹,ICT模板。 在金融市场中,准确的市场分析对于投资者来说至关重要。为了帮助投资者更好地理解市场趋势和流动性,我们提供了一份使用教程,旨在实现高级市场分析功能。以下是一些功能的简要介绍和实现方法: 1. 显示高时间框架市场结构:    通过设置参数,您可以在图表上显示高时间框架市场结构。这将帮助您更好地理解市场的整体走势和结构。您可以根据自己的需求设置时间周期,并在图表上显示市场结构。 2. 显示流动性:    流动性是市场的重要指标之一。通过设置参数,您可以在图表上显示买方和卖方的流动性。您可以自定义文本和颜色,以便更好地识别不同的流动性水平。您还可以选择显示伦敦AM会话和纽约午餐时间的流动性。 3. 显示公平价值差距:    公平价值差距是指市场价格与公平价值之间的差异。通过设置参数,您可以在图表上显示公平价
Entry Points Pro for MT5
Yury Orlov
4.46 (124)
这款指标用于 MT5,可提供准确的入场交易信号,且无重绘。 它可应用在任何金融资产:外汇、加密货币、贵金属、股票、指数。 它将提供极其精准的评估,并告诉您何时开仓和平仓的最佳时机。 观看 视频 (6:22),其中包含一个仅处理单一信号的示例,该信号即可值回指标购价! 大多数交易者在 Entry Points Pro 指标的帮助下,在第一个交易周内即改善了他们的交易结果。 订阅我们的 Telegram 群 ! Entry Points Pro 指标的益处。 入场信号无重绘 如果信号出现,并得到确认,则它不会再消失;不像是重绘指标,它会导致重大的财产损失,因为它们可以在显示信号后再将其删除。 无差错开仓 指标算法可令您找到入场交易(买入或卖出资产)的理想时机,从而提高每位交易者的成功率。 Entry Points Pro 可操作任何资产 它允许您在 MT5 平台上交易任何经纪商的加密货币、股票、贵金属、指数、大宗商品和货币。 提供任何方向的信号 Entry Points Pro 指标提供针对任意价格走势的入场交易信号 - 上涨、下跌或横盘(横向)。
Matrix Arrow Indicator MT5
Juvenille Emperor Limited
5 (12)
矩阵箭头指标 MT5   是一种独特的 10 合 1 趋势,遵循   100% 非重绘多时间框架指标 ,可用于所有符号/工具: 外汇 、 商品 、 加密货币 、 指数 、 股票 。 Matrix Arrow Indicator MT5 将在其早期阶段确定当前趋势,从多达 10 个标准指标中收集信息和数据,它们是: 平均定向运动指数 (ADX) 商品渠道指数 (CCI) 经典 Heiken Ashi 蜡烛 移动平均线 移动平均收敛散度 (MACD) 相对活力指数 (RVI) 相对强弱指数 (RSI) 抛物线SAR 随机振荡器 威廉姆斯的百分比范围 当所有指标给出有效的买入或卖出信号时,相应的箭头将打印在图表上,在下一根蜡烛/柱线开盘时,指示强劲的上升趋势/下降趋势。用户可以选择使用哪些指标,并可以单独调整每个指标的参数。 Matrix Arrow Indicator MT5 仅从选定的指标中收集信息,并仅根据其数据打印箭头。   Matrix Arrow Indicator MT5   还可以为所有新信号发送终端、推送通知或电子邮件警报。无论您是黄牛、日内交易者还是波段交易者, Mat
IX Power MT5
Daniel Stein
4.17 (6)
IX Power 终于将 FX Power 的无与伦比的精确性带到了非外汇交易符号中。 它能准确判断您喜爱的指数、股票、商品、ETF 甚至加密货币的短期、中期和长期趋势强度。 您可以 分析 终端提供的 一切 。试试吧,体验一下您在交易时如何把握 时机 。 IX Power 主要功能 100% 精确的非重绘计算结果 - 适用于您终端中的所有交易符号 下拉式选择预配置以及可单独配置的强度分析周期 通过电子邮件、消息和手机通知的无数种通知选项 可访问的 EA 请求缓冲区 可自定义计算限制,以获得更好的性能 为希望查看更多信息的用户提供特殊的多实例设置 无尽的图形设置,让您在每个图表中都能找到最喜欢的颜色 采用 Windows 11 和 macOS 风格的圆角新面板设计 神奇的移动指标面板,可在子窗口和主图表之间无缝移动 适用于高分辨率 QHD、UHD 和 4K 显示器,并针对平板电脑和触摸屏进行了优化 IX Power 参数 最重要的参数不言自明,但我们很快会在另一篇文章中为您提供所有 IX Power 参数的完整说明。 使用别名 "参数可为技术交易符号
The 1 2 3 Pattern Scanner MT5
Reza Aghajanpour
5 (18)
** All Symbols x All Timeframes scan just by pressing scanner button ** *** Contact me  to send you instruction and add you in "123 scanner group" for sharing or seeing experiences with other users. After 17 years of experience in the markets and programming, Winner indicator is ready. I would like to share with you! Introduction The 123 Pattern Scanner indicator with a special enhanced algorithm is a very repetitive common pattern finder with a high success rate . Interestingly, this Winner in
Stratos Pali mt5
Michela Russo
5 (1)
Stratos Pali Indicator is a revolutionary tool designed to enhance your trading strategy by accurately identifying market trends. This sophisticated indicator uses a unique algorithm to generate a complete histogram, which records when the trend is Long or Short. When a trend reversal occurs, an arrow appears, indicating the new direction of the trend. Important Information Revealed Leave a review and contact me via mql5 message to receive My Top 5 set files for Stratos Pali at no cost ! Do
PZ Swing Trading MT5
PZ TRADING SLU
5 (4)
Swing Trading 是第一个旨在检测趋势方向的波动和可能的反转波动的指标。它使用在交易文献中广泛描述的基准摆动交易方法。该指标研究多个价格和时间向量,以追踪总体趋势方向,并检测市场超卖或超买并准备好进行修正的情况。 [ 安装指南 | 更新指南 | 故障排除 | 常见问题 | 所有产品 ] 市场波动的利润不会被窃取 指示器始终显示趋势方向 彩色价格带代表机会基准 彩色虚线表示可能的反转波动 该指标分析其自身的质量和性能 它实现了一个多时间仪表板 可定制的趋势和波动周期 它实现了电子邮件/声音/推送警报 指示器为非重涂或重涂 什么是摇摆交易 摇摆交易是一种尝试在一天到一周内从证券中获得收益的交易方式,尽管某些交易最终可以保持更长的寿命。摇摆交易者使用技术分析来买入弱点和卖出力量,并有耐心等待这些机会的发生,因为在发生一波抛售浪潮之后购买证券而不是陷入抛售更有意义。 机会基准 关于历史数据的大量研究证明,适合于波动交易的市场倾向于在基线价格带上下交易,基线价格带由图表显示,使用平均真实区间计算得出。波动交易者使用基线,该策略是购买常态和卖出躁狂,或做空常态并掩盖沮丧。
FX Volume MT5
Daniel Stein
4.93 (14)
通过 mql5 和 Telegram 上 的 " 晨间简报 "获取每日市场更新,包括详细信息和屏幕截图 ! 外汇交易量(FX Volume)是第一个也是唯一一个从经纪商角度真正洞察市场情绪的交易量指标。 直接在您的图表上看到这些信息是真正改变游戏规则和突破性的交易解决方案。 受益于独特的市场数据洞察,如 比率(Ratios )显示货币多头和空头头寸的比率(百分比 比率变化 显示所选时间段内的多头比率及其百分比变化 总交易量 显示货币的总交易量(多头和空头),以手为单位 多头 交易量显示货币所有多头头寸的交易量 空头 交易量显示所有货币空头头寸的交易量 净多头 显示净多头交易量,即所有多头头寸减去所有空头头寸(以手为单位)。 净多头百分比 显示货币净多头交易量的变化 请阅读我们的基本教程 -> "如何使用外汇交易量进行交易 " 获取更多信息,如常见问题、交易技巧和教程视频,请访问我们的 外汇交易量公共信息频道 请 安装并运行 SI Connect 以建立与我们数据中心的持续连接 背景信息 我们都知道,外汇是一个分散的市场。这就是为什么我们必须打破常规思维,开发一个独
可以说,这是您可以为MetaTrader平台找到的最完整的谐波价格形成自动识别指标。它检测19种不同的模式,像您一样认真对待斐波那契投影,显示潜在的反转区域(PRZ),并找到合适的止损和获利水平。 [ 安装指南 | 更新指南 | 故障排除 | 常见问题 | 所有产品 ] 它检测19种不同的谐波价格形态 它绘制了主要,衍生和互补的斐波那契投影(PRZ) 它评估过去的价格走势并显示每个过去的形态 该指标分析其自身的质量和性能 它显示合适的止损和获利水平 它使用突破来表明合适的交易 它在图表上绘制所有样式比率 它实现了电子邮件/声音/视觉警报 受斯科特·M·卡尼(Scott M. Carney)的书的启发,该指标旨在满足最纯粹和最熟练的交易者的需求。但是,它采取了一种使交易更容易的方式:在向交易发出信号之前,它会等待Donchian朝正确方向突破,从而使交易信号非常可靠。 斐波那契投影与向量无关 它实现了电子邮件/声音/推送警报 它绘制了ABCD投影 重要提示: 为了符合 Scott M. Carney先生 的商标申诉,某些图案名称已重命名为不言自明的替代方式, Scot
XQ Indicator MetaTrader 5
Marzena Maria Szmit
3 (2)
Step into the realm of Forex trading with confidence and precision using XQ, a cutting-edge Forex indicator designed to elevate your trading game to unprecedented heights. Whether you're a seasoned trader or just stepping into the world of currency exchange, XQ Forex Indicator empowers you with the insights and signals needed to make informed trading decisions. The signal conditions are a combination of three indicators, and XQ Forex Indicator only display  medium and long-term trends . The ind
Noize Absorption Index
Ekaterina Saltykova
Noize Absorption Index - is the manual trading system that measures the difference of pressure between bears forces and bulls forces. Green line - is a noize free index that showing curent situation. Zero value of index shows totally choppy/flat market.Values above zero level shows how powerfull bullish wave is and values below zero measures bearish forces.Up arrow appears on bearish market when it's ready to reverse, dn arrow appears on weak bullish market, as a result of reverse expectation.
Golden Spikes Premium
Kwaku Bondzie Ghartey
5 (1)
Golden Spikes Detector Acknowledgement and Dedications:  The name of this indicator was Inspired by an Original; Mr Grant Koopman; a Knowledgeable and experienced Synthetics trader. I dedicate this indicator to Mr Grant.  Overview: The Golden Spikes Premium is a groundbreaking trading indicator meticulously crafted for the Boom and Crash indices on the Deriv market. Tailored to meet the needs of discerning traders, this powerful tool operates exclusively on the one-minute timeframe, providin
作者的更多信息
HFTHackerMT5
Thomas Bradley Butler
5 (2)
信号:我的个人资料上的 HFT 黑客链接 *在测试和使用之前优化 EA。 仅在优化后才购买。 这适合那些知道如何优化并希望凭借自身优势获利的交易者。 您设定您的风险参数。 如果您选择不成功的交易,则可通过止损获得高胜率。 降低长寿风险。 这适用于所有帐户,是一个风险管理工具,请阅读所有评论、描述和博客。 如何获得最佳结果: https://www.mql5.com/en/blogs/post/754836 MT4版本: https://www.mql5.com/en/market/product/73834 在每微秒都至关重要的繁华高频交易 (HFT) 世界里,住着一个神秘人物,人们只知道他是“高频交易黑客”(HFT Hacker)。 高频交易黑客凭借闪电般的反应速度和驾驭市场复杂算法的不可思议的能力,成为交易者中的传奇人物。 传说,高频交易黑客最初是一名卑微的程序员,在互联网深处修补代码。 但随着他对金融世界的深入研究,他发现了高频交易的秘密——眨眼间买入卖出价并卖出买入价的艺术。 凭借新发现的知识,高频交易黑客开始征服金融市场。 在每笔交易中,他都抓住了动量的价
Level 2 Trading
Thomas Bradley Butler
与智能音量跟踪器结合使用: https://www.mql5.com/en/market/product/116650 与足迹图结合: https://www.mql5.com/en/market/product/94153 与区域内的交易相结合: https://www.mql5.com/en/market/product/110194 与日间交易量结合:h https://www.mql5.com/en/market/product/72498 与订单簿结合: https://www.mql5.com/en/market/product/102247 2 级交易是一种指标,可帮助您在 MetaTrader 图表上可视化当前的出价和要价交易量。 这就像快速了解市场上的买卖活动,让您了解压力在哪里形成。 它显示了什么 买价和卖价:该指标显示标签,显示买价(买入)和卖价(卖出)量。 实时更新:随着市场的变化,买价和卖价会自动更新,为您提供市场的实时视图。 为什么它有用 快速市场洞察:二级交易为您提供了一种衡量市场情绪的直接方法。 通过查看买入量和卖出量,您可以确
Matrix Hacker
Thomas Bradley Butler
MT4 Version :   https://www.mql5.com/en/market/product/87060 Matrix Hacker 仅适用于对冲账户并使用随机游走,过去无关紧要。 EA 将在市场中保持稳定并涵盖询价和出价。根据交易者的不同,买卖大小和交易量不同的买盘和卖盘。不建议初学者这样做,因为它仍然需要了解优化而不是过度杠杆化。我建议使用设置来剥削较小的点并保持在范围内。 此 EA 可能会打开 4 笔交易,因此了解这一点可确保输入的大小正确。它使用固定手数,因此需要考虑 4 笔固定手数的交易。在进行实时交易之前先在演示中使用此 EA,并且只有在有信心之前才能使用增量手数。建议每微手 1000 美元。对于日间交易,如果使用 DMA 经纪商和小点差和滑点,则降低 tp。然后,如果在一天结束时整体获利,则退出所有头寸。最后,是否有利润很重要,而不是有多少是正确的。您也可以在不同对之间分配。有很多方法可以对冲以降低风险。一起交易不相关和相关的货币对。 重要的事情是优化输入。优化策略测试器中的上个月选项。保存设置文件并在交易中使用它们。随着市场动态的变化,设置
NeuroScalperMT5
Thomas Bradley Butler
MT4 indicator version https://www.mql5.com/en/market/product/72342 I personally use this indicator to scalp.  Accurate for accessing extremes and supports for buy positions primarily for 1 minute time frames.  Other time frames can be used but the levels are different. Its a better oscillator and compare with others to see the difference.          Day trade using neuro network concepts.  This indicator uses elementary forms of neuro networks to generate signals to buy and sell. Use the indicat
Bitcoin White Hat Hacker
Thomas Bradley Butler
Optimize before use in back test or live for better results for you  and don't forget to account for spreads and slippage in optimization. This Expert is for 1 minute charts trading BTC/USD.  Bitcoin on 1 minute use MACD, CCI and RSI for entry and exit logic.  This EA was back tested and traded out of sample.  Each trade has a stop loss and take profit.   BTC compared to the indexes and Gold have huge differences, look at the example of traditional investing vs. Bitcoin.  Yellow line represents
NeuroScalper
Thomas Bradley Butler
5 (1)
更新!箭头被添加到 100 和 200 级别。 该指标可准确访问极端情况,并主要支持 1 分钟时间范围内的买入头寸。可以使用其他时间范围,但级别不同。它是一个更好的振荡器,并与其他振荡器进行比较以查看差异。 使用神经网络概念的日间交易。该指标使用神经网络的基本形式来生成买卖信号。在 1 分钟图表上使用该指标。指示器不会重新绘制。下载并使用 1 分钟图表或其他使用不同级别的图表在测试仪上运行,分析交易以亲自查看。剥头皮市场的许多机会。可用于更高的时间范围,但应根据您的判断更改水平。较高的时间范围具有较高的范围。 使用此模型要考虑的概念和事项: 使用了多个指标,应用了权重,最大值和最小值为 2 个数据点。该指标主要用于交易上升趋势在振荡器的设置(见图)100 和 200 中添加级别,如果使用不同的时间框架,则添加其他级别。
HFTHacker
Thomas Bradley Butler
信号:我的个人资料上的 HFT 黑客链接 *在测试和使用之前优化 EA。 仅在优化后才购买。 这适合那些知道如何优化并希望凭借自身优势获利的交易者。 您设定您的风险参数。 如果您选择不成功的交易,则可通过止损获得高胜率。 降低长寿风险。 这适用于所有帐户,是一个风险管理工具,请阅读所有评论、描述和博客。 如何获得最佳结果: https://www.mql5.com/en/blogs/post/754836 MT4版本: https://www.mql5.com/en/market/product/73834 在每微秒都至关重要的繁华高频交易 (HFT) 世界里,住着一个神秘人物,人们只知道他是“高频交易黑客”(HFT Hacker)。 高频交易黑客凭借闪电般的反应速度和驾驭市场复杂算法的不可思议的能力,成为交易者中的传奇人物。 传说,高频交易黑客最初是一名卑微的程序员,在互联网深处修补代码。 但随着他对金融世界的深入研究,他发现了高频交易的秘密——眨眼间买入卖出价并卖出买入价的艺术。 凭借新发现的知识,高频交易黑客开始征服金融市场。 在每笔交易中,他都抓住了动量的
Bitcoin M5
Thomas Bradley Butler
OPTIMIZE EA BEFORE TEST AND USE. Bitcoin M5 is for trading BTC/USD on 5 min charts.  SL and TP should Start with 50000.  OPTIMIZE BEFORE USE The trading strategy uses Bollinger Bands and Envelopes indicators to trade from.  Trading to catch some breakout points of where the price breaches the bands and then exiting when the price crosses the envelopes.  Every trade uses a fixed lot amount and has a SL and TP.  The EA does not use martingale or hedging in the logic.
VolumeDayTrader
Thomas Bradley Butler
僅限股票(差價合約)的日間交易。 交易需要工作。 沒有捷徑或指標可以告訴您所有的進入和退出。 利潤來自心態。 指標是與資金管理和成功心理學結合使用的工具。 查找音量配置文件中的不平衡。 貿易價格量不平衡。 許多不平衡發生在收盤、開盤和新聞中。 查看股票中的買家與賣家。 使用 5 分鐘到 1 小時來查看誰可以控制價格並發現價格不平衡。 更大的股票是 15 分鐘及以上。 將鼠標懸停在顏色音量條上以查看過去條的數量。 當前條形圖的音量寫在右上角。 找出交易量的不平衡,看看價格在一段時間內可能走向何方。 跟隨主導趨勢以獲得最佳結果 如果趨勢發展尋找交易趨勢。 使用追踪止損並留意大量反轉不平衡。 交易 Apple、SPY、GOOLE、TESLA。 所有你最喜歡的股票
MarketMakerMT5
Thomas Bradley Butler
自动化供需交易。做一个市场。 这个 EA 的制作和灵感来自于每个人都在销售和模仿的流行供需指标。 EA 继续交易和对冲,做市。也可以在非对冲账户上交易。需要评估风险并使用时间框架、手数、对冲能力。我已经在一个月左右的时间里一次断断续续地交易了多对。 系统概念: EA 交易供需水平。水平发生变化,因此 EA 将继续交易新水平。在手数较低的多对之间进行分配是该系统的一项功能。在保持稳定收益的同时,应避免大幅回撤。 SL 可以使用,但我解释的对冲方面允许这是一种选择。我在多对小手上得到的回撤是 4%,这是没有止损的。较大的地块显示为 6%。因此,较小的尺寸是保守的,而较大的则更具侵略性。这些是保持交易手数低于余额的原因。行业需要发展空间。 特征: 贸易计数 固定手数 音量上限 止损 获利
Black Gold M1
Thomas Bradley Butler
OPTIMIZE BEFORE BACKTEST AND USE Trade crude oil with this EA.  No EA turns hundreds into millions in a year or 2, This is a lie if presented this way.  Black Gold trades Brent Crude on 1 min charts.  It uses RSI, moving averages and directional indicators.  Try it out, load it onto the tester if you have the history and ability to trade Brent crude.    Adjust and optimize to get the most out of the expert advisor
ForexReversal
Thomas Bradley Butler
4 (1)
耐心是无压力剥头皮的关键。 当您看到它通过 200 移动平均线时交易箭头,并通过扩大或从没有移动平均过滤器的最后一个摆动点形成趋势。 适用于 1 分钟时间框架,捕捉日内动量走势。 使用追踪止损轻松获得 20 个点或为更大的趋势停留更长时间。 查看该指标中真正大笔交易的照片中的示例。 1 分钟的时间框架效果最好。 缩小以查看趋势。 箭头不会重新绘制或重新计算。 附加到 1 分钟的时间框架并研究交易,看看它是否可用于您的策略。 一世 规则: 买蓝色 红色出售 远离横盘整理 交易量大,交易动量 使用止损 耐心是无压力剥头皮的关键。 当您看到它通过 200 移动平均线时交易箭头,并通过扩大或从没有移动平均过滤器的最后一个摆动点形成趋势。 适用于 1 分钟时间框架,捕捉日内动量走势。 使用追踪止损轻松获得 20 个点或为更大的趋势停留更长时间。 查看该指标中真正大笔交易的照片中的示例。 1 分钟的时间框架效果最好。 缩小以查看趋势。 箭头不会重新绘制或重新计算。 附加到 1 分钟的时间框架并研究交易,看看它是否可用于您的策略。 一世 规则: 买蓝色 红色出售 远离横
GoldBuyBackScalper
Thomas Bradley Butler
4 (1)
该指标仅适用于 XAU/USD,1 分钟图表。 每对都有独特的特征和价格走势。 使用该指标交易 V 形反转。 头皮使用追踪止损购买并避免新闻,因为它们更加极端并且可能导致突然抛售。 在回测中附加到 1 分钟的时间范围并查看反转购买。 指标从不重新绘制或重新计算。 仅在营业时间内交易 该指标仅适用于 XAU/USD,1 分钟图表。 每对都有独特的特征和价格走势。 使用该指标交易 V 形反转。 头皮使用追踪止损购买并避免新闻,因为它们更加极端并且可能导致突然抛售。 在回测中附加到 1 分钟的时间范围并查看反转购买。 指标从不重新绘制或重新计算。 仅在营业时间内交易 该指标仅适用于 XAU/USD,1 分钟图表。 每对都有独特的特征和价格走势。 使用该指标交易 V 形反转。 头皮使用追踪止损购买并避免新闻,因为它们更加极端并且可能导致突然抛售。 在回测中附加到 1 分钟的时间范围并查看反转购买。 指标从不重新绘制或重新计算。 仅在营业时间内交易
TrueSupplyandDemand
Thomas Bradley Butler
This is based on short term strength or weakness and not on moving averages.  Moving averages are used for filter only. Trade supply and demand with arrows. Supply and demand breakouts and strength of the buyers or sellers .  Don't trade buy arrow to sell arrow.  Trade the strength with trendlines or moving averages and use stops.  The arrow can have some strong moves.  Trade on all time frames.  Try it out in the back tester. The pips can be made with this indicator, follow the arrows and mak
ScalpingMaster
Thomas Bradley Butler
Master scalping with this indicator.  Trade on any time frame for scalps on buy or sells.  Follow trends using a 200 moving average and stops and targets.  Use with your own system.  This indicator can give pips if following it correctly.  Stick to rules and pick up pips daily.  Use as entries in a trend, scalp for a few pips or exit on opposite signal.  Best to follow higher time frame trends. Indicator doesn't repaint or recalculate. Rules: Don't trade overnight, only trade during active sessi
DayTradeKing
Thomas Bradley Butler
This indicator is good for small time frames like 1 and 5 minutes and made for day trading. The indicator never repaints or recalculates. The indicator works is for trading swing points in day trading, following bulls or bears.  Its a simple to use, non cluttered indicator with a high success rate.  This indicator works well to capture ranges.  All indicators come with limitations and no indicator or system is always accurate. Use money management for long term trading success.   Place in backte
DTKGold
Thomas Bradley Butler
This is the DayTradeKing for gold on a 1 minute time frame.  It is a different calculation for the range. Use a 200 period moving average as a filter.  Always use stops and avoid news, wait for more conformation.  This looks to capture intraday ranges. Put it in the back tester on 1 minute to see the price action and how it works. Trade with trend Use filter Use stops Alerts are added for pop ups and sound. 
SuperArrowScalper
Thomas Bradley Butler
Trade trends with the Super Scalper Use on all time frames and assets it is  designed for scalping trends. Works good on small time frames for day trading.  The arrows are easy to follow.  This is a simple no repaint/no recalculate arrow indicator to follow trends with.  Use in conjunction with your own system or use moving averages.  Always use stops just below or above the last swing point or your own money management system The indicator comes with push notifications, sound alerts and email
Levels Trading
Thomas Bradley Butler
This indicator is a simple stripped down version of any advanced support and resistance indicator.  All the support and resistance indicators work from a number of bars that have developed over time. Get rid of clutter and confusing levels.  Find levels according to a number of bars. Look at days, session, numbers of hours, periods of consolidation.  Watch levels develop and use as breakout points, or areas of buyers and sellers.  Features and things to consider This indicator is for a frame of
ForexReversalEA
Thomas Bradley Butler
https://www.mql5.com/en/market/product/57345 该 EA 基于外汇反转指标。 如果您更喜欢手动交易系统,请下载指标并试用。 EA 将跟随趋势并相应地开仓。 结果显示具有较低回撤的稳定收益,但在回测器、优化器和时间框架中进行试验,看看什么有效。 显示的所有结果都是假设的。 注意:这不是鞅或网格。 该指标确实具有对冲能力 此 EA 具有以下功能,并根据您的风险进行更改。 EA根据可用保证金添加,根据参数买卖。 通过输入控制风险。 inp 5 是卖 inp 7 是购买 固定止损手数 固定获利   可用保证金百分比 该 EA 基于外汇反转指标。 如果您更喜欢手动交易系统,请下载指标并试用。 EA 将跟随趋势并相应地开仓。 结果显示具有较低回撤的稳定收益,但在回测器、优化器和时间框架中进行试验,看看什么有效。 显示的所有结果都是假设的。 注意:这不是鞅或网格。 该指标确实具有对冲能力 此 EA 具有以下功能,并根据您的风险进行更改。 EA根据可用保证金添加,根据参数买卖。 通过输入控制风险。
MarketMaker
Thomas Bradley Butler
自动化供需交易。做一个市场。 这个 EA 的制作和灵感来自于每个人都在销售和模仿的流行供需指标。 EA 继续交易和对冲,做市。也可以在非对冲账户上交易。需要评估风险并使用时间框架、手数、对冲能力。我已经在一个月左右的时间里一次断断续续地交易了多对。 系统概念: EA 交易供需水平。水平发生变化,因此 EA 将继续交易新水平。在手数较低的多对之间进行分配是系统中的一项功能。在保持稳定收益的同时,应避免大幅回撤。 SL 可以使用,但我解释的对冲方面允许这是一种选择。我在多对小手上得到的回撤是 4%,这是没有止损的。较大的地块显示为 6%。因此,较小的尺寸是保守的,而较大的则更具侵略性。这些是保持交易手数低于余额的原因。行业需要发展空间。 特征: 贸易计数 固定手数 音量上限 止损 获利
Top Trader
Thomas Bradley Butler
Top Trader Indicator This is an arrow reversal indicator. This is with deviations and arrows.  Trade a blue arrow for buy and trade a red arrow for sell.  Change the time period and the deviations of the bands.  This is similar to others but these arrows don't repaint.  Load in back tester and study which periods and deviations work the best.  It works on all time frames.  15 min to 1 hr would give good results for take profits.  Try according to your own risk management.
Quant Bot
Thomas Bradley Butler
Quant Bot 用于欧元/美元一小时时间框架内的趋势交易。 没有设置文件,但如果使用其他对,则可能需要优化。 关于机器人: 它使用基因生成并使用 ATR 进行交易。 前行期用于防止曲线拟合 EA 在每笔交易中都使用止损。 资金管理是按余额百分比放大 回溯期为 2003-2020 年,前进期为 2020-2022 年。(见图)。 Quant Bot 用于欧元/美元一小时时间框架内的趋势交易。 没有设置文件,但如果使用其他对,则可能需要优化。 关于机器人: 它使用基因生成并使用 ATR 进行交易。 前行期用于防止曲线拟合 EA 在每笔交易中都使用止损。 资金管理是按余额百分比放大 回溯期为 2003-2020 年,前进期为 2020-2022 年。(见图)。
Crypto Net
Thomas Bradley Butler
Crypto Net 用于在  BTCUSD。 它使用基因进化来进化策略。 该 EA 交易趋势遵循 ATR 和 Ichimoku 指标。 这是构建并通过了一系列强大的测试,包括 Monte Carlo 和 Walk Forward。 输入: 最低风险的账户百分比。 最大手数 停止交易的时间 没有其他任何改变。 Crypto Net 用于在 BTCUSD。 它使用基因进化来进化策略。 该 EA 交易趋势遵循 ATR 和 Ichimoku 指标。 这是构建并通过了一系列强大的测试,包括 Monte Carlo 和 Walk Forward。 输入: 最低风险的账户百分比。 最大手数 停止交易的时间 没有其他任何改变。 输入: 最低风险的账户百分比。 最大手数 停止交易的时间 没有其他任何改变。 输入: 最低风险的账户百分比。 最大手数 停止交易的时间 没有其他任何改变。
Golden Standard
Thomas Bradley Butler
对于 XAU/美元 这是一个稳定的交易系统,使用随机生成和趋势跟踪交易。 Expert 使用质量数据进行了回测,完成了一个优化期以及 Monte Carlo 模拟,以避免在 XAU/USD 1 小时时间范围内过度拟合。 使用止损和获利。 EA 有多种配置,除了计算要交易的手数之外别无他法。 特征: 使用余额百分比复合利润 对于 XAU/美元 这是一个稳定的交易系统,使用随机生成和趋势跟踪交易。 Expert 使用质量数据进行了回测,完成了一个优化期以及 Monte Carlo 模拟,以避免在 XAU/USD 1 小时时间范围内过度拟合。 使用止损和获利。 EA 有多种配置,除了计算要交易的手数之外别无他法。 特征: 使用余额百分比复合利润 对于 XAU/美元 这是一个稳定的交易系统,使用随机生成和趋势跟踪交易。 Expert 使用质量数据进行了回测,完成了一个优化期以及 Monte Carlo 模拟,以避免在 XAU/USD 1 小时时间范围内过度拟合。 使用止损和获利。 EA 有多种配置,除了计算要交易的手数之外别无他法。
PropTrader
Thomas Bradley Butler
*使用前优化 EA* 欧元/美元优化外汇交易策略 通过专家顾问 (EA) 在一两年内获得巨额财富是一个不切实际的说法。 回测和真实交易重点关注欧元/美元货币对。 关于该策略: 这代表了我们战略的初始迭代,并有进一步发展的潜力。 经过 100% 质量数据的严格测试,没有 MT4 错误。 该策略按照趋势跟踪的逻辑原则运作。 当趋势看涨时,EA 启动并部署追踪止损,反之亦然。 本质上,这是一种简单的趋势跟踪方法。 主要优点和注意事项: 轻松设置:坚持使用默认设置,仅根据您的喜好修改批量大小。 风险管理:该策略不采用鞅或对冲。 风险缓解:每笔交易都配备了追踪止损和止盈水平,由平均真实波动幅度 (ATR) 确定,有助于更好的风险管理。 趋势识别:此方法旨在帮助交易者识别并利用更持久的趋势。 外汇交易风险免责声明: 外汇交易涉及保证金交易外币,风险较高,可能并不适合所有投资者。 过去的表现并不是未来业绩的保证。
Down Under
Thomas Bradley Butler
Down Under 在 1 小时的时间范围内交易澳元/美元对。 该 EA 交易 ATR 和 OHLC。 它在这个时间范围内为这对格式化。 复合使用分钟。 手数和最大。 批量。 余额的百分比是在获胜交易中复合的。 随着余额波动,手数也会波动。 设置: 毫米风险% 毫米批次 最大手数 没有什么可以改变的。 这没有马丁格尔或对冲能力。 唯一需要更改的其他功能是,如果您交易的是澳元/美元的差价合约。 在经纪人平台上按小数点更改。 风险免责声明 期货、期权和货币交易都有很大的潜在回报,但也有很大的潜在风险。 为了投资这些市场,您必须意识到风险并愿意接受它们。 Down Under 在 1 小时的时间范围内交易澳元/美元对。 该 EA 交易 ATR 和 OHLC。 它在这个时间范围内为这对格式化。 复合使用分钟。 手数和最大。 批量。 余额的百分比是在获胜交易中复合的。 随着余额波动,手数也会波动。 设置: 毫米风险% 毫米批次 最大手数 没有什么可以改变的。 这没有马丁格尔或对冲能力。 唯一需要更改的其他功能是,如果您交易的是澳元/
Cable Trader
Thomas Bradley Butler
GBP/USD 1hr. 该 EA 交易动量和会话。 这有一个固定的手数组成部分,并将随着它的发展继续修改 TP。 设置: 批量 没有什么可以改变的。 这没有马丁格尔或对冲能力。 唯一要更改的其他功能是,如果您交易的是英镑/美元的差价合约。 在经纪人平台上按小数点更改。 风险免责声明 期货、期权和货币交易都有很大的潜在回报,但也有很大的潜在风险。 为了投资这些市场,您必须意识到风险并愿意接受它们。 Cable Trade 在 1 小时的时间范围内交易 GBP/USD 对。 现场交易前的演示。 该 EA 交易动量和会话。 这有一个固定的手数组成部分,并将随着它的发展继续修改 TP。 设置: 批量 没有什么可以改变的。 这没有马丁格尔或对冲能力。 唯一要更改的其他功能是,如果您交易的是英镑/美元的差价合约。 在经纪人平台上按小数点更改。 风险免责声明 期货、期权和货币交易都有很大的潜在回报,但也有很大的潜在风险。 为了投资这些市场,您必须意识到风险并愿意接受它们。
Euclidean
Thomas Bradley Butler
欧几里得是我 8 年前提出的一种独特的交易算法。 该 EA 是该系统的一部分。 它作为一个封闭系统工作。 当角度正确以捕捉趋势时,EA 将启动买入。 止损是角度的10%。 就是这么简单。 输入: 手数余额百分比 1 微手 1,000 美元 获利水平 = 默认为 50 点 如何和需要考虑的事项: 止损是内置的,并根据价格以 10% 的角度进行交易。 止盈设置为 50 点,但可以是您想要的金额。 在 1 到 5 分钟的小时间范围内进行交易。 在回测器中对此进行测试的错误为零。 不同的平台和经纪人有不同的数据,因此请检查下载数据以进行测试。 外汇交易风险免责声明 欧几里得是我 8 年前提出的一种独特的交易算法。 该 EA 是该系统的一部分。 它作为一个封闭系统工作。 当角度正确以捕捉趋势时,EA 将启动买入。 止损是角度的10%。 就是这么简单。 输入: 手数余额百分比 交易量上限 = 最大手数 获利水平 = 默认为 50 点 如何和需要考虑的事项: 止损是内置的,并根据价格以 10% 的角度进行交易。 止盈设置为 50 点,但可以是您想要的金额。
Pip Scalper
Thomas Bradley Butler
每个人的指标 Pip Scalper 用于剥头皮趋势。 使用此指标更长时间地保持趋势。 它适用于所有时间框架和资产。 使用此工具获取每日点数。 使用 200 移动平均线过滤交易。 建议使用较小的时间范围。 用于日间交易。 关于和如何使用: Pips Scalper 基于长期趋势交易。 买蓝色 卖出红色 在活跃期间使用 200 移动平均线作为过滤器和交易。 Pip Scalper 用于剥头皮趋势。 使用此指标更长时间地保持趋势。 它适用于所有时间框架和资产。 使用此工具获取每日点数。 使用 200 移动平均线过滤交易。 建议使用较小的时间范围。 用于日间交易。 关于和如何使用: Pips Scalper 基于长期趋势交易。 买蓝色 卖出红色 在活跃期间使用 200 移动平均线作为过滤器和交易。
筛选:
无评论
回复评论
版本 2.20 2024.08.26
adjustments to panel
版本 2.10 2024.08.26
Referenced contributing developer