• 概述
  • 评论 (1)
  • 评论
  • 新特性

CM Ema Trend Bars

5

Indicator Name: CM EMA Trend Bars

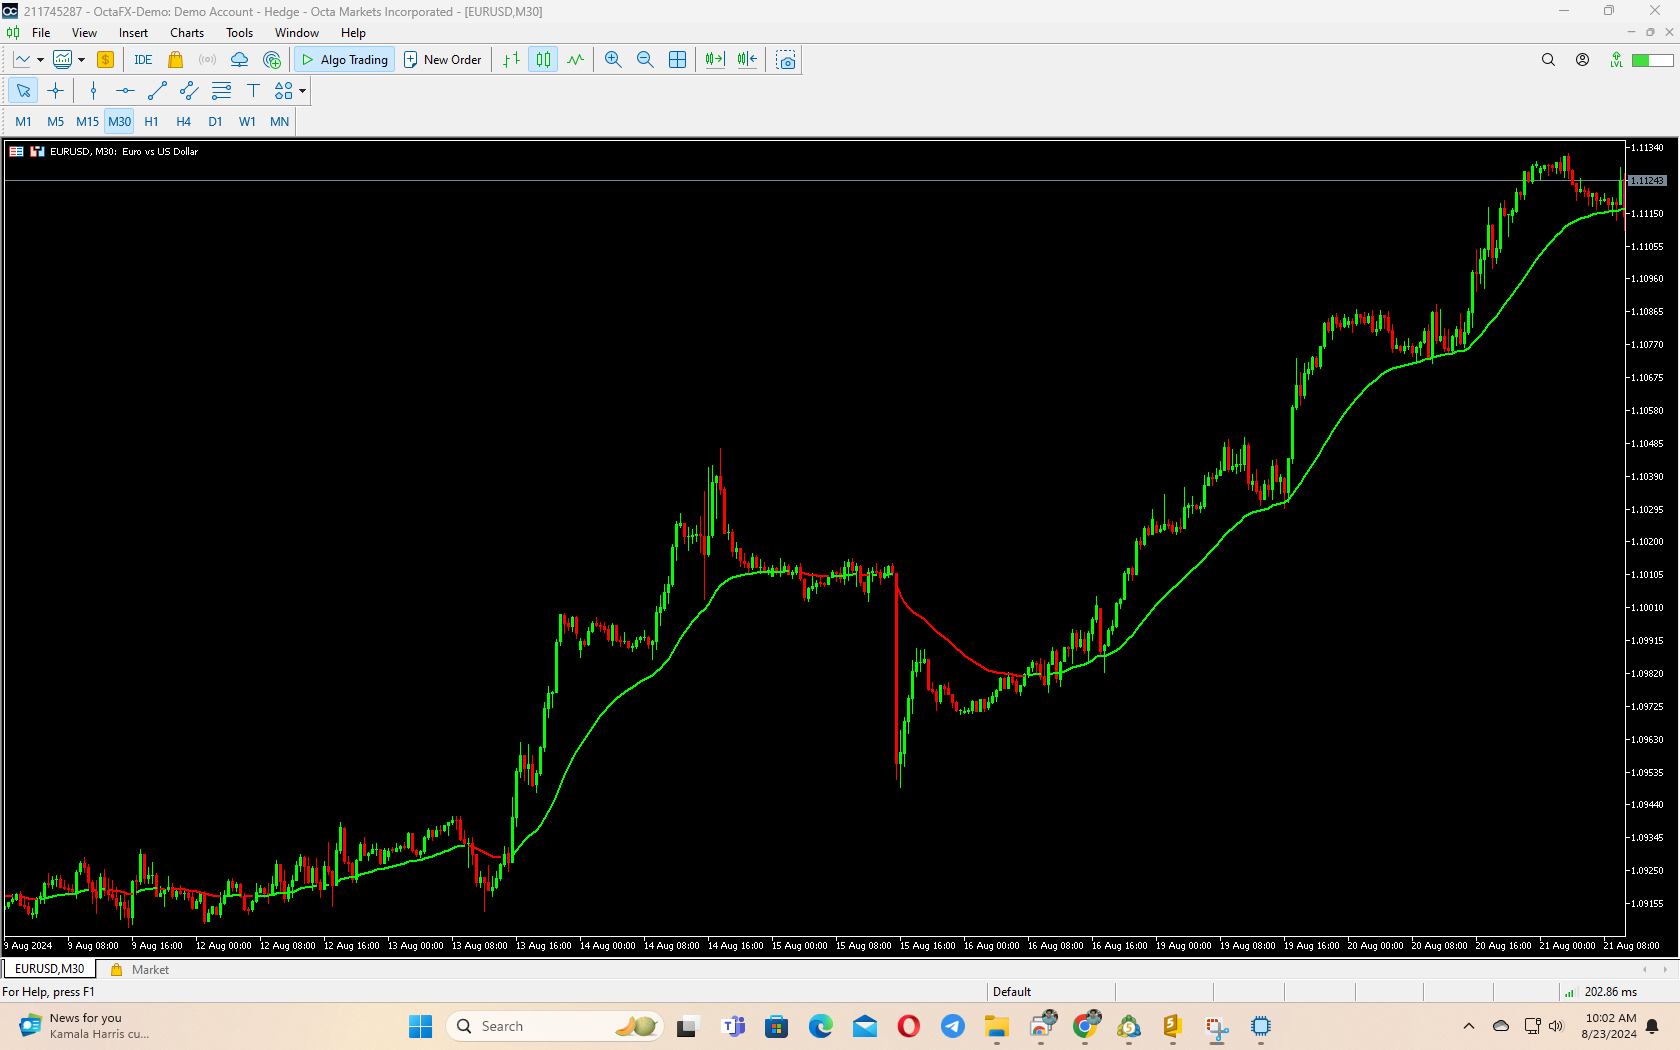
Overview: The CM EMA Trend Bars indicator is a straightforward yet effective tool that changes the color of price bars based on their relationship to the Exponential Moving Average (EMA). This visual cue helps traders quickly identify trend direction and potential trading opportunities.

Key Features:

  • Dynamic Bar Coloring: The indicator changes the color of the bars depending on whether they are above or below the EMA, providing a clear visual representation of the current trend.
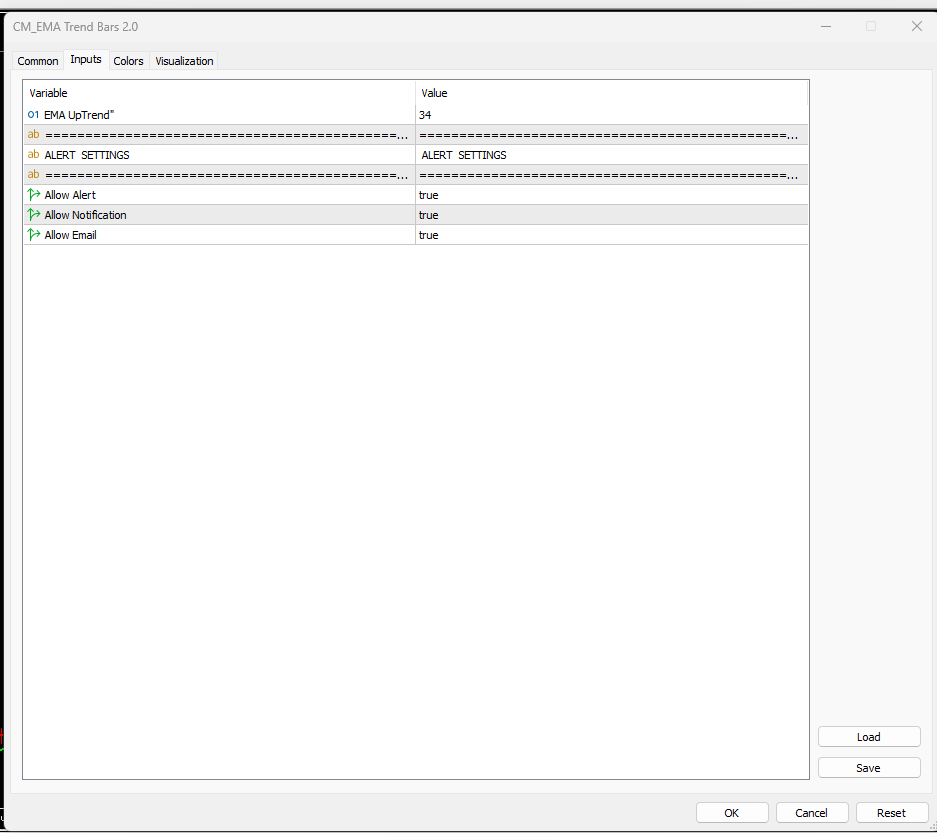
  • Customizable EMA Period: Users can adjust the EMA period via the Inputs tab, allowing for flexibility in adapting the indicator to different trading styles and market conditions.
  • Optional EMA Plotting: The indicator allows users to toggle the visibility of the EMA on the chart, giving the option to focus solely on the color-coded bars or include the EMA line for additional context.
  • HLC/3 Calculation Method: The indicator uses the average of the high, low, and close (HLC/3) to determine whether a bar is above or below the EMA. This approach helps to filter out market noise and reduces false signals, particularly during periods of market chop.

Designed For:

  • Trend Followers: Ideal for traders who want a quick and easy way to identify the prevailing trend.
  • All Timeframes: The indicator is versatile and can be applied across various timeframes, from short-term intraday charts to longer-term analysis.


评论 1
Findolin
1045
Findolin 2024.09.04 13:05 
 

Very good indicator. Thank you yery much!

推荐产品
Stackable VWAP
Flavio Javier Jarabeck
3.5 (4)
Volume Weighted Average Price (VWAP) is a trading benchmark commonly used by Big Players that gives the average price a Symbol has traded throughout the day. It is based on both Volume and price. Additionally we put in this indicator the MVWAP (Moving Volume Weighted Average Price). For those who do not know the usage and the importance od this indicator I recommend a great article about this subject at Investopedia ( https://www.investopedia.com/articles/trading/11/trading-with-vwap-mvwap.asp
FREE
MIDAS Super VWAP
Flavio Javier Jarabeck
4.44 (9)
Imagine VWAP, MVWAP and MIDAS in one place... Well, you found it! Now you can track the movement of Big Players in various ways, as they in general pursue the benchmarks related to this measuring, gauging if they had good execution or poor execution on their orders. Traders and analysts use the VWAP to eliminate the noise that occurs throughout the day, so they can measure what prices buyers and sellers are really trading. VWAP gives traders insight into how a stock trades for that day and deter
FREE
Wave Box Market Frenquency
Jean Jacques Huve Ribeiro
4.75 (4)
Totally linked to the result of a movement and the duration he had. Its height records how many ticks the asset walked during a given movement, its width shows us the duration that movement had. Its configuration must be in line with the Weis Wave Indicator configuration to observe the movement force and can indicate a possible accumulation or distribution of the movement;
FREE
VWAP and MVWAP
Flavio Javier Jarabeck
4 (5)
Volume Weighted Average Price (VWAP) is a trading benchmark commonly used by Big Players that gives the average price a Symbol has traded throughout the day. It is based on both Volume and price. Additionally we put in this indicator the MVWAP (Moving Volume Weighted Average Price). For those who do not know the usage and the importance od this indicator I recommend a great article about this subject at Investopedia ( https://www.investopedia.com/articles/trading/11/trading-with-vwap-mvwap.asp )
FREE
Midas VWAP
Paulo Henrique Faquineli Garcia
4 (1)
Volume Weighted Average Price (VWAP) is a trading benchmark commonly used by Big Players that gives the average price a Symbol has traded throughout the day. It is based on both Volume and price. This indicator contains Daily VWAP and MIDAS' VWAP, which means you are able to anchor the beggining of MIDAS' calculations and, therefore you will be able to use this methodology to study price versus volume moves after anchor point. You will be able to anchor up to 3 HIGH MIDAS VWAP's and 3 LOW. Wis
FREE
Tabajara V5
Flavio Javier Jarabeck
4.84 (32)
Metatrader 5 version of the famous Andre Machado's Tabajara indicator. If you don't know Andre Machado's Technical Analysis work you don't need this indicator... For those who need it and for those several friend traders who asked this porting from other platforms, here it is... FEATURES 8-period Moving Average 20-period Moving Average 50-period Moving Average 200-period Moving Average Colored candles according to the inflexion of the 20-period MA SETTINGS You can change the Period of all M
FREE
Cybertrade Keltner Channels
Emanuel Andriato
4.75 (4)
Cybertrade Keltner Channels - MT5 Created by Chester Keltner, this is a volatility indicator used by technical analysis. It is possible to follow the trend of financial asset prices and generate support and resistance patterns. In addition, envelopes are a way of tracking volatility in order to identify opportunities to buy and sell these assets. It works on periods longer than the period visible on the chart. All values ​​are available in the form of buffers to simplify possible automations.
FREE
Time Spaced Moving Averages
Flavio Javier Jarabeck
5 (3)
The concept is simple: Plotting Price behavior within several periods of time. Some Symbols behave very well during the trading day - with this I mean Intraday trading - and this behavior ends up plotting effectively well with the proposed Exponential Moving Averages in this indicator... Obviously that this behavior could not be seen in all Symbols, but you can give it a try... Just drop this indicator in a chart and you will see for yourself... This indicator is intended for "Feeling the Trend
FREE
Candle Zones
Flavio Javier Jarabeck
You probably heard about Candlesticks behaviors, which in most of the times could denote and trace Volume behaviors even if you are not watching Volume itself... Well, this indicator will do this. Naked traders love to rely solely on candlesticks patterns and with Candle Zones you can trap special patterns and DRAW THEM on your chart. As simple as that. There are several filters you can tweak in order to achieve the analysis you want. Just give it a try. After several months of testing, we think
FREE
This indicator is stand alone version from  MP Pivot Levels  (All in one) containing Demark's Pivots. Calculations:     PP = X / 4     R1 = X / 2 - LOWprev     S1 = X / 2 - HIGHprev Uses: When the pair currency price may change the direction of movement. Possible constraints of support and resistance that creates plateaus for the currency pair prices. Tendency identification by comparing the present prices according to current day's pivot point and also the prior day's pivot points. ___________
FREE
Value Chart Candlesticks
Flavio Javier Jarabeck
4.67 (9)
The idea of a Value Chart indicator was presented in the very good book I read back in 2020 , " Dynamic Trading Indicators: Winning with Value Charts and Price Action Profile ", from the authors Mark Helweg and David Stendahl. The idea is simple and the result is pure genius: Present candlestick Price analysis in a detrended way! HOW TO READ THIS INDICATOR Look for Overbought and Oversold levels. Of course, you will need to test the settings a lot to find the "correct" one for your approach.
FREE
Pivot Point Fibo RSJ
JETINVEST
4.29 (17)
枢轴点斐波那契 RSJ 是一个指标,它使用斐波那契汇率追踪当天的支撑线和阻力线。 这个壮观的指标使用斐波那契汇率通过枢轴点创建多达 7 个支撑位和阻力位。 价格如何尊重该支撑和阻力的每个水平真是太棒了,在那里可以感知操作的可能进入/退出点。 特征 多达 7 个支撑位和 7 个阻力位 单独设置级别的颜色 输入 枢轴类型 Pivot Fibo RSJ1 = Fibo ratio 1 计算 Pivot Fibo RSJ2 = Fibo ratio 2 计算 Pivot Fibo RSJ3 = Fibo ratio 3 计算 Pivot Fibo Classic = 经典枢轴计算 最低枢轴级别 旋转 3 个级别 旋转 4 个级别 旋转 5 个级别 枢轴 6 个级别 旋转 7 个级别 如果您仍有疑问,请通过直接消息与我联系: https://www.mql5.com/zh/users/robsjunqueira/
FREE
Bollinger colorido
Sergio Domingues
5 (1)
Funciona como bandas de bollinger normais. Criado por Joe Ross, é um setup de maior risco por ser contra-tendência. Pode ser usado para Day Trade, Swing Trade e Position. Para identificar, é necessário inserir no gráfico as Bandas de Bollinger, com uma Média Móvel Simples de 20 períodos e largura (desvio) 2. Verifica-se um fechamento de determinado candle abaixo da banda inferior de Bollinger. Se o próximo candle fechar dentro das Bandas, marca-se a máxima dele. O rompimento dessa máxima será o
FREE
Double Top and Double Bottom
Rajesh Kumar Nait
5 (3)
This indicator finds Double Top and Double bottom Example : What is Double Top When price establishes a new high and then falls, then reverse to the same candle area of High then its considered a valid double top and vice versa for double bottom. 1. It plots and high and low on visible chart if ChartChange is set to true else it searches on new bar opening 2. If there is double top and double bottom found in visible chart window then it plots a line 3. It has options to customize text color, te
FREE
Force Numbers
Flavio Javier Jarabeck
Several assets in several markets have the behavior of using specific numbers as Force Numbers, where support, resistance and price thrust is created. Let this indicator draw those levels of support and resistance for you. You can also stack it to show different level of Prices! This technique is being used by Tape Readers and Order Flow traders all over the world for a long time. Give it a try. Challenge yourself to study new ways of Price Action! SETTINGS What Price reference to use in th
FREE
Santa Donchian
Marco Aurelio Cestari
4.5 (2)
Santa Donchian Indicator  is an efficient way to detect support, resistence and break outs in any market. The Donchian channel measures the high and the low of a previously defined range.  Typically, a trader would look for a well-defined range and then wait for the price to break out to either one side for a trade entry trigger. Advantages Never repaints, never backpaints, never recalculates. Works in all symbols and all timeframes. Perfect trend filter for any strategy or expert advisor. Fu
FREE
Economic Markers
Flavio Javier Jarabeck
4.77 (13)
Easily get all relevant economic events of the current day right into your chart, as markers. Filter what kind of markers do you want: by country (selected individually) and by Importance (High relevance, Medium, Low or any combination of these). Configure the visual cues to your liking. If there is more than one event set to the very same time, their Names will be stacked and you will see the messages merged with the plus (+) sign on the marker. Obviously that long or too much events on the sam
FREE
FRB Agressao Saldo
Fernando Baratieri
FRB Aggression Balance - Indicator shows the Agression Balance of the TIMEFRAMES chosen by the user through a histogram in a new window. - This indicator can only be used if the broker provides data on Volumes. Forex market brokers do not report this data. - B3 (Bovespa - Brazil) informs the data and with that it is possible to use it in Brazilian brokerages. Settings Color - Define the color that will be shown in the histogram. Use Historical Data - Defines whether the indicator will calcu
FREE
Spike Catch Pro
Amani Fungo
4 (6)
Spike Catch Pro 22:03 release updates Advanced engine for searching trade entries in all Boom and Crash pairs (300,500 and 1000) Programmed strategies improvements Mx_Spikes (to combine Mxd,Mxc and Mxe), Tx_Spikes,   RegularSpikes,   Litho_System,   Dx_System,   Md_System,   MaCross,   Omx_Entry(OP),  Atx1_Spikes(OP),   Oxc_Retracement (AT),M_PullBack(AT) we have added an arrow on strategy identification, this will help also in the visual manual backtesting of the included strategies and see h
FREE
Forex Indicator Arrows
NGUYEN NGHIEM DUY
1 (1)
Forex Indicator Arrows is an arrow Indicator used as an assistant tool for your trading strategy. The indicator analyzes the standard deviation of bar close for a given period and generates a buy or sell signals if the deviation increases. It good to combo with Martingale EA to follow Trend and Sellect Buy Only/Sell Only for EA work Semi-Automatic. You can use this  Indicator with any EAs in my Products.
FREE
Rejection Zones
Paulo Henrique Faquineli Garcia
Este poderoso indicador analisa o gráfico e mostra zonas de Rejeição de Preços! Isto é, locais onde o preço foi, mas não foi aceito pelo mercado! A visualização desta zona de Rejeição, facilita o entendimento do trader na tomada de decisões de onde operar e como operar! O indicador é composto por 4 linhas, sendo classificadas em 2 grupos: Linhas Vermelha e Amarela: Denotam os extremos onde o preço conseguiu chegar, mas não foi aceito! Linhas Laranja e Azul: A partir delas, denotam o Início da
FREE
Super Trend eu
Emin Ulucanli
4.75 (4)
SUPERTREND; It is a trend following indicator based on the SuperTrend ATR created by Olivier Seban. It can be used to detect changes in trend direction and locate stops. When the price falls below the indicator curve, it turns red and indicates a downtrend. Conversely, when the price moves above the curve, the indicator turns green, indicating an uptrend. Like other indicators, it works well on SuperTrend when used in conjunction with other indicators such as MACD, parabolik SAR, Bollinger Band
FREE
Coral Indi
Dinh Duong Luong
Coral trend is   a trend-following indicator that is widely popular among FOREX traders . It is usually used as a confluence with other indicators. It uses combinations of moving averages with complex smoothing formulas! It has two configurable parameters: Coefficient   - smoothing ratio (*) Applied price Calculation: Coral = (-0.064) * B6 + 0.672 * B5 - 2.352 * B4 + 2.744 * B3
FREE
LT Donchian Channel
Thiago Duarte
4.75 (4)
Donchian Channel is an indicator created by Richard Donchian. It is formed by taking the highest high and the lowest low of the last specified period in candles. The area between high and low is the channel for the chosen period. Its configuration is simple. It is possible to have the average between the upper and lower lines, plus you have alerts when price hits one side. If you have any questions or find any bugs, please contact me. Enjoy!
FREE
Central Pivot Tool MT5
Conor Stephenson
5 (7)
中央枢轴范围水平围绕中央枢轴点形成。 这些与中央枢轴相关的水平可用于确定众多市场行为和可能的结果。 与中央枢轴的距离以及新水平相对于前一天水平形成的价格可用于确定接下来几天的趋势方向和强度。 中央枢轴范围可以充当支撑和阻力,提供止损位置的指导,并发出价格持续波动/突破的信号。 群聊: https://www.mql5.com/en/users/conorstephenson 主要特点 中央枢轴范围重点指标,带有额外的枢轴点、斐波那契和 OHLC 水平。 绘制枢轴点 - R1、R2、R3、S1、S2、S3。 绘制斐波那契水平 - 0、0.23、0.38、0.50、0.61、0.78、1 或自定义斐波那契水平。 警报功能。- 能够使用 MT4 移动应用程序通知何时达到水平。 可自定义的线条类型、颜色和大小。 可能市场情绪的强烈迹象。 多功能指标。 非重绘线。 设置从多少根蜡烛绘制水平。 使用每日、每周或每月时间范围创建的水平。 建议 当中央枢轴范围连续高于之前的枢轴范围时,整体市场情绪被认为是看涨的。 当中央枢轴范围连续低于之前的枢轴范围时,整体市场情绪被认为是看跌
FREE
Follow The Line MT5
Oliver Gideon Amofa Appiah
4.5 (28)
This indicator obeys the popular maxim that: "THE TREND IS YOUR FRIEND" It paints a GREEN line for BUY and also paints a RED line for SELL. (you can change the colors). It gives alarms and alerts of all kinds. IT DOES NOT REPAINT and can be used for all currency pairs and timeframes. Yes, as easy and simple as that. Even a newbie can use it to make great and reliable trades. NB: For best results, get my other premium indicators for more powerful and reliable signals. Get them here: https://www.m
FREE
Bounce Zone MT5
Nguyen Thanh Cong
4.2 (5)
Introduction The Bounce Zone indicator is a cutting-edge non-repainting technical tool built to identify key areas on the price chart where market sentiment is likely to cause a significant price reversal. Using advanced algorithms and historical price data analysis, this indicator pinpoints potential bounce zones. Combined with other entry signal, this indicator can help forex traders place the best trades possible Signal A possible buy signal is generated when price is in the green zo
FREE
Higher Highs and Lower Lows
Flavio Javier Jarabeck
4.83 (6)
"Spotting emerging trends, defining correction periods, and anticipating reversals can benefit your trading in many ways..." So be it: Higher Highs & Lower Lows indicator. This is an indicator created by Vitali Apirine and presented to the public through the article "Time To Buy. Time to Sell - It's a Stochastic, Higher Highs & Lower Lows" in the Stocks & Commodities magazine . This is a Momentum indicator that helps determine the direction of a trend. Higher Highs and Lower Lows are two indicat
FREE
Rule Plotter Scanner
Francisco Gomes Da Silva
您是否曾经想过拥有一款能够扫描所有策略并同时显示该资产所有时间框架的买卖点的扫描仪? 这正是这款扫描仪所能做到的。该扫描仪旨在展示您在 Rule Plotter: 无需编程即可创建策略的策略生成器 中创建的买卖信号,并在此扫描仪中在不同的资产和时间框架上运行它们。 Rule Plotter的默认策略仅涉及牛市和熊市的蜡烛,这意味着如果您在Rule Plotter中没有绘制任何策略,该扫描仪将向您展示所选资产在所有时间框架上的蜡烛颜色,如果蜡烛为负则为红色,为正则为绿色。 创建您想要的任意策略 不要局限于默认策略,发挥您的创造力,构建传统策略,使用Metatrader中的所有可用指标。 或者,使用您喜欢的指标构建定制策略。 此扫描仪仅是Rule Plotter所提供的功能的冰山一角;它只是Rule Plotter的辅助工具。 然而,真正的魔力并不在这些工具上,因为它们只是为您 发挥创造力 的工具。 通过此扫描仪,您将全面了解您选择的所有资产的所有时间框架中您的策略的表现。 同时观察到所有指标同时发出信号将使您充满信心地进入操作,因为您将全面了解市场中其他参与者正在看到什么,从而大大降低错
FREE
WH Price Wave Pattern MT5
Wissam Hussein
4 (9)
FREE
该产品的买家也购买
TPSpro RFI Levels MT5
Roman Podpora
4.73 (11)
指示       俄罗斯 -        英语   建议 与指示器一起使用     -       TPSpro 趋势专业版 -   MT4版本       交易中的一个关键要素是做出买卖交易工具决定的区域或水平。尽管主要参与者试图隐藏他们在市场中的存在,但他们不可避免地会留下痕迹。我们的任务是学习如何识别这些痕迹并正确解释它们。 主要功能: 向卖家和买家显示活跃区域! 该指标显示所有正确的初始买入和卖出脉冲水平/区域。激活这些水平/区域后,开始寻找切入点,水平会改变颜色并填充特定阴影。此外,还会显示箭头,以便更直观地了解情况。 显示更高时间范围内的级别/区域(MTF 模式) 添加了使用更高时间间隔显示级别/区域的功能。此外,该指标还具有自动趋势检测功能(   TPSproTREND PRO   )。 用于交易的单独专业的逐步算法。 该算法专为日内交易而设计,既可顺势交易,也可逆势交易。每个活动模板均提供详细说明。 适用于多种时间范围 。 TPSpro RFI 水平指标可用于图表上的任何时间范围,从一分钟(M1)开始一直到每月(MN)。 图形和声音警报。 该指标提供图形和声音指示
Atomic Analyst MT5
Issam Kassas
4.42 (19)
首先值得强调的是,该交易指标是非重绘、非延迟的指标,这使其成为手动和机器人交易的理想选择。 用户手册:设置、输入和策略。 Atomic Analyst是一种PA价格行动指标,利用价格的力量和动量来寻找市场上更好的机会。配备了高级过滤器,可帮助去除噪音和假信号,并提高交易潜力。使用多层复杂的指标,Atomic Analyst扫描图表,并将复杂的数学计算转化为任何初学者都能理解并用来做出一致交易决策的简单信号和颜色。 “Atomic Analyst”是专为新手和经验丰富的交易者量身定制的综合交易解决方案。它将高级指标和一流功能融合为一体的交易策略,使其成为所有类型交易者的多功能选择。 日内交易和剥头皮策略:专为快速准确的日内交易和短期交易而设计。 日内和摆动交易策略:可用作追求价格大幅波动的日内和摆动交易者的可靠工具。 多货币和市场:凭借其可靠的精度,在不同的工具和市场上运作。 多个时间框架:可在多个时间框架上使用,性能良好。 稳定性:所有指标均不重绘、不重绘和不滞后,确保可靠的信号。 信号清晰度:提供箭头信号,用于清晰的入场和出场点。 实时警报:通过交易入场、SL和TP警报通知交
Atbot
Zaha Feiz
4.91 (34)
AtBot: 它是如何工作的以及如何使用它 ### 它是如何工作的 “AtBot”指标用于MT5平台,通过结合技术分析工具生成买入和卖出信号。它集成了简单移动平均线(SMA)、指数移动平均线(EMA)和平均真实波幅(ATR)指标,以识别交易机会。此外,它还可以利用Heikin Ashi蜡烛来增强信号的准确性。 购买后留下评论,您将获得特别的奖励礼物。 ### 主要特点: - 不重绘: 信号在绘制后不会改变。 - 不变动: 信号保持一致,不会被更改。 - 无延迟: 提供及时的信号,没有延迟。 - 多种时间框架: 可在任何时间框架上使用,以适应您的交易策略。 ### 操作步骤: #### 输入和设置: - firstkey (TrendValue): 调整趋势检测的灵敏度。 - Secondkey (SignalValue): 定义买入/卖出信号生成的灵敏度。 - masterkey (ExitValue): 控制信号的退出策略。 - h: 切换是否根据Heikin Ashi蜡烛生成信号(真/假)。 - notifications: 启用或禁用信号提醒。 #### ATR计算: ATR测
Gold Stuff mt5
Vasiliy Strukov
4.92 (165)
Gold Stuff mt5 是专为黄金设计的趋势指标,也可用于任何金融工具。 该指标不会重绘,也不会滞后。 推荐时间框架 H1。 购买后立即联系我以获得设置和个人奖励!   你可以在我的个人资料中找到它。   重要! 购买后立即与我联系,以获得说明和奖金!   您可以免费收到我们的强力支持和趋势扫描指标的副本,请私信。大部头书!   设置 绘制箭头 - 打开关闭。 在图表上绘制箭头。 警报 - 打开关闭声音警报。 电子邮件通知 - 打开关闭。 电子邮件通知。 Puch-notification - 打开关闭。 推送通知。 接下来,调整色域。 Gold Stuff mt5 是专为黄金设计的趋势指标,也可用于任何金融工具。 该指标不会重绘,也不会滞后。 推荐时间框架 H1。 购买后立即联系我以获得设置和个人奖励!   设置 绘制箭头 - 打开关闭。 在图表上绘制箭头。 警报 - 打开关闭声音警报。 电子邮件通知 - 打开关闭。 电子邮件通知。 Puch-notification - 打开关闭。 推送通知。 接下来,调整色域。
首先,值得强调的是,这个交易系统是一个非重绘、非重画和非滞后的指标,这使得它非常适合手动和机器人交易。 在线课程,手册和下载预设。 “智能趋势交易系统 MT5”是专为新手和经验丰富的交易者量身定制的综合交易解决方案。它结合了超过 10 个优质指标,具有 7 多个强大的交易策略,使其成为适用于各种市场条件的多功能选择。 趋势跟随策略:提供精确的入场和止损管理,以有效地跟随趋势。 反转策略:识别潜在的趋势反转,使交易者能够利用区域市场的机会。 剃头策略:专为快速准确的日内交易和短期交易而设计。 稳定性:所有指标都不会重绘、不会重画和不会滞后,确保可靠的信号。 定制:支持自定义策略,以满足个人交易偏好。超过 7 种策略和组合可帮助您找到最佳策略。 信号清晰度:提供箭头信号,以指示清晰的入场和退出点。 实时警报:通过交易进出警报使交易者保持了解。 深入分析:提供更高时间框架的趋势分析和实时交易监控。 自适应颜色编码:利用蜡烛颜色编码来显示成交量、趋势和反转蜡烛信号。通过蜡烛颜色分析市场方向。 “智能趋势交易系统 MT5”赋予交易者必要的工具,以便在各种市场条件下做出明智和战略性的交易决策。无论
Quantum Trend Sniper
Bogdan Ion Puscasu
4.8 (49)
介绍   量子趋势狙击指标 ,突破性的 MQL5 指标,正在改变您识别和交易趋势反转的方式!由拥有超过13年交易经验的资深交易员团队开发,     量子趋势狙击指标   旨在通过其创新的方式以极高的准确度识别趋势反转,将您的交易之旅推向新的高度。 ***购买量子趋势狙击指标,即可免费获得量子突破指标!*** 当量子突破指标识别出趋势反转时,它会向您发出警报和信号箭头,并建议您三个止盈水平。 它既适合新手交易者,也适合专业交易者。 量子 EA 通道:       点击这里 MT4版本:       点击这里 建议: 时间范围: 所有时间范围。为了获得最佳结果,我们建议在 M15、M30 和 H1 时间范围内使用它。 货币对:欧元兑美元、英镑兑美元、澳元兑美元、欧元兑英镑、, EURAUD,  XAUUSD 账户类型:ECN、Raw 或 Razor,点差极低 经纪时间:任意 经纪商:IC Markets、Pepperstone with Raw 和 Razor 的点差最低 建议止损:50 点 建议止盈水平:20 点、50 点和
该仪表盘显示所选符号的最新可用谐波形态,因此您可以节省时间并提高效率 /  MT4 版本 。 免费指标:  Basic Harmonic Pattern 指标列 Symbol:   显示所选符号 Trend:     看涨或看跌 Pattern:    形态类型(Gartley、蝴蝶、蝙蝠、螃蟹、鲨鱼、Cypher 或 ABCD) Entry:     入口价格 SL: 止损价 TP1: 第一止盈价 TP2: 第二次获利价格 TP3: 第三次获利价格 Current price:    当前价格 Age (in bars):   最后绘制的模式的年龄 主要输入 Symbols :   从 "28 种主要货币对 "或 "选定符号 "中选择。 Selected Symbols :   希望监控的符号,用逗号分隔("EURUSD,GBPUSD,XAUUSD")。如果您的经纪商为货币对设置了后缀或前缀,您必须在以下两个参数中添加(货币对前缀或货币对后缀)。 Max Iteration:   调整模式的最大迭代次数(如果该值越小,则模式越少,性能越快;如果该值越大,则模式越多,性能
FX Power MT5 NG
Daniel Stein
5 (5)
通过 mql5 和 Telegram 上 的晨间简报获取每日市场更新,包括详细信息和屏幕截图 ! FX Power MT5 NG 是我们长期以来非常受欢迎的货币强度计算器 FX Power 的下一代产品。 这款下一代强度计算器能提供什么?您所喜爱的原版 FX Power 的所有功能 附加功能 黄金/XAU 强度分析 更精确的计算结果 可单独配置的分析周期 可自定义计算限制,以获得更好的性能 为希望查看更多信息的用户提供特殊的多实例设置 无尽的图形设置,可在每个图表中设置您最喜欢的颜色 无数的通知选项,让您再也不会错过任何重要信息 采用 Windows 11 和 macOS 风格的全新圆角设计 神奇的移动指标面板 FX Power 主要功能 所有主要货币的完整强势历史 所有时间框架内的货币强弱历史 所有经纪商和图表的计算结果完全相同 100% 可靠的实时计算 -> 无重绘 可通过下拉列表选择分析时段 通过自定义模式单独配置分析时段 可在一个图表中使用多个实例 可移动 FX Power 显示屏(通过拖放) 适用于高分辨率 QHD、UHD 和 4K 显示器 自动终端配置 针对平板电脑
Trend Screener Pro MT5
STE S.S.COMPANY
4.87 (63)
使用趋势筛选指标释放趋势交易的力量:由模糊逻辑和多货币系统提供支持的终极趋势交易解决方案! 使用趋势筛选器(由模糊逻辑提供支持的革命性趋势指标)提升您的趋势交易。 它是一个强大的趋势跟踪指标,结合了超过 13 种高级工具和功能以及 3 种交易策略,使其成为使您的 Metatrader 成为趋势分析器的多功能选择。 限时优惠:趋势筛选指标终身仅需 50 美元。 ( 原价 250$ ) (优惠延长) 体验趋势筛选器 100% 无需重新绘制的准确性,确保您的交易决策不受过去价格变化的影响。 释放多时间框架和多货币功能的多功能性,使您能够以无与伦比的信心在外汇、商品、加密货币和指数领域进行交易。 利用 Trend Screener 的综合策略套件增强您的交易: - 趋势跟踪策略和趋势延续策略 :趋势筛选器的趋势跟踪策略提供清晰的趋势延续信号,让您有效捕捉趋势走势并管理风险。 - 反转策略和早期入场点策略 :趋势筛选器的反转策略可检测市场方向的潜在变化,使您能够预测趋势反转并利用疲弱的市场趋势。通过早期入场点,您可以在潜在的趋势变化之前定位自己 获取可观的利润。 - 倒卖策略: 趋势筛选器的倒卖
首先,值得强调的是,这个交易工具是非重绘、非重画和非滞后的指标,非常适合专业交易。 在线课程,用户手册和演示。 智能价格行动概念指标是一个非常强大的工具,既适用于新手,也适用于经验丰富的交易者。它将超过20个有用的指标合并到一个指标中,结合了高级交易思想,如内圈交易员分析和智能资金概念交易策略。该指标侧重于智能资金概念,提供有关大型机构交易方式的见解,帮助预测它们的动向。 它在流动性分析方面尤其擅长,有助于理解机构的交易方式。它擅长预测市场趋势,并仔细分析价格波动。通过将您的交易与机构策略对齐,您可以更准确地预测市场走向。该指标多才多艺,擅长分析市场结构,识别重要的订单区块,并识别各种模式。 它擅长识别BOS和CHoCH等模式,理解动量的转变,并突出显示供需强劲的关键区域。它还擅长发现强大的不平衡,并分析价格创造更高高点或更低低点的模式。如果您使用斐波那契回撤工具,该指标可以满足您的需求。它还可以识别相等的高点和低点,分析不同的时间框架,并通过仪表板显示数据。 对于使用更高级策略的交易者,该指标提供了工具,如公平价值差指标和优惠和折扣区域的识别。它特别关注高时间框架订单
AT Forex Indicator MT5
Marzena Maria Szmit
5 (4)
The AT Forex Indicator MT5 is a sophisticated trading tool designed to provide traders with a comprehensive analysis of multiple currency pairs. This powerful indicator simplifies the complex nature of the forex market, making it accessible for both novice and experienced traders. AT Forex Indicator uses advanced algorithms to detect trends, patterns and is an essential tool for traders aiming to enhance their forex trading performance. With its robust features, ease of use, and reliable signal
TrendMaestro5
Stefano Frisetti
note: this indicator is for METATRADER4, if you want the version for METATRADER5 this is the link:  https://www.mql5.com/it/market/product/108106 TRENDMAESTRO ver 2.4 TRENDMAESTRO recognizes a new TREND in the bud, he never makes mistakes. The certainty of identifying a new TREND is priceless. DESCRIPTION TRENDMAESTRO identifies a new TREND in the bud, this indicator examines the volatility, volumes and momentum to identify the moment in which there is an explosion of one or more of these data a
ATrend
Zaha Feiz
4.8 (5)
ATREND: 工作原理及使用方法 工作原理 “ATREND”指标针对MT5平台设计,旨在通过结合多种技术分析方法为交易者提供强有力的买卖信号。该指标主要利用平均真实波幅(ATR)来测量波动性,并结合趋势检测算法来识别潜在的市场动向。 购买后请留言,您将获得特别的赠品。 剩余8份,售价30美元。 主要特点: - 动态趋势检测:该指标评估市场趋势并相应调整信号,帮助交易者与当前市场条件对齐策略。 - 波动性测量:通过使用ATR,该指标衡量市场波动性,这对于确定最佳止损(SL)和止盈(TP)水平至关重要。 - 信号可视化:该指标在图表上直观地表示买卖信号,增强交易者的决策能力。 操作步骤 输入和设置: - 时间框架:此输入允许您设置指标计算的主要时间框架,默认值为15分钟。 - 时间框架2:此输入可用于定义额外分析的辅助时间框架,默认值为1分钟。 - 移动:此参数允许您将指标的计算向回移动,默认值为0。 - SLATR:此输入定义用于根据ATR计算止损水平的乘数,默认值为2.56。 - TPATR:此输入定义用于根据ATR计算止盈水平的乘数,默认值也为2.56。 - Alerts
TPA True Price Action indicator reveals the true price action of the market makers through 100% non-repainting signals strictly at the close of a candle! TPA shows entries and re-entries, every time the bulls are definitely stronger than the bears and vice versa. Not to confuse with red/green candles. The shift of power gets confirmed at the earliest stage and is ONE exit strategy of several. There are available now two free parts of the TPA User Guide for our customers. The first "The Basics"
FxaccurateLS
Shiv Raj Kumawat
WHY IS OUR FXACCCURATE LS MT5 THE PROFITABLE ? PROTECT YOUR CAPITAL WITH RISK MANAGEMENT Gives entry, stop and target levels from time to time. It finds Trading opportunities by analyzing what the price is doing during established trends. POWERFUL INDICATOR FOR A RELIABLE STRATEGIES We have made these indicators with a lot of years of hard work. It is made at a very advanced level. Established trends provide dozens of trading opportunities, but most trend indicators completely ignore them!
Auto Order Block with break of structure based on ICT and Smart Money Concepts (SMC) Futures Break of Structure ( BoS )             Order block ( OB )            Higher time frame Order block / Point of Interest ( POI )    shown on current chart           Fair value Gap ( FVG ) / Imbalance   -  MTF      ( Multi Time Frame )    HH/LL/HL/LH  -  MTF      ( Multi Time Frame )  Choch  MTF      ( Multi Time Frame )  Volume Imbalance     ,  MTF          vIMB Gap’s Power of 3 Equal High
Advanced Supply Demand MT5
Bernhard Schweigert
4.5 (14)
任何新手或专业交易者的最佳解决方案! 该指标是一款独特、高质量、且价格合理的交易工具,因为我们已经整合了许多专有功能和新公式。 依据此更新,您将能够显示双重时间帧区域。 您不仅可以显示一个较高的时间帧,还可以同时显示图表时间帧,加上更高的时间帧:显示嵌套时区。 供需双方所有交易者都会喜欢它。 :) 重要信息披露 高级供需的最大潜力,请访问 https://www.mql5.com/zh/blogs/post/720245   想象您的交易如何得以改善,是因为您能够精准定位入场或目标位吗? 构建于新的底层算法,它可以更轻松地识别出买卖双方之间的潜在失衡。 这是因为它以图形方式展示供需最强劲区域,及其过去的表现(显示旧区域)。 这些功能旨在帮助您更轻松地发现最佳入场区域和价位。 现在您可以针对您的交易品种和时间帧来优化和编辑区域强度! 高级供需指标适用于所有产品和时间帧。 它是一个新的公式,非常新的功能是两个区域强度函数可由用户输入进行调整! 这在交易中是一大优势。 当您学习如何使用专有功能,例如带有价格游离最小 X 因子的区域强度时,您能够判断该区域强劲与否。 供需区域用作警报触发器
ICT, SMC, SMART MONEY CONCEPTS, SMART MONEY, Smart Money Concept, Support and Resistance, Trend Analysis, Price Action, Market Structure, Order Blocks, BOS/CHoCH,   Breaker Blocks ,  Momentum Shift,   Supply&Demand Zone/Order Blocks , Strong Imbalance,   HH/LL/HL/LH,    Fair Value Gap, FVG,  Premium  &   Discount   Zones, Fibonacci Retracement, OTE, Buy Side Liquidity, Sell Side Liquidity, BSL/SSL Taken, Equal Highs & Lows, MTF Dashboard, Multiple Time Frame, BigBar, HTF OB, HTF Market Structure
ICT,SMC,智能货币概念,支撑和阻力,趋势分析,价格行为,市场结构,订单区块,突破区块,动量转变,强大的不平衡,HH/LL/HL/LH,公允价值差距,FVG,溢价和折扣区域,斐波那契回撤,OTE,买方流动性,卖方流动性,流动性空白,市场交易时间段,NDOG,NWOG,银弹,ICT模板。 在金融市场中,准确的市场分析对于投资者来说至关重要。为了帮助投资者更好地理解市场趋势和流动性,我们提供了一份使用教程,旨在实现高级市场分析功能。以下是一些功能的简要介绍和实现方法: 1. 显示高时间框架市场结构:    通过设置参数,您可以在图表上显示高时间框架市场结构。这将帮助您更好地理解市场的整体走势和结构。您可以根据自己的需求设置时间周期,并在图表上显示市场结构。 2. 显示流动性:    流动性是市场的重要指标之一。通过设置参数,您可以在图表上显示买方和卖方的流动性。您可以自定义文本和颜色,以便更好地识别不同的流动性水平。您还可以选择显示伦敦AM会话和纽约午餐时间的流动性。 3. 显示公平价值差距:    公平价值差距是指市场价格与公平价值之间的差异。通过设置参数,您可以在图表上显示公平价
Black Dragon indicator mt5
Ramil Minniakhmetov
4.81 (53)
趋势检测指标将补充任何策略,也可用作独立工具。   好处 易于使用,不会因不必要的信息而使图表过载; 可用作任何策略的过滤器; 具有内置的动态支撑和阻力水平,可用于获利和设置止损; 指标在烛台关闭后不会改变颜色;  适用于股票市场、指数、石油、黄金和所有时间范围; 具有吐司通知、邮件通知、推送通知和声音提醒功能。 我的其他开发可以在这里找到: https://www.mql5.com/zh/users/mechanic/seller 输入参数 Alert - 开/关。警报; Push Notification - 开/关。推送通知; Mail - 开/关电子邮件通知; Fibo 1,2,3,4,5,6,7,11,21,31,41,51,61,71 - 动态支撑和阻力位的设置。
Entry Points Pro for MT5
Yury Orlov
4.46 (124)
这款指标用于 MT5,可提供准确的入场交易信号,且无重绘。 它可应用在任何金融资产:外汇、加密货币、贵金属、股票、指数。 它将提供极其精准的评估,并告诉您何时开仓和平仓的最佳时机。 观看 视频 (6:22),其中包含一个仅处理单一信号的示例,该信号即可值回指标购价! 大多数交易者在 Entry Points Pro 指标的帮助下,在第一个交易周内即改善了他们的交易结果。 订阅我们的 Telegram 群 ! Entry Points Pro 指标的益处。 入场信号无重绘 如果信号出现,并得到确认,则它不会再消失;不像是重绘指标,它会导致重大的财产损失,因为它们可以在显示信号后再将其删除。 无差错开仓 指标算法可令您找到入场交易(买入或卖出资产)的理想时机,从而提高每位交易者的成功率。 Entry Points Pro 可操作任何资产 它允许您在 MT5 平台上交易任何经纪商的加密货币、股票、贵金属、指数、大宗商品和货币。 提供任何方向的信号 Entry Points Pro 指标提供针对任意价格走势的入场交易信号 - 上涨、下跌或横盘(横向)。
Matrix Arrow Indicator MT5
Juvenille Emperor Limited
5 (12)
矩阵箭头指标 MT5   是一种独特的 10 合 1 趋势,遵循   100% 非重绘多时间框架指标 ,可用于所有符号/工具: 外汇 、 商品 、 加密货币 、 指数 、 股票 。 Matrix Arrow Indicator MT5 将在其早期阶段确定当前趋势,从多达 10 个标准指标中收集信息和数据,它们是: 平均定向运动指数 (ADX) 商品渠道指数 (CCI) 经典 Heiken Ashi 蜡烛 移动平均线 移动平均收敛散度 (MACD) 相对活力指数 (RVI) 相对强弱指数 (RSI) 抛物线SAR 随机振荡器 威廉姆斯的百分比范围 当所有指标给出有效的买入或卖出信号时,相应的箭头将打印在图表上,在下一根蜡烛/柱线开盘时,指示强劲的上升趋势/下降趋势。用户可以选择使用哪些指标,并可以单独调整每个指标的参数。 Matrix Arrow Indicator MT5 仅从选定的指标中收集信息,并仅根据其数据打印箭头。   Matrix Arrow Indicator MT5   还可以为所有新信号发送终端、推送通知或电子邮件警报。无论您是黄牛、日内交易者还是波段交易者, Mat
IX Power MT5
Daniel Stein
4.17 (6)
IX Power 终于将 FX Power 的无与伦比的精确性带到了非外汇交易符号中。 它能准确判断您喜爱的指数、股票、商品、ETF 甚至加密货币的短期、中期和长期趋势强度。 您可以 分析 终端提供的 一切 。试试吧,体验一下您在交易时如何把握 时机 。 IX Power 主要功能 100% 精确的非重绘计算结果 - 适用于您终端中的所有交易符号 下拉式选择预配置以及可单独配置的强度分析周期 通过电子邮件、消息和手机通知的无数种通知选项 可访问的 EA 请求缓冲区 可自定义计算限制,以获得更好的性能 为希望查看更多信息的用户提供特殊的多实例设置 无尽的图形设置,让您在每个图表中都能找到最喜欢的颜色 采用 Windows 11 和 macOS 风格的圆角新面板设计 神奇的移动指标面板,可在子窗口和主图表之间无缝移动 适用于高分辨率 QHD、UHD 和 4K 显示器,并针对平板电脑和触摸屏进行了优化 IX Power 参数 最重要的参数不言自明,但我们很快会在另一篇文章中为您提供所有 IX Power 参数的完整说明。 使用别名 "参数可为技术交易符号
Blahtech Supply Demand MT5
Blahtech Limited
4.54 (13)
Was: $299  Now: $99   Supply Demand uses previous price action to identify potential imbalances between buyers and sellers. The key is to identify the better odds zones, not just the untouched ones. Blahtech Supply Demand indicator delivers functionality previously unavailable on any trading platform. This 4-in-1 indicator not only highlights the higher probability zones using a multi-criteria strength engine, but also combines it with multi-timeframe trend analysis, previously confirmed swings
The 1 2 3 Pattern Scanner MT5
Reza Aghajanpour
5 (18)
** All Symbols x All Timeframes scan just by pressing scanner button ** *** Contact me  to send you instruction and add you in "123 scanner group" for sharing or seeing experiences with other users. After 17 years of experience in the markets and programming, Winner indicator is ready. I would like to share with you! Introduction The 123 Pattern Scanner indicator with a special enhanced algorithm is a very repetitive common pattern finder with a high success rate . Interestingly, this Winner in
Stratos Pali mt5
Michela Russo
5 (1)
Stratos Pali Indicator is a revolutionary tool designed to enhance your trading strategy by accurately identifying market trends. This sophisticated indicator uses a unique algorithm to generate a complete histogram, which records when the trend is Long or Short. When a trend reversal occurs, an arrow appears, indicating the new direction of the trend. Important Information Revealed Leave a review and contact me via mql5 message to receive My Top 5 set files for Stratos Pali at no cost ! Do
Blahtech Market Profile MT5
Blahtech Limited
5 (9)
Was: $249  Now: $99   Market Profile defines a number of day types that can help the trader to determine market behaviour. A key feature is the Value Area, representing the range of price action where 70% of trading took place. Understanding the Value Area can give traders valuable insight into market direction and establish the higher odds trade. It is an excellent addition to any system you may be using. Inspired by Jim Dalton’s book “Mind Over Markets”, this indicator is designed to suit the
PZ Swing Trading MT5
PZ TRADING SLU
5 (4)
Swing Trading 是第一个旨在检测趋势方向的波动和可能的反转波动的指标。它使用在交易文献中广泛描述的基准摆动交易方法。该指标研究多个价格和时间向量,以追踪总体趋势方向,并检测市场超卖或超买并准备好进行修正的情况。 [ 安装指南 | 更新指南 | 故障排除 | 常见问题 | 所有产品 ] 市场波动的利润不会被窃取 指示器始终显示趋势方向 彩色价格带代表机会基准 彩色虚线表示可能的反转波动 该指标分析其自身的质量和性能 它实现了一个多时间仪表板 可定制的趋势和波动周期 它实现了电子邮件/声音/推送警报 指示器为非重涂或重涂 什么是摇摆交易 摇摆交易是一种尝试在一天到一周内从证券中获得收益的交易方式,尽管某些交易最终可以保持更长的寿命。摇摆交易者使用技术分析来买入弱点和卖出力量,并有耐心等待这些机会的发生,因为在发生一波抛售浪潮之后购买证券而不是陷入抛售更有意义。 机会基准 关于历史数据的大量研究证明,适合于波动交易的市场倾向于在基线价格带上下交易,基线价格带由图表显示,使用平均真实区间计算得出。波动交易者使用基线,该策略是购买常态和卖出躁狂,或做空常态并掩盖沮丧。
FX Volume MT5
Daniel Stein
4.93 (14)
通过 mql5 和 Telegram 上 的 " 晨间简报 "获取每日市场更新,包括详细信息和屏幕截图 ! 外汇交易量(FX Volume)是第一个也是唯一一个从经纪商角度真正洞察市场情绪的交易量指标。 直接在您的图表上看到这些信息是真正改变游戏规则和突破性的交易解决方案。 受益于独特的市场数据洞察,如 比率(Ratios )显示货币多头和空头头寸的比率(百分比 比率变化 显示所选时间段内的多头比率及其百分比变化 总交易量 显示货币的总交易量(多头和空头),以手为单位 多头 交易量显示货币所有多头头寸的交易量 空头 交易量显示所有货币空头头寸的交易量 净多头 显示净多头交易量,即所有多头头寸减去所有空头头寸(以手为单位)。 净多头百分比 显示货币净多头交易量的变化 请阅读我们的基本教程 -> "如何使用外汇交易量进行交易 " 获取更多信息,如常见问题、交易技巧和教程视频,请访问我们的 外汇交易量公共信息频道 请 安装并运行 SI Connect 以建立与我们数据中心的持续连接 背景信息 我们都知道,外汇是一个分散的市场。这就是为什么我们必须打破常规思维,开发一个独
作者的更多信息
MT4 Local Trade Copier Pro
Biswarup Banerjee
3.55 (11)
About The Product This is an mt4 expert advisor which will let the end user to copy trades from a source mt4 account to N different mt4/mt5 account in the same pc. It is specially useful when you want to copy your trades from an account to several client account or accounts which will have different parameter for those trades. This product provides options to copy trades with different options as well as copy them in reverse. you can find the MT5 version   here . You can try the free trial demo
Product Name: Moving Average Crossover EA MT5 Description: Welcome to the pinnacle of automated trading with the Moving Average Crossover EA for MetaTrader 5. This expert advisor is meticulously designed to harness the power of moving averages, offering traders a versatile solution for capturing trend reversals and potential entry points. With an array of customizable settings and robust features, this EA is set to redefine your trading strategies and amplify your trading experience. Mt4 version
This is very simple strategy based on martingale and reverse martingale strategy. When Ea keeps on winning it multiplies with winning multiplier ,when it has a loosing streak it multiplies with loosing multiplier. Whenever cycle goes from winning to loosing or vice versa the lot size will be reset to default one. This will keep the risk minimized as we are using it for both side. Also when we are in loosing streak we keep on changing the order type from its previous example. For detailed documen
Brilliant Reversals Alert MT5
Biswarup Banerjee
5 (1)
Brilliant Reversal Indicator for MetaTrader 5 - Your Ultimate Alert-Driven Trading Solution Unlock unparalleled trading success with the "Brilliant Reversal Indicator" tailored for MetaTrader 5. This powerful tool has been meticulously designed to empower traders by identifying critical reversal opportunities with lightning-fast alerts. Key Features: Precise Reversal Detection: The Brilliant Reversal Indicator for MT5 specializes in pinpointing potential trend reversals, providing you with a str
RSI OverBought OverSold EA MT5
Biswarup Banerjee
4.5 (2)
RSI Trader Expert Advisor for MetaTrader 5 Introduction: Welcome to the RSI Trader EA, an advanced tool designed exclusively for MetaTrader 5. This expert advisor streamlines trading activities by harnessing the power of the Relative Strength Index (RSI) indicator, automating trade entries and exits based on overbought and oversold conditions. The EA also facilitates reverse trading setups within these zones, offering a versatile approach to managing trades. You can find MT4 version here For det
Double top and bottom indicator is a pattern scanning indicator which scans the tops and bottoms using zig zag pattern. When it find price bouncing back from the same point twice after a long trend then it generate arrow signals whenever the last resistance points is broken for double bottom and last support price broken for double top. Unlike other top bottom scanner it does not give only 1 signal. it alerts user when ever the last support /resistance is broker from double top/bottom pattern un
FREE
About The Product This is an MT5 expert advisor which will let the end user to copy trades from a source mt5 account to N different mt5/mt4 account in the same pc. It is specially useful when you want to copy your trades from an account to several client account or accounts which will have different parameter for those trades. This product provides options to copy trades with different options as well as copy them in reverse. You can try the free trial demo on the link below. Complete User Gu
MT5 Candlestick Pattern Alert Indicator: Enhance Trading Precision and Speed Overview The MT5 Candlestick Pattern Alert Indicator stands as a robust solution tailored to empower traders by swiftly detecting candlestick patterns and delivering timely alerts through various channels. This advanced tool facilitates efficient analysis of patterns, enabling traders to seize potential profitable trades promptly. Significance of Candlestick Patterns Candlestick patterns play a pivotal role in technical
FREE
Balanced Martingale
Biswarup Banerjee
This is very simple strategy based on martingale and reverse martingale strategy. When Ea keeps on winning it multiplies with winning multiplier ,when it has a loosing streak it multiplies with loosing multiplier. Whenever cycle goes from winning to loosing or vice versa the lot size will be reset to default one. This will keep the risk minimized as we are using it for both side. Also when we are in loosing streak we keep on changing the order type from its previous example for example if we hav
Welcome to the next level of trading sophistication with the Bollinger Bands Scanner for MT5! Elevate your trading experience and unlock enhanced insights and efficiency with our powerful MT5 indicator. Key Features: Effortless Bollinger Bands Scanning: Seamlessly harness the power of the Bollinger Bands Scanner to scan multiple assets effortlessly. Receive instant alerts when specific Bollinger Bands conditions are met, ensuring you're always ahead of market movements. Comprehensive Dashboard I
Angle of Moving Averages This indicator is very simple yet powerful concept which constantly calculate the slope of the current bar moving average with respect to the N bar before moving average value. This no only give a good entry and exit signal but also it shows traders the strength of the signal. It shows positive green histogram when market is moving toward upward direction and red histograms for downtrend. When large histograms found means market has  very strong trend. Inputs Available
Nadaraya Watson Envelop Alert
Biswarup Banerjee
5 (2)
The Nadaraya Watson Envelop indicator for MT5 is a popular tool used by traders to identify trends and potential buy/sell signals. The indicator is based on a non-parametric regression model that uses kernel smoothing to estimate the underlying trend of the market. The resulting envelopes are then plotted around the trend line, providing traders with an indication of where prices are likely to fluctuate. One of the key features of this indicator is its ability to send alerts, emails, and notific
Grid Trade Manager MT5
Biswarup Banerjee
5 (1)
Product Name: Grid Trade Manager MT5 Description: The Grid Trade Manager EA for MetaTrader 5 is meticulously crafted to oversee trades employing a grid trading strategy. It strategically places a sequence of pending buy and sell orders at predefined intervals, forming a grid pattern. This EA vigilantly monitors market fluctuations, dynamically adjusting the grid to optimize potential profits. Additionally, it incorporates robust risk management features to control grid size and curtail potential
FREE
Product Name: Hedge Trade Manager MT5 Description: The "Hedge Trade Manager" EA for MetaTrader 5 is a sophisticated solution designed to adeptly manage trades through a hedge trading strategy. With a range of configurable settings, this EA provides comprehensive control over hedge trades. The documentation below outlines the various inputs and parameters to assist you in customizing the EA to suit your trading preferences. Overall Settings/Input Guide Name Setting Description General Settings Ma
FREE
The Nadaraya Watson Envelope is a technical indicator available in the MetaTrader 4 (MT4) platform. It uses a non-parametric method to estimate the underlying trend of a financial asset based on its past price movements. The envelope is created by calculating a weighted average of the asset's past prices, with more recent prices being given greater weight. This produces a smooth curve that represents the estimated trend of the asset. The envelope is then drawn around this curve, with upper and l
MT4 Candlestick Pattern Alert Indicator: Stay Ahead of Trading Opportunities Overview The MT4 Candlestick Pattern Alert Indicator is a robust tool designed to empower traders by detecting candlestick patterns and delivering timely alerts through notifications, emails, and pop-up alerts. This invaluable tool saves traders precious time, allowing focused analysis on patterns and potential profitable trades. Importance of Candlestick Patterns Candlestick patterns are pivotal in technical analysis,
FREE
Product Name: Trailing Stop and Breakeven Management EA Description: This EA (Expert Advisor) is designed to set trailing stops and breakeven levels for trades based on input parameters and a magic number in MT5. It can be used to manage trades placed manually or by any other EA. The EA allows customization of various settings to suit your trading strategy. General Settings: Enable Magic Number (ENABLE_MAGIC_NUMBER): Enable to use a magic number for trades. Set to false for manual trades. Magic
FREE
STC Indicator
Biswarup Banerjee
STC Indicator  - Boost Your Trading Strategy with Smart Trend Confirmation Description: Enhance your trading strategies and maximize profitability with the STC Indicator for TradingView. Developed by industry experts, the STC Indicator (Schaff Trend Cycle) is a powerful technical analysis tool that combines the best of both trend-following and oscillator indicators to provide reliable buy/sell signals. With its unique algorithm, the STC Indicator effectively identifies trend cycles and confirms
Super Trend Alert
Biswarup Banerjee
Super Trend Indicator for MetaTrader 5 - Elevate Your Trading Precision Experience the future of trading with the "Super Trend Indicator" designed for MetaTrader 5. This versatile tool is your key to precise market analysis, providing insights into potential trend directions that enhance your trading decisions. Basic Details : Indicator Type : Super Trend Indicator for MetaTrader 5 Key Metrics : Real-time analysis of market trends using a proprietary algorithm. Customization : Fully customizable
The MT4 indicator that we are describing is designed to provide traders with an alert, notification, and email when Fibonacci levels are crossed. The Fibonacci levels are calculated based on the zigzag indicator, which helps to identify potential trend reversals in the market. When the indicator detects that a price has crossed a Fibonacci level, it will trigger an alert and send a notification to the trader's MT4 mobile app. Additionally, the indicator can be configured to send an email to the
FREE
Welcome to the world of advanced trading with the CCI Multicurrency Scanner for MT5! Elevate your trading experience with our powerful MT5 indicator meticulously designed for seamless analysis and real-time insights. Key Features: Effortless CCI Scanning: Unlock the full potential of the CCI Multicurrency Scanner for MT5 by effortlessly scanning multiple currency pairs. Receive instant alerts when specific Commodity Channel Index (CCI) conditions are met, ensuring you stay ahead of market moveme
Day and Week separator is a very simple tool to show day and week separator lines from a specific time mentioned in the input. This is specially helpful for the trades who has time zone differences in their broker terminal. Let us take an example  If user know that at 7:00 in the chart his local time 00:00 then he will simply put 7:00 in the input . Separator lines will starts drawing from current day's 7:00 There is also a bold line for weekly separator
FREE
Account Trailing Stop Manager MT5 Description: The "Account Trailing Stop Manager MT5" EA is designed to automatically calculate and remember the profit of the entire account or specific magic number, and trail it like a trailing stop loss. When the current profit becomes lower than the last saved profit, it will close all trades. This EA provides a convenient way to manage trailing stops for your account. For detailed documentation  Overall Settings/Input Guide   High Level Overview of Featu
FREE
Simple trade manager panel is a very usefull utility which gives the trader a flexibility to place orders and close them by profit and loss amount . It also helps in trailing the profit with amount.  It works seamlessly on mt4 terminal. It has features to close specific order type or close all trades Features in nutshell Stoploss ,Takeprofit and Lot size control Book Profit based on amount Cut Loss based on amount Trail Profit after some time Close specific order Type Close all orders
FREE
Nadaray Watson Envelope Strategy: The Nadaray Watson Envelope strategy is a technical analysis tool used to identify trends and support and resistance levels. It is based on the Nadaray Watson estimator, which is a non-parametric regression method. The strategy uses envelopes around price data to signal entry and exit points. For detailed documentation  Overall Settings/Input Guide   High Level Overview of Features Category Setting Description GENERAL SETTINGS Lot Size Initial volume for the fir
Angle of Averages
Biswarup Banerjee
Angle of Moving Averages This indicator is very simple yet powerful concept which constantly calculate the slope of the current bar moving average with respect to the N bar before moving average value. This no only give a good entry and exit signal but also it shows traders the strength of the signal. It shows positive green histogram when market is moving toward upward direction and red histograms for downtrend. When large histograms found means market has  very strong trend. Inputs Available
Volume Oscilator is a popular indicator available in trading view which is very popular among traders Definition The Volume Oscillator is an indicator made up of two Moving Averages (MA) surrounding volume, one being fast and the other slow. The slow volume MA value is then subtracted from the value of the fastlow Moving Average. The Volume Oscillator measures volume by analyzing the relationship between the two Moving Averages mentioned. When combined with other indicators it provides a very st
FREE
Risk Management Panel is unique to tool calculate your risk quickly and place trades based on your account money. There are two options for the user  Account Equity Account Balance Tools like these is specially useful when you have to take a quickly decision about your trade but dont have the time to calculate the risk. It works with magic number. So the advantage is a trade placed by this panel could be manipulated by the other expert advisors as well
FREE
Angle Of Price
Biswarup Banerjee
1 (1)
Angle of Price It is a trend following indicator. The idea behind this indicator is very simple. it calculates the angle of certain price type with its N candle back price type. When the price is moving toward upward direction positive angle histograms will be created and vice versa for downward direction. There are couple of price type supported in this indicator. Which is as follows Close Open High Low Median Typical Weighted When combined with other indicators it could be used as a very power
FREE
Close Manager EA for MetaTrader 5 Introduction: Welcome to the Close Manager EA, an essential tool designed exclusively for MetaTrader 5. This expert advisor has been meticulously crafted to streamline and enhance the trade closure process. Whether trades are initiated manually or by other EAs, this tool offers a diverse range of customizable criteria, empowering traders with enhanced control over their trade exits. You can find the MT4 version here Key Features: Logs Capture (SHOW_LOGS): Enable
FREE
筛选:
Findolin
1045
Findolin 2024.09.04 13:05 
 

Very good indicator. Thank you yery much!

Biswarup Banerjee
16772
来自开发人员的回复 Biswarup Banerjee 2024.09.04 13:16
Thanks for the feedback
回复评论
版本 2.0 2024.08.23
alert is added