Volume Break Oscillator MT4
- 指标
- Roberto Bonati
- 版本: 1.0
- 激活: 5
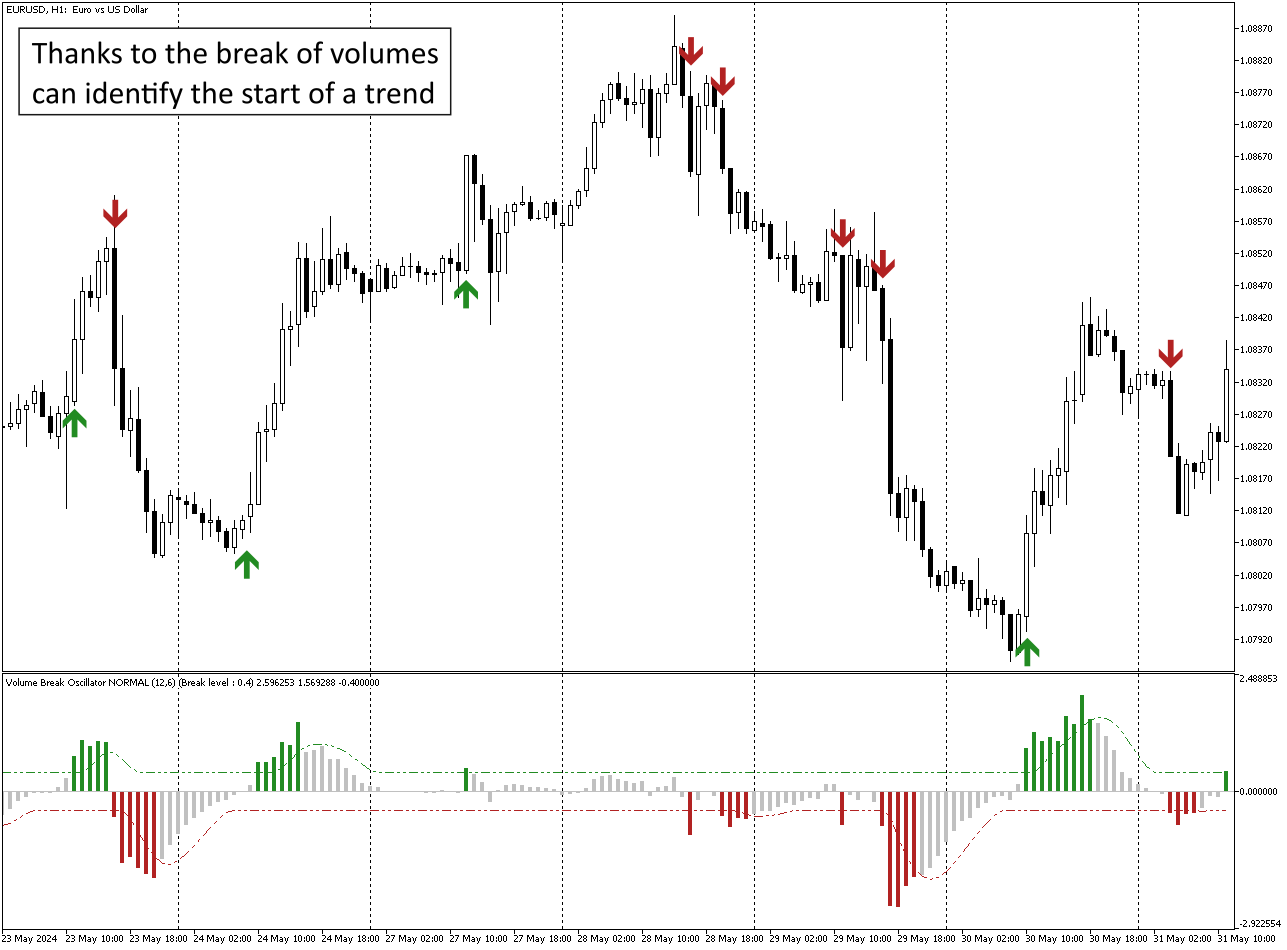
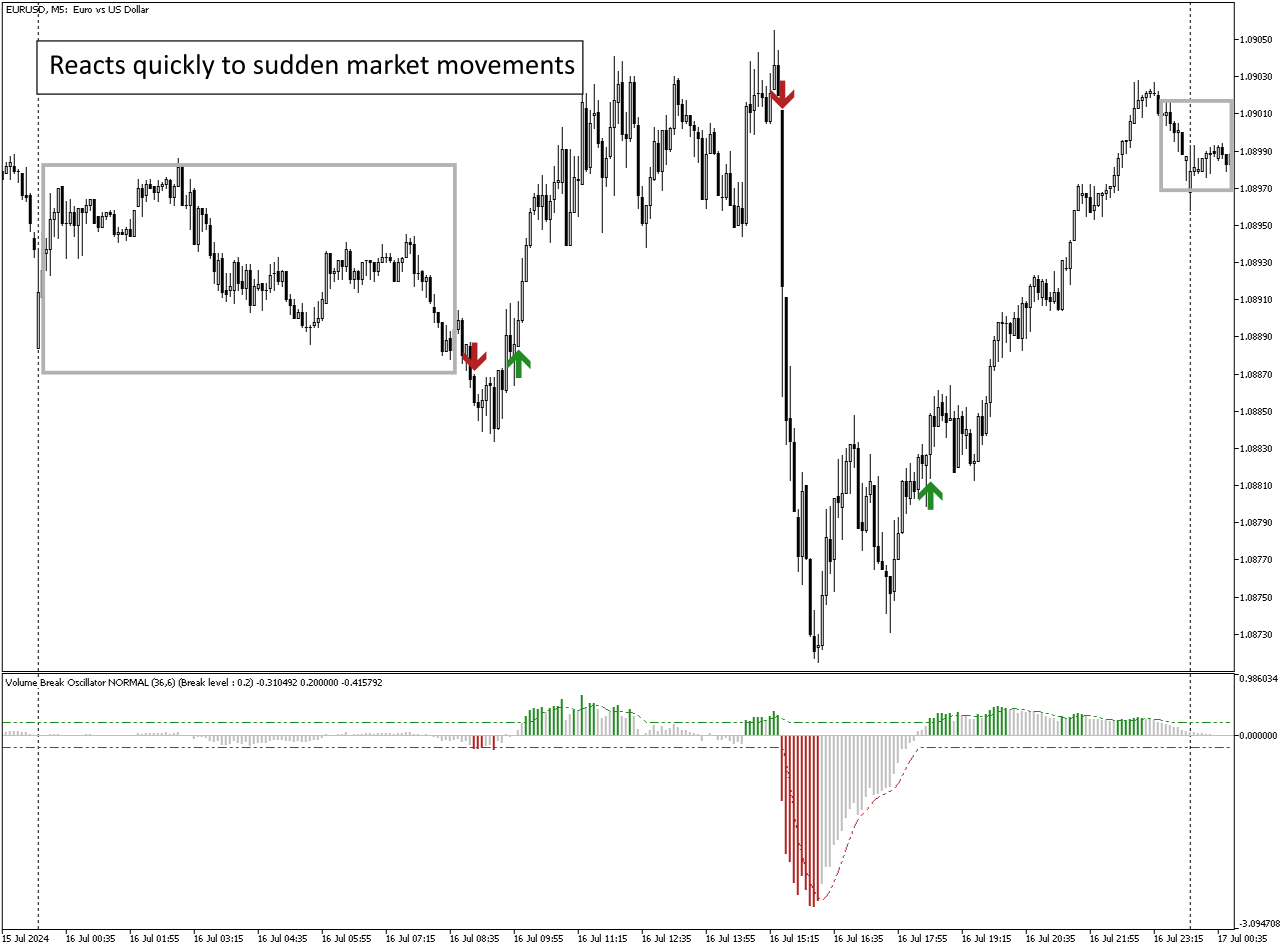
Volume Break Oscillator is an indicator that matches price movement with volume trends in the form of an oscillator.
I wanted to integrate volume analysis into my strategies but I have always been disappointed by most volume indicators,
such as OBV, Money Flow Index, A/D but also as Volume Weighted Macd and many others.
I therefore wrote this indicator for myself, I am satisfied with how useful it is, and therefore I decided to publish it on the market.
Main features:
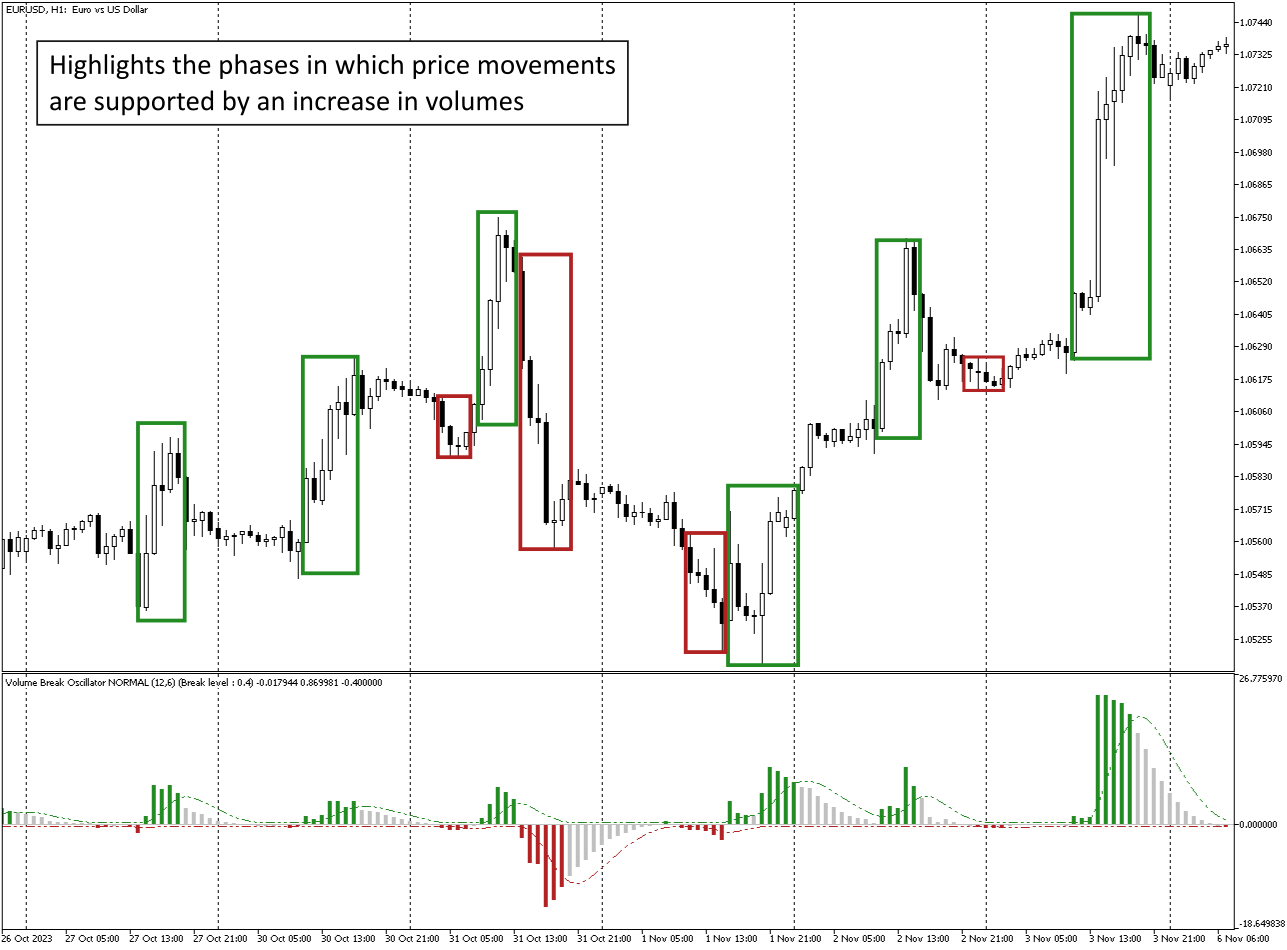
It highlights the phases in which the price moves in a direction supported by an increase (break) in volumes.
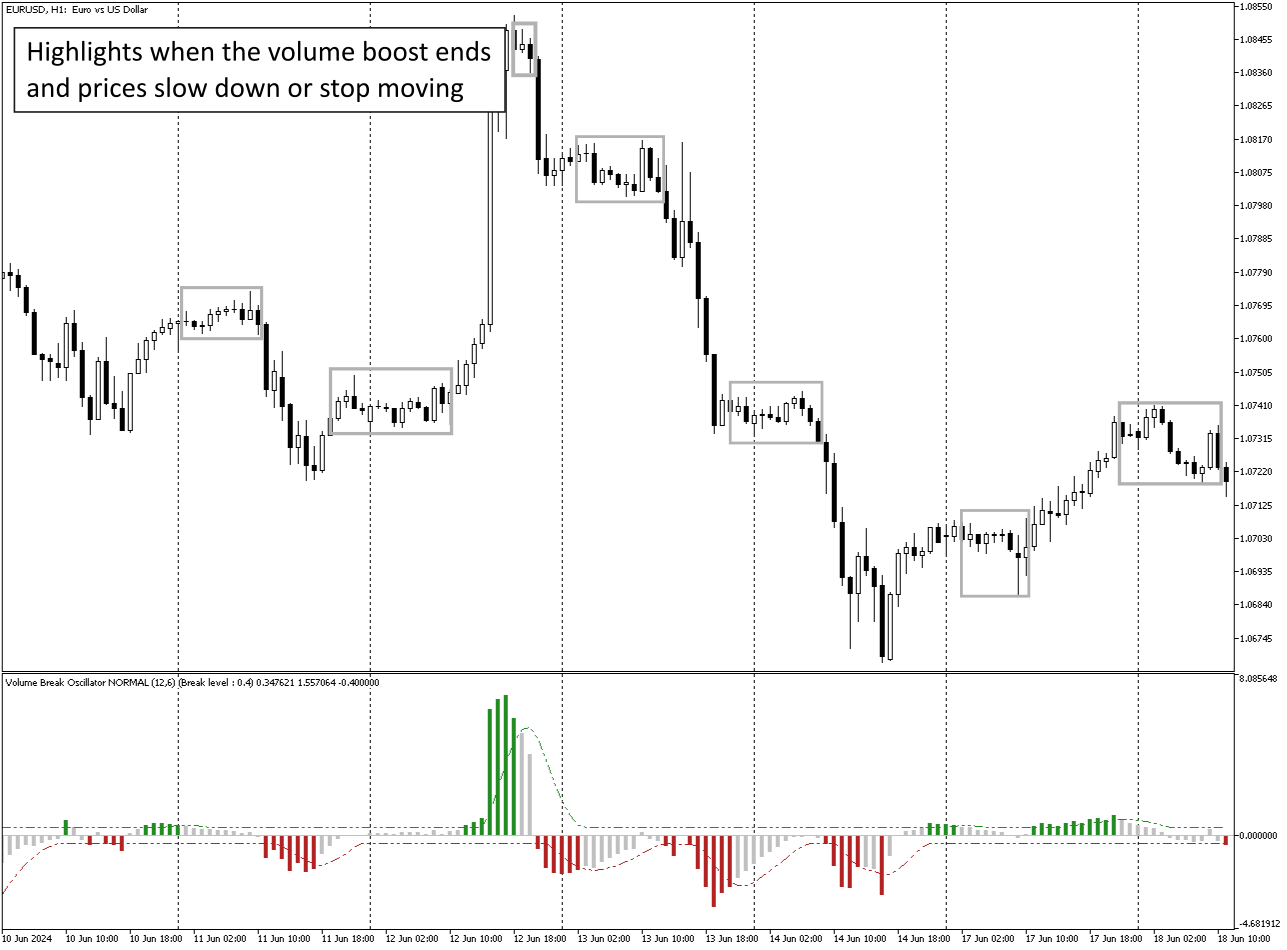
It highlights the phases in which the volume boost stops and therefore the market contracts.
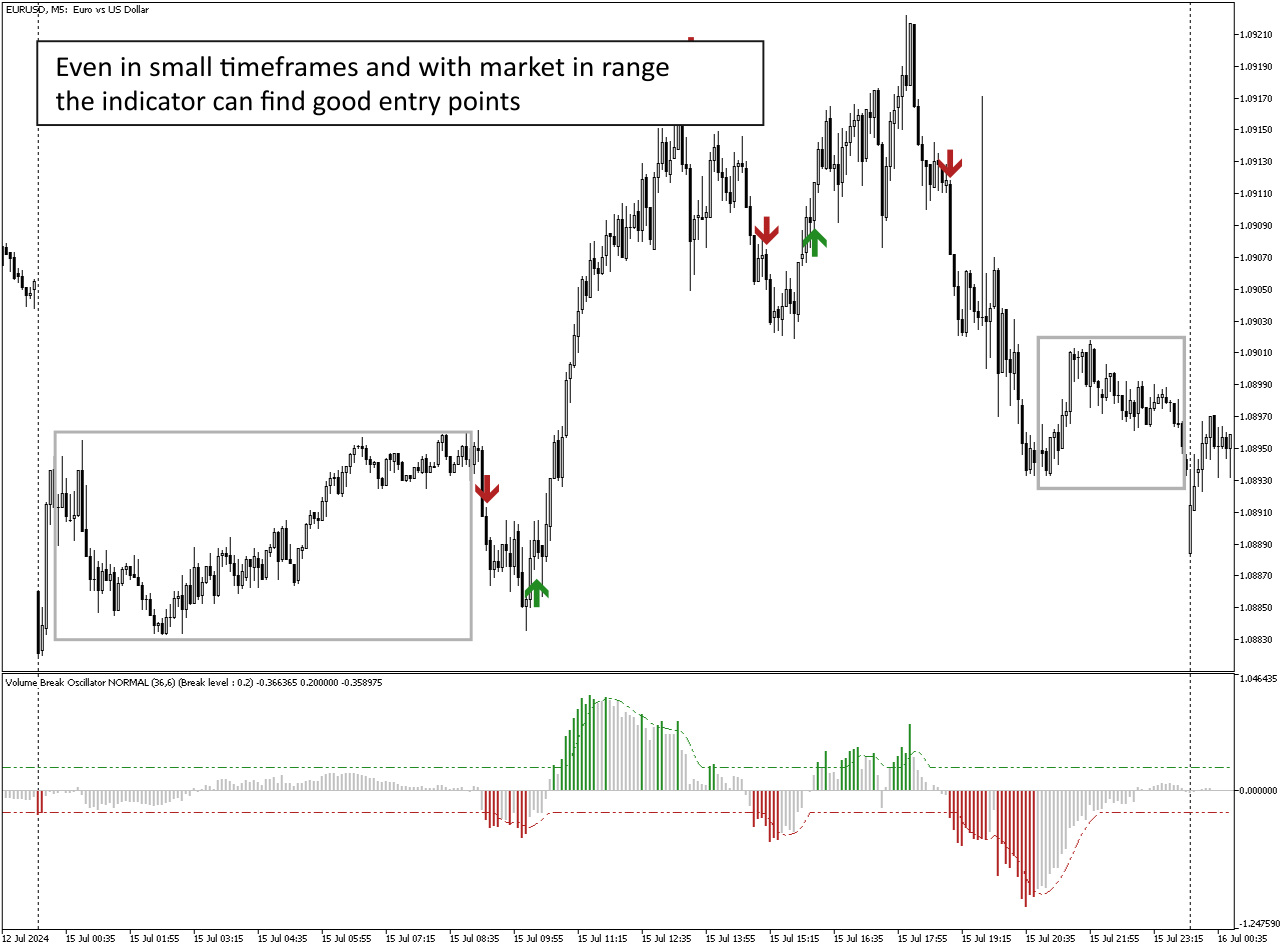
It highlights the phases in which, especially in intraday trading with timeframes (<=15 minutes), neither prices nor volumes move so the market is ready for a future break.
Filter false signals from other Expert Advisors when they are not supported by a volume break.
It makes it very easy to visualize trend and range phases
Algorithm features:
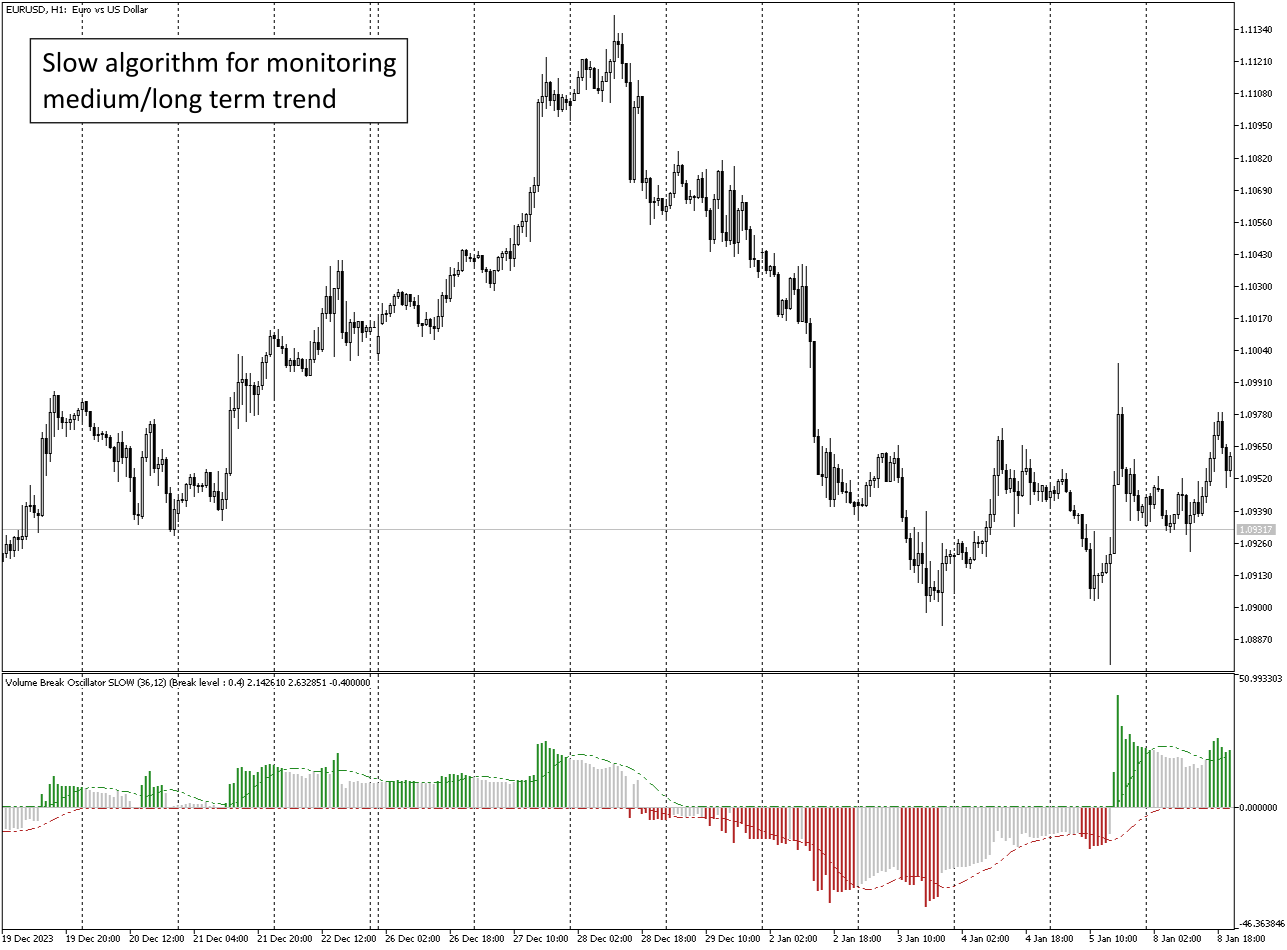
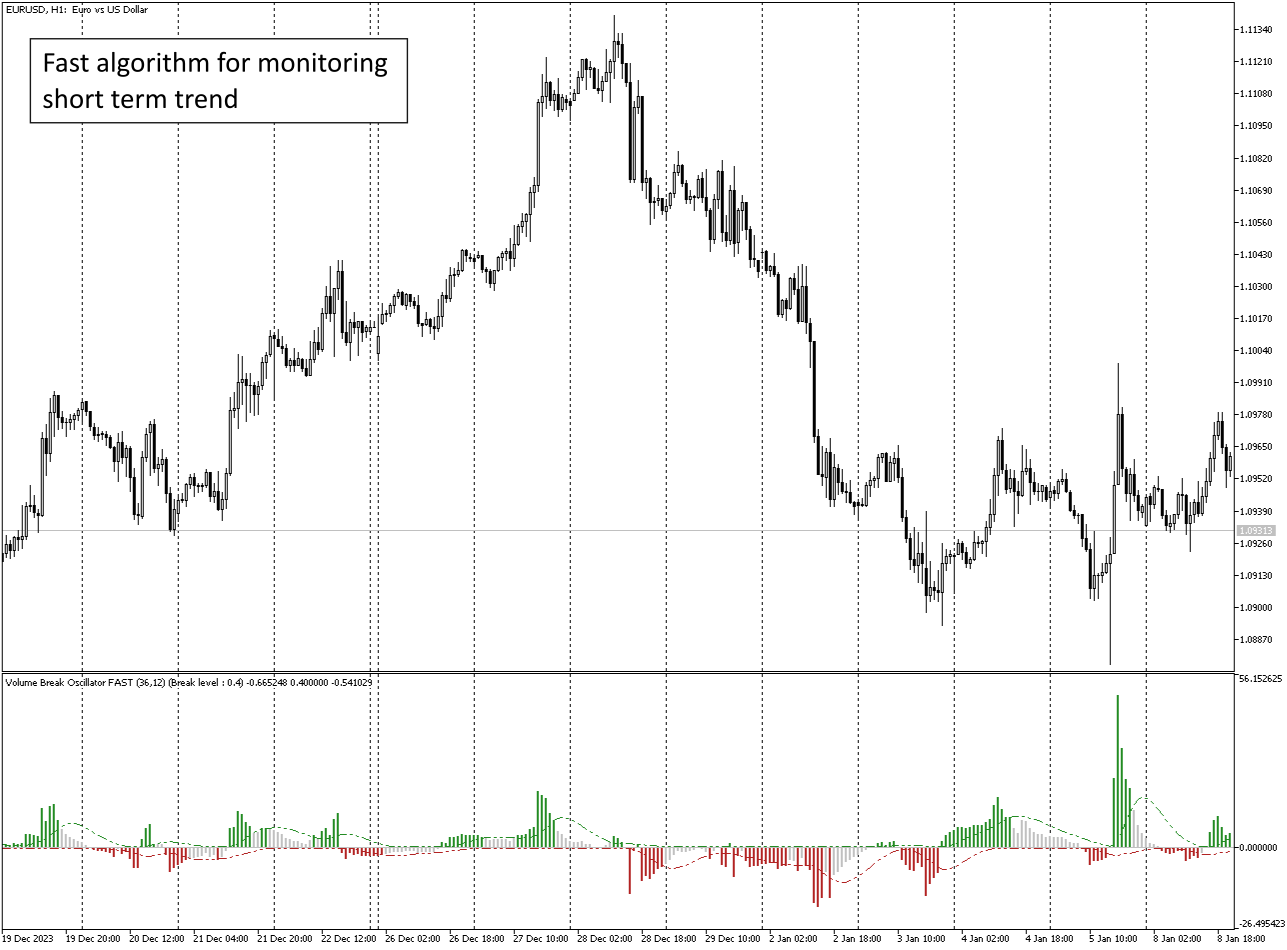
Three types of calculation FAST, NORMAL, SLOW, to monitor short, medium and long term, remaining in the same timeframe.
Adjustable break level.
Two types of volume TickVolume (mainly for Forex) and RealVolume (for stock market)
Settings for Alerts, Mail and Push Notification: 1-instant on break, 2 -at close of the bar.
Buffer number to recall in the EA:
0 - Histogram
1 - Histogram Up
2 - Histogram Dn
3 - Break Line Up
4 - Break Line Down