Draw Pivot Point
- 指标
- Rainer Schnoege
- 版本: 1.0
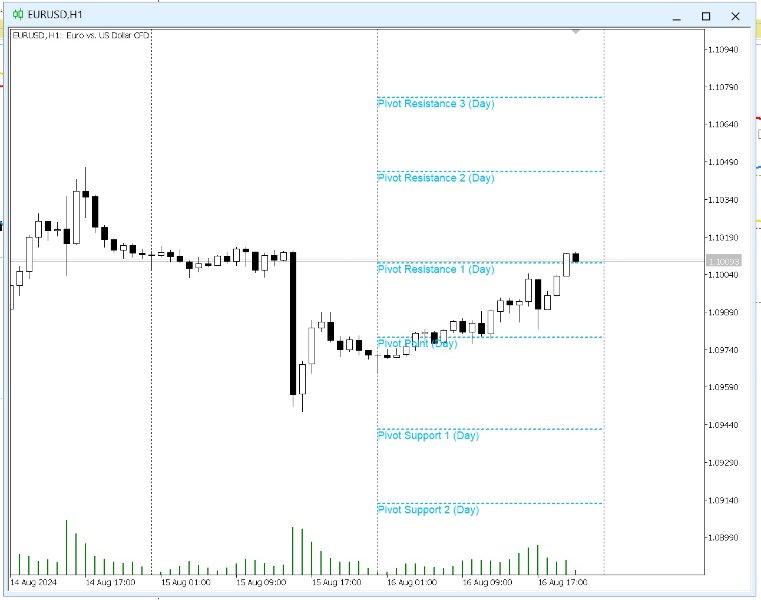
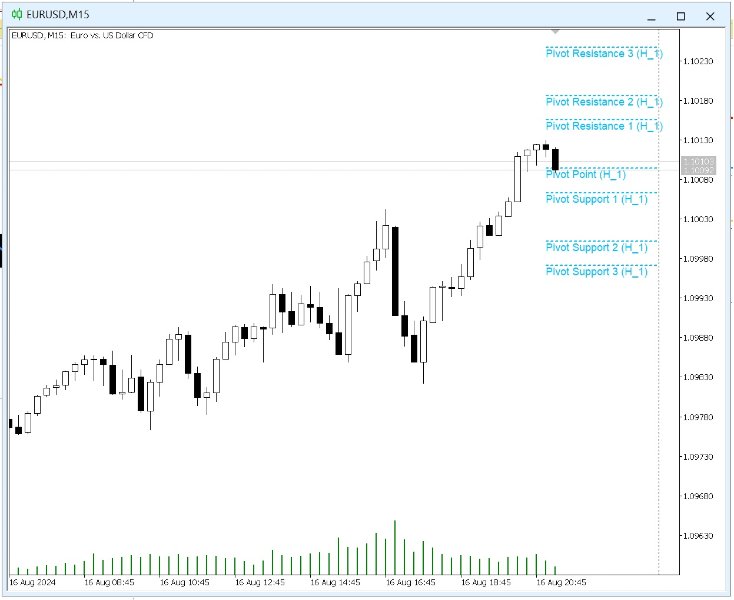
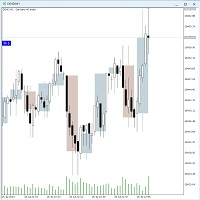
The utility draws pivot levels for the selected timefram in classic method.
Pivot = (high + close + low) / 3
R1 = (2 * Pivot) - low
S1 = (2 * Pivot) - high
R2 = Pivot + ( high - low )
R3 = high + (2 * (Pivot - low))
S2 = Pivot - (high - low)
S3 = low - (2 * (high - Pivot))
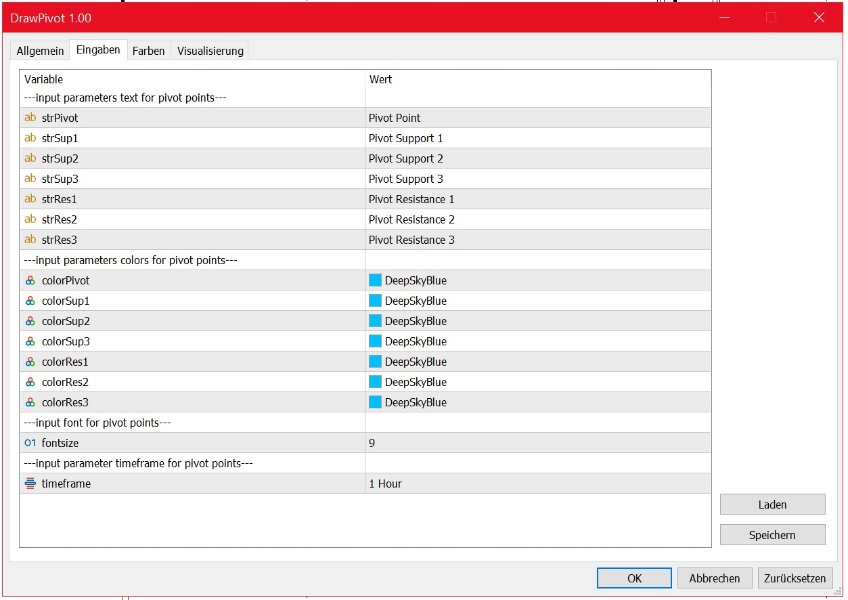
you can change the timeframe, colors and fontsize.
also you can change the text for the levels.
Have fun and give feedback...

