TrendLinePro2
- 指标
- Koichiro Kato
- 版本: 3.48
- 激活: 5
★★★★★4.8(25 reviews) Rating on gogojungle
【TrendLinePro2】
MT4(MetaTrader 4)线交易辅助指标。
这是一个非常基本的规格,推荐给所有人,假设它忠实于道氏理论。
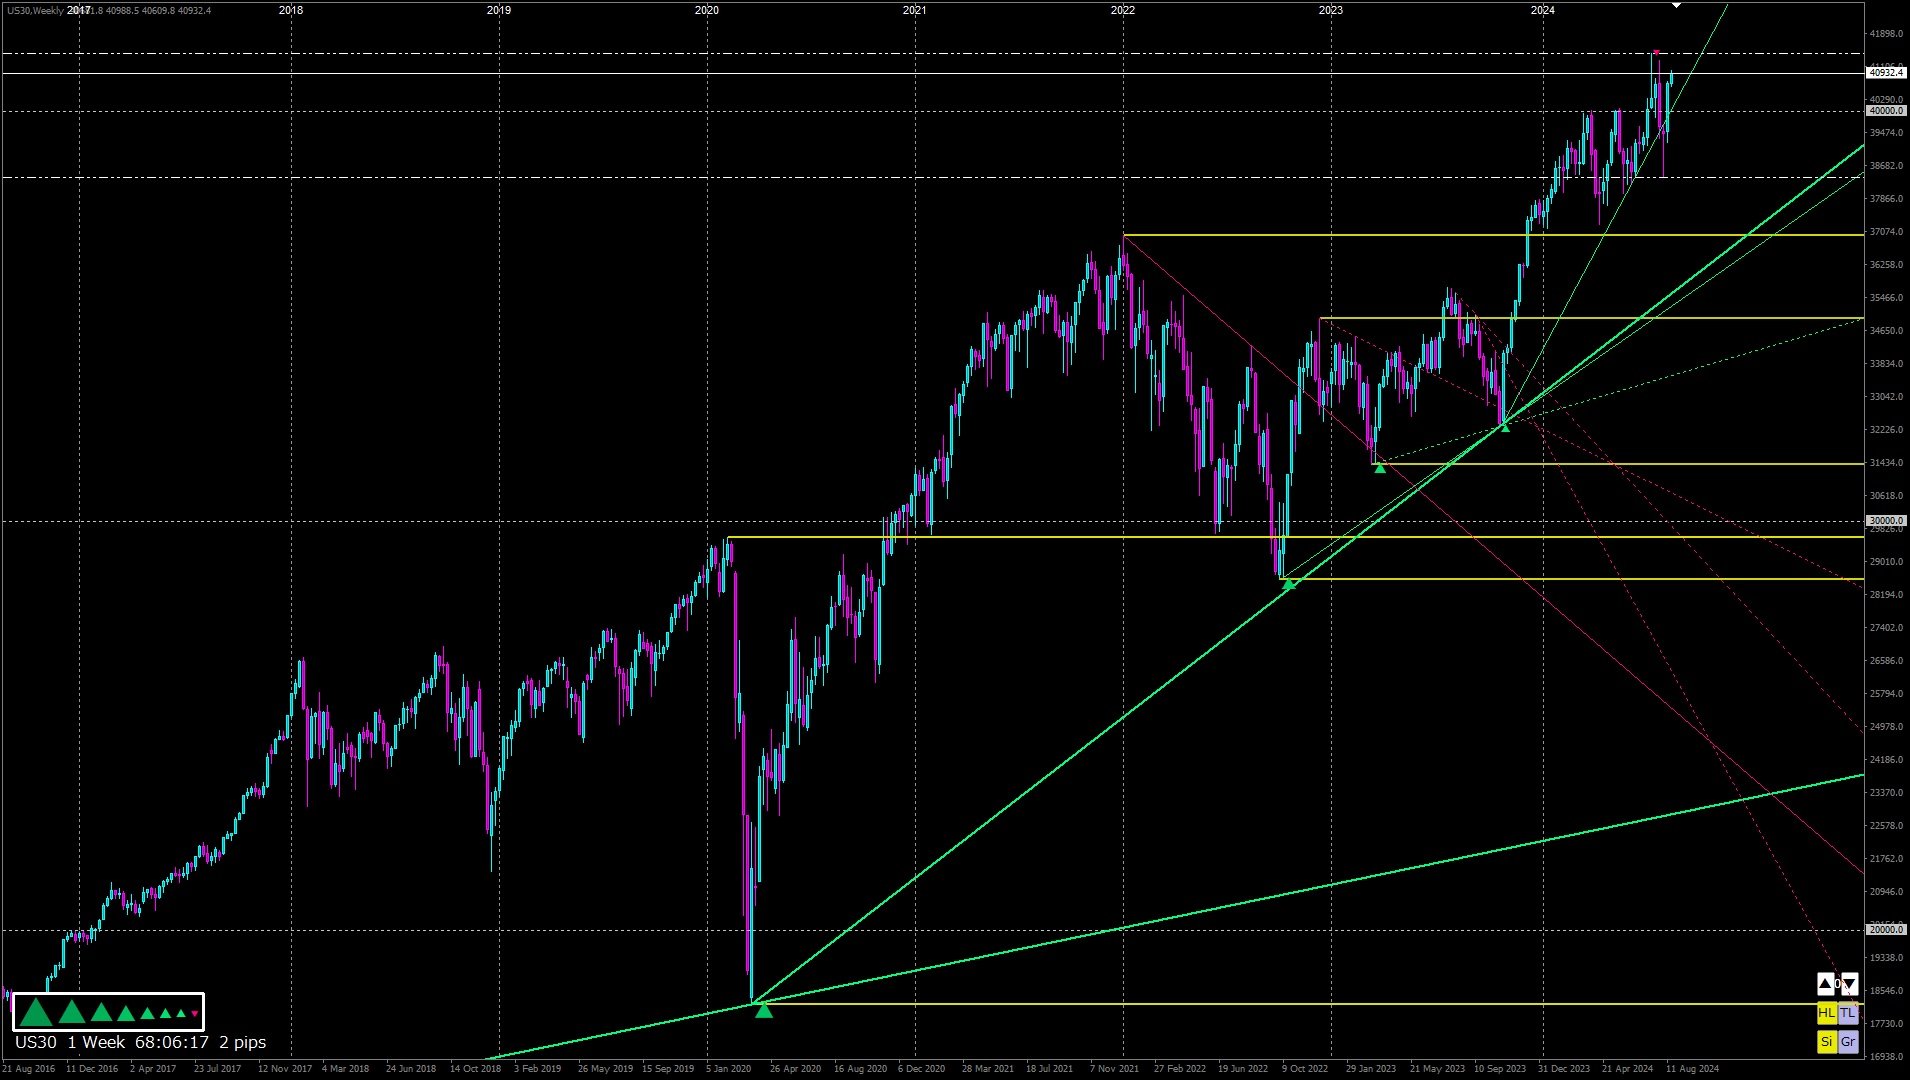
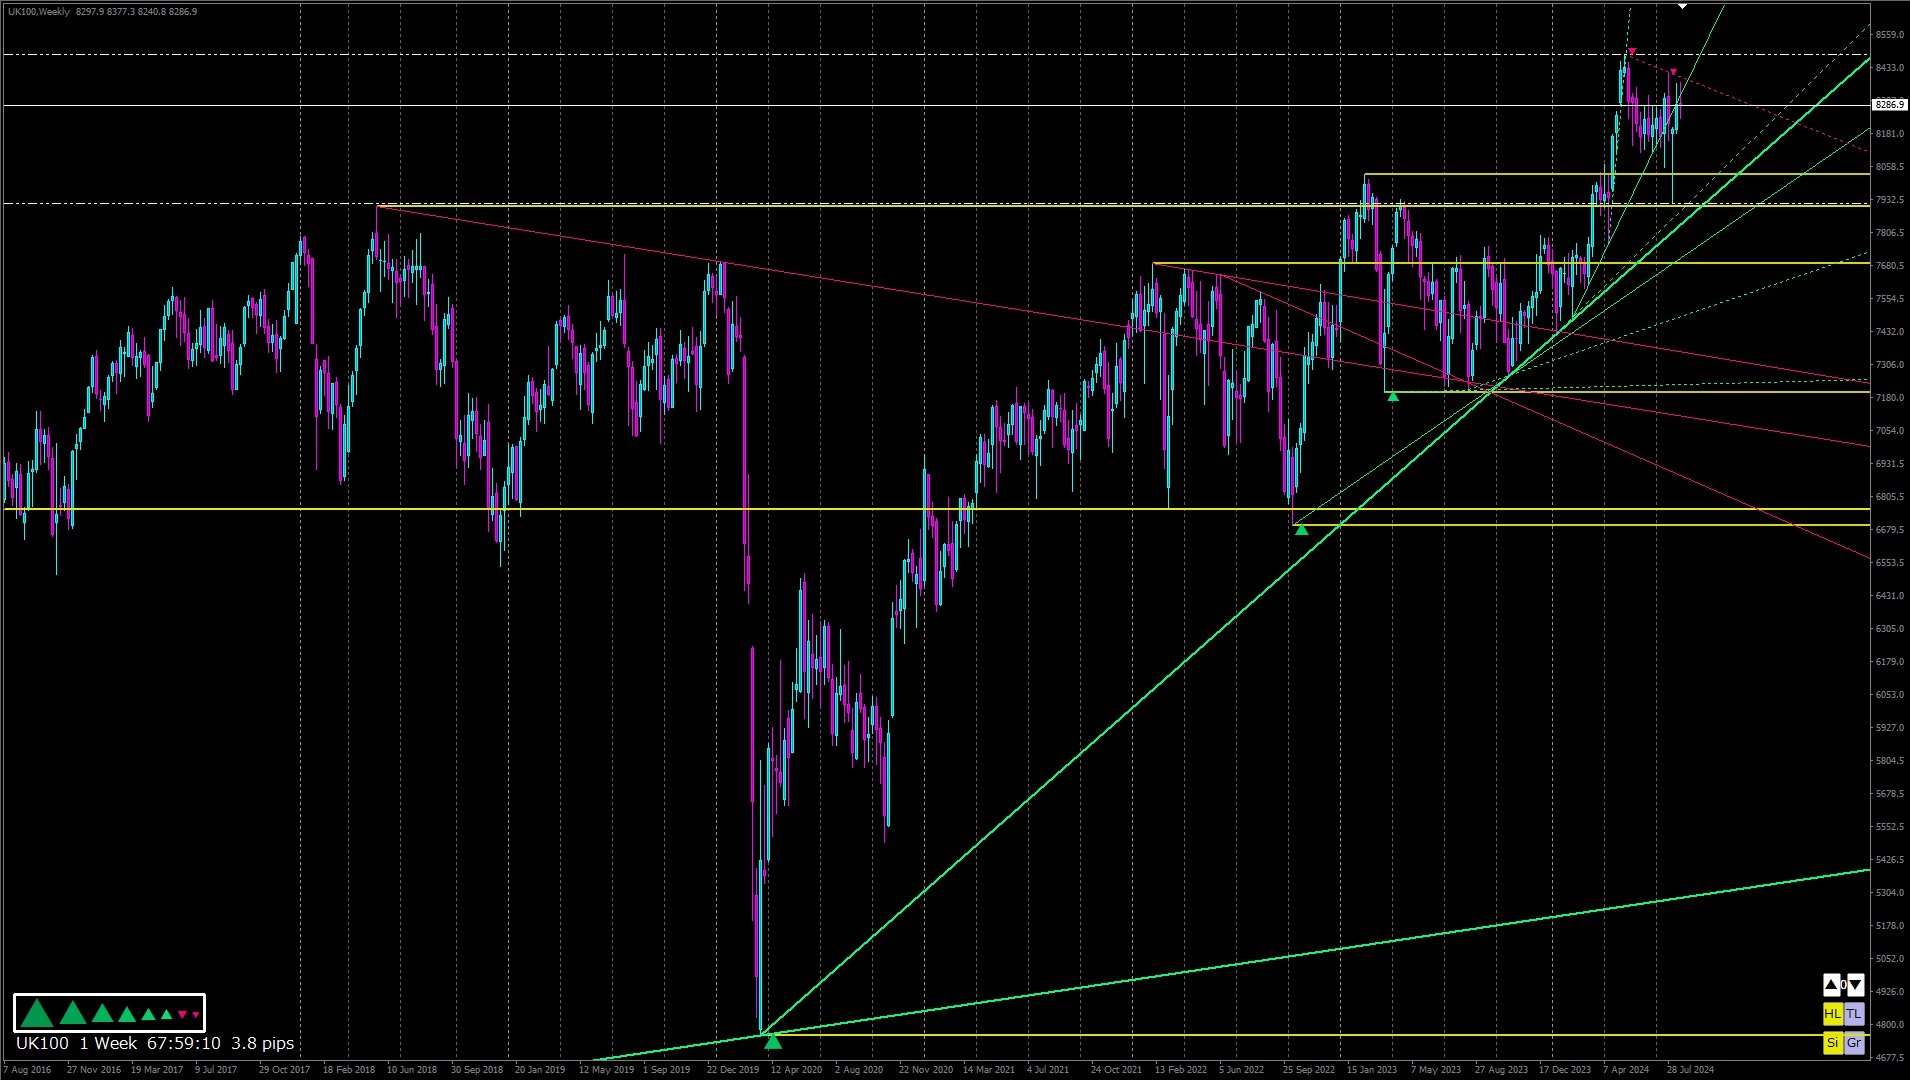
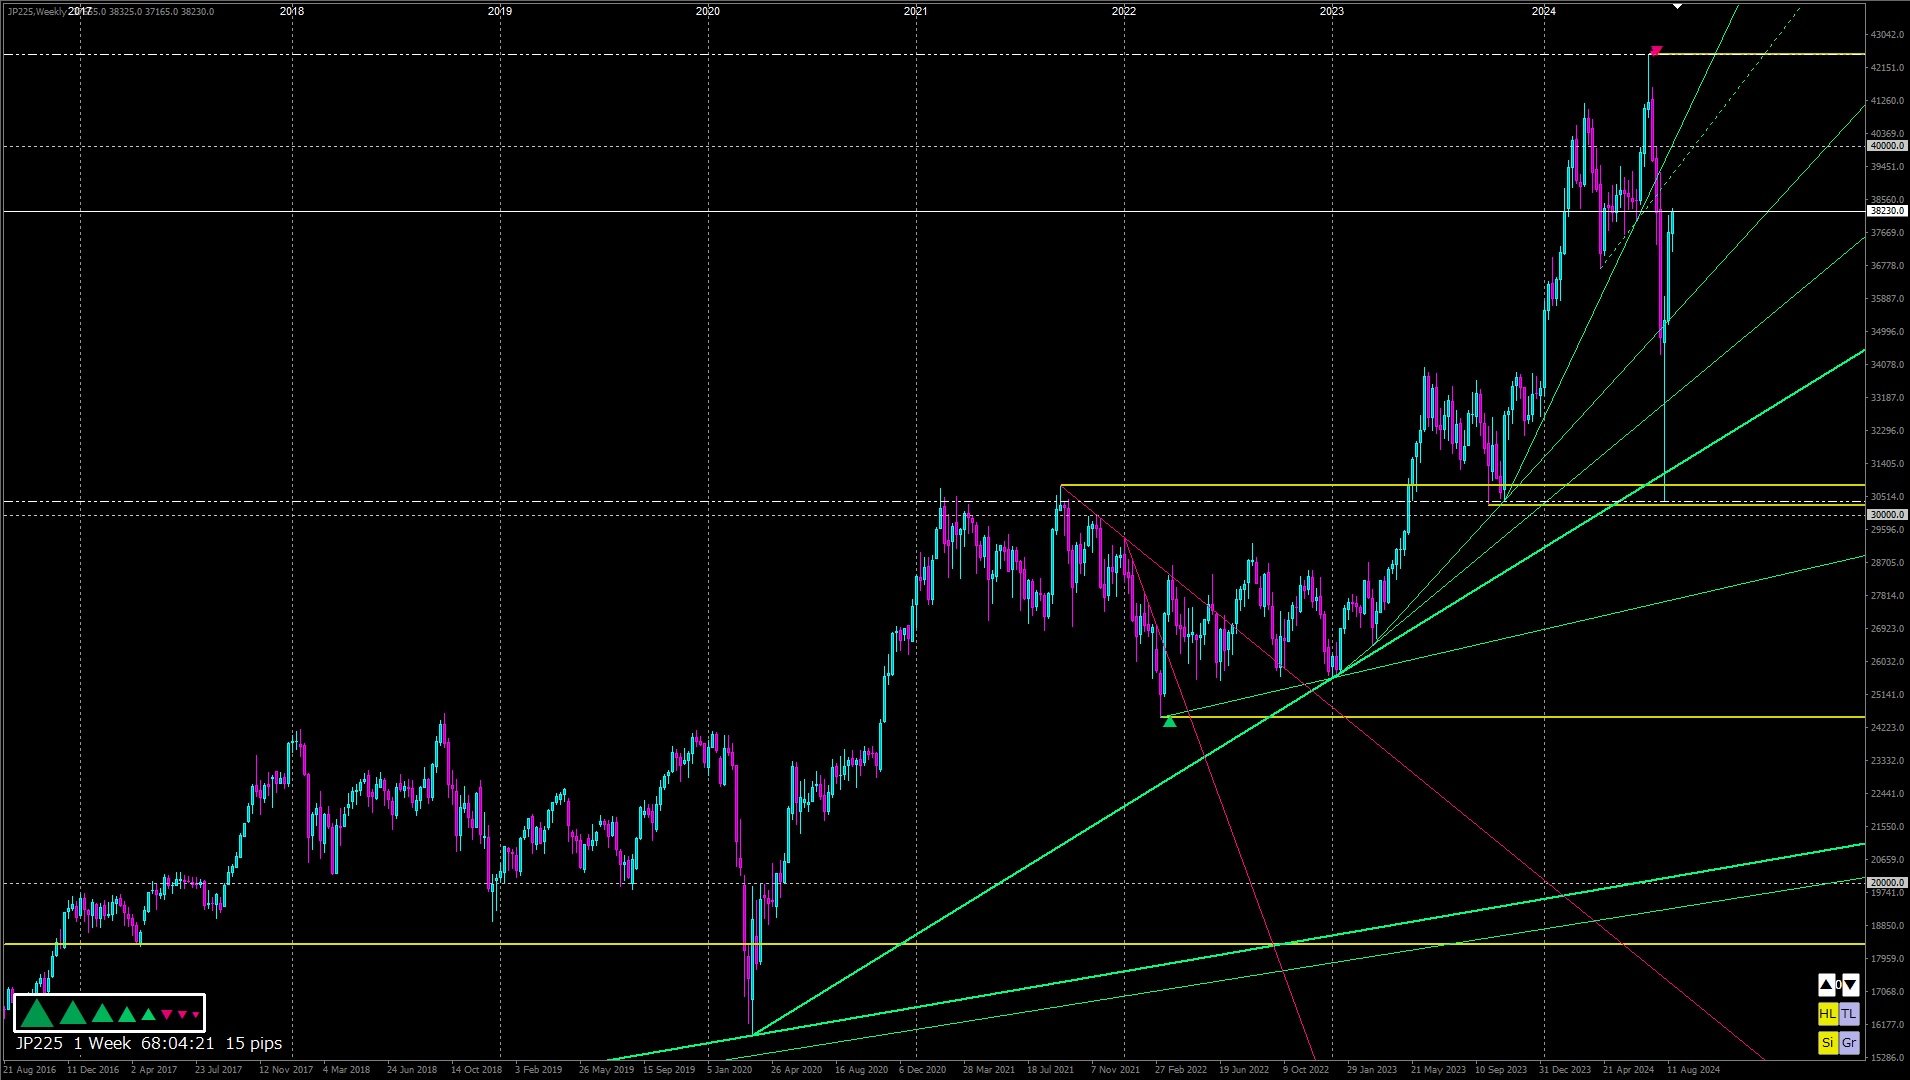
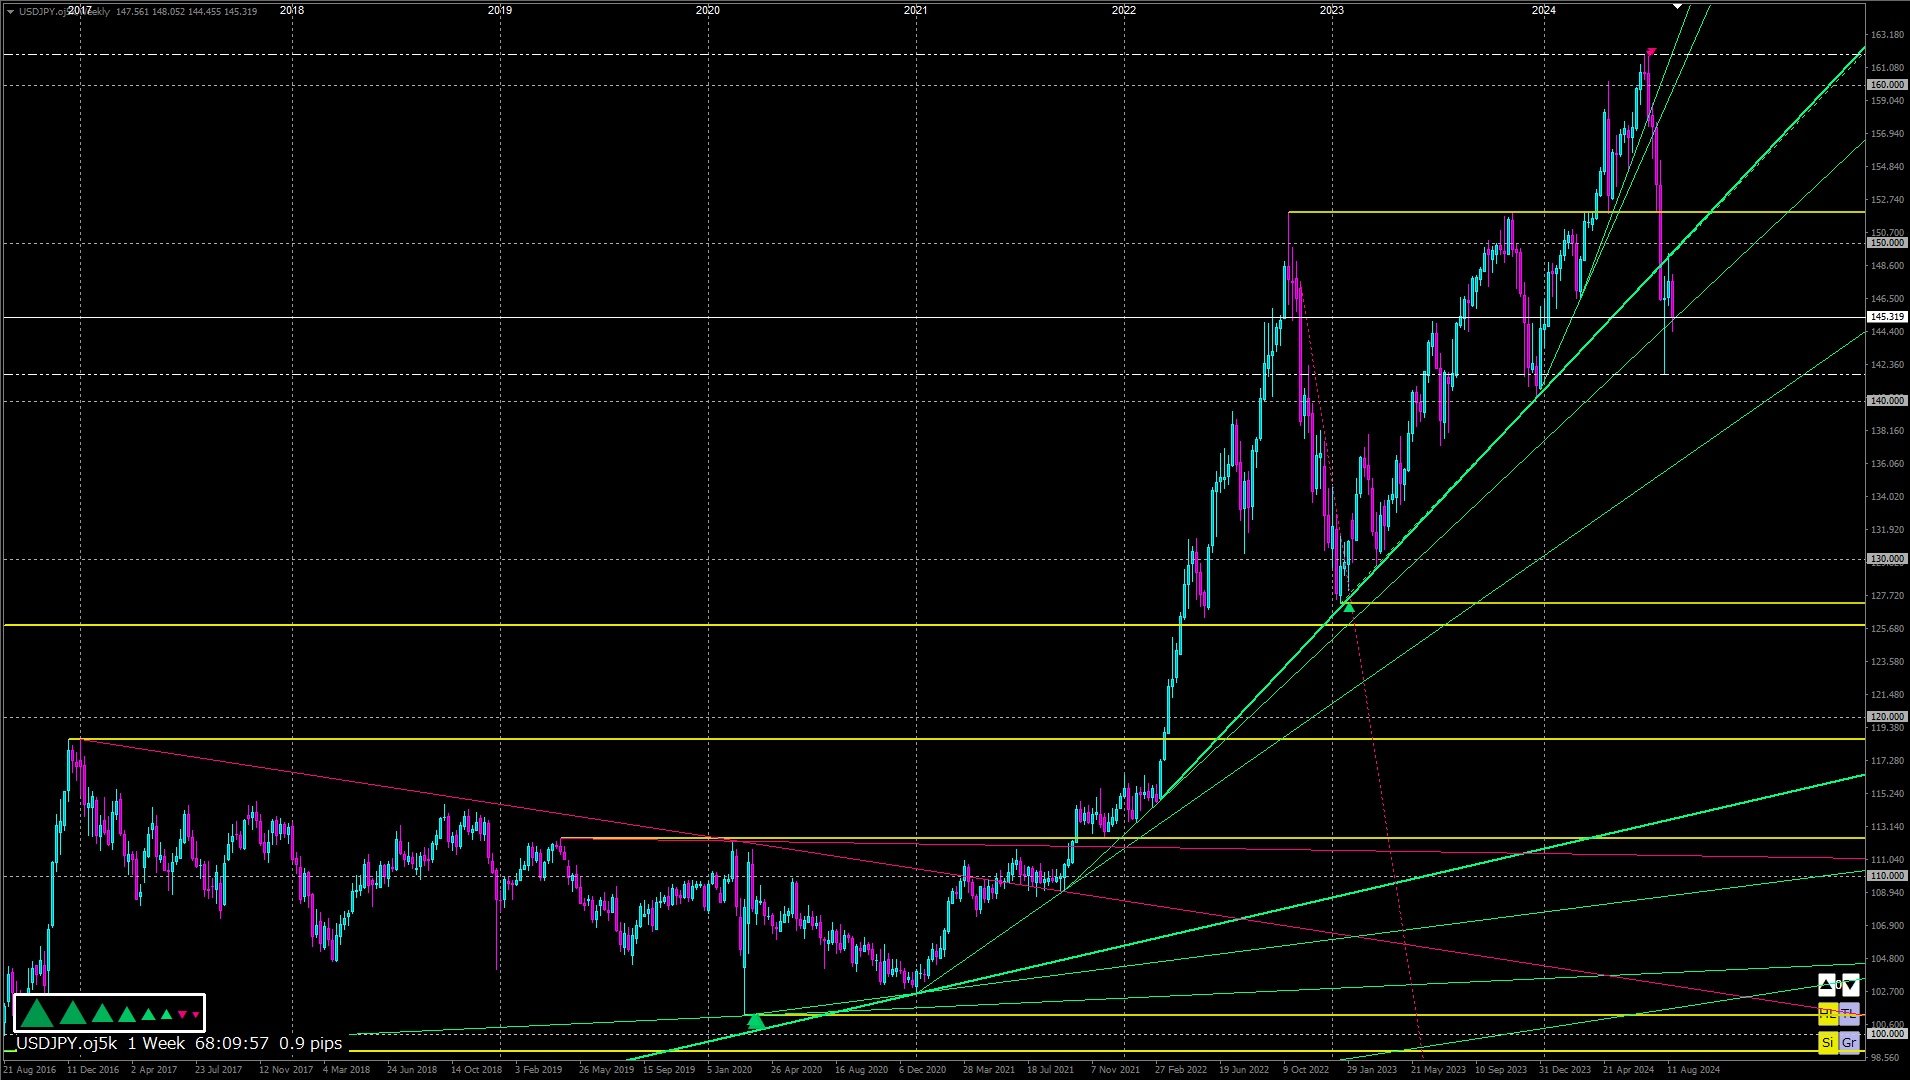
它根据道氏理论识别趋势,并自动实时绘制支撑、阻力和趋势线。
准确度非常高。
【行为检查】
在Youtube上,每个周末都会上传视频来确认行为。
【ZigZag】
基于图表形状创建的原始锯齿形,符合道氏理论。
可以从锯齿形中读取的趋势捆绑了多达八个级别,符合道氏理论。
【符号】
根据道氏理论,沿着8步锯齿形显示趋势方向。
▲ 绿色(上升趋势) ▼ 红色(下降趋势) ■ 白色(无趋势)
▲ 黄色(距离最小值 5 个或以上趋势表示上升趋势) ▼ 黄色(距离最小值 5 个或以上趋势表示下降趋势)
【线】
趋势线、支撑线和阻力线(水平线)沿基于道氏理论的八步锯齿形绘制。
各种线会自动绘制并在适当的时候删除。
如果您想手动绘制通道线,请双击线并按住 Ctrl 键移动它。
【网格】
垂直(价格)和水平(时间)轴被设计为在正确的位置分隔。
分隔符的数量可以设置为最大值,并且数量将自动相应更改。
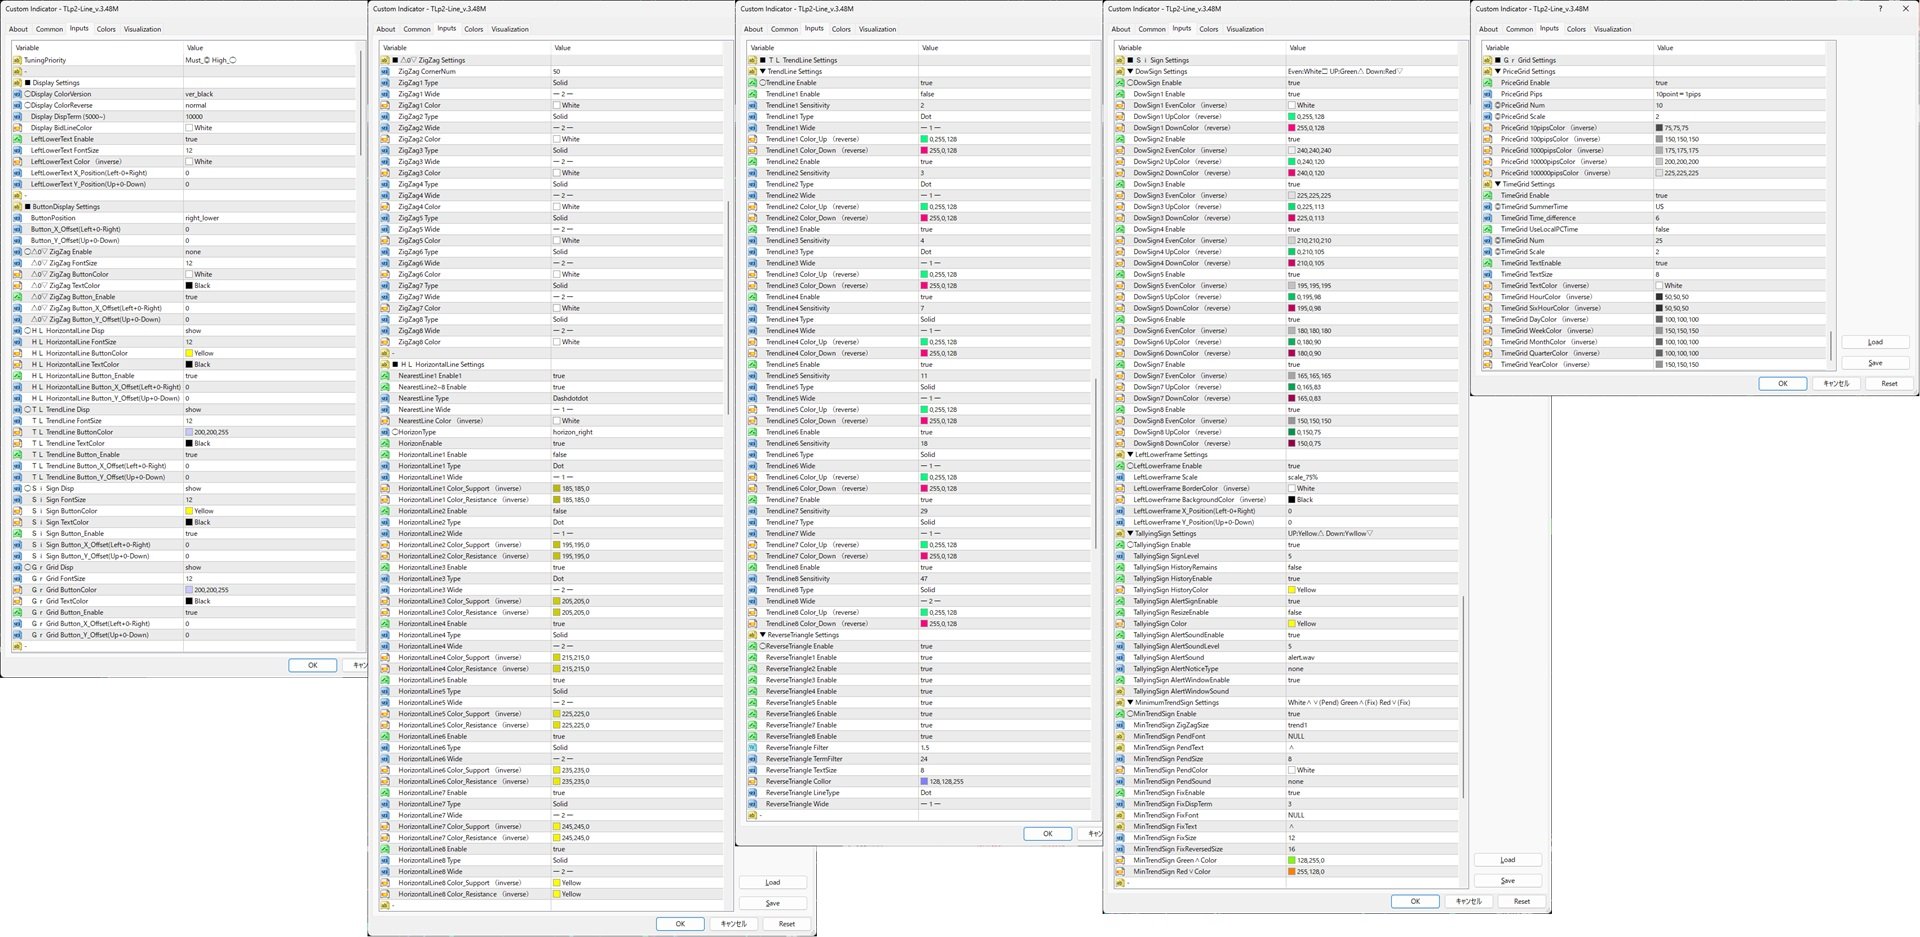
【参数】
参数说明如下。
ーーーーーーーーーーーーーーー
TuningPriority → Mark on the left side of each parameter ◎: Change required ○: Change priority
-
■ Display Settings → Item for setting the overall display.
◯Display ColorVersion → Select black if the background is black, or white if it is white. The target parameter has (inverse) next to its name.
◯Display ColorReverse → Change this if you want to invert the green for raising and the red for lowering. The target parameter has (reverse) next to its name.
Display DispTerm (5000~) → Specify the calculation range. We recommend 5000 or higher.
Display BidLineColor → Specify the color of the bid line.
LeftLowerText Enable → Show/hide the text at the bottom left of the chart
LeftLowerText FontSize → Font size of the text at the bottom left of the chart
LeftLowerText Color (inverse) → Show the text at the bottom left of the chart
LeftLowerText X_Position(Left-0+Right) → Move the text at the bottom left of the chart along the horizontal axis
LeftLowerText Y_Position(Up+0-Down) → Move the text at the bottom left of the chart along the vertical axis
-
■ ButtonDisplay Settings → Settings for the bottom right button of the chart
ButtonPosition → You can move the bottom right button of the chart to the top right
Button_X_Offset(Left+0-Right) → Move the bottom right button of the chart on the horizontal axis
Button_Y_Offset(Up+0-Down) → Move the bottom right button of the chart on the vertical axis
◯△0▽ ZigZag Enable → Display (1~8)/Hide (0) the zigzag
△0▽ ZigZag FontSize → Bottom right of the chart △0▽ Button text size
△0▽ ZigZag ButtonColor → Bottom right of the chart △0▽ Button color
△0▽ ZigZag TextColor → Bottom right of the chart △0▽ Button text color
△0▽ ZigZag Button_Enable → Bottom right of the chart △0▽ Display/hide the button
△0▽ ZigZag Button_X_Offset(Left+0-Right) → Bottom right of the chart △0▽ Move the button on the horizontal axis
△0▽ ZigZag Button_Y_Offset(Up+0-Down) → Bottom right of the chart △0▽ Move the button on the vertical axis
◯HL HorizontalLine Disp → Show/hide the horizontal line (Horizon)
HL HorizontalLine FontSize → Font size of the HL button on the bottom right of the chart
HL HorizontalLine ButtonColor → Color of the HL button on the bottom right of the chart
HL HorizontalLine TextColor → Font color of the HL button on the bottom right of the chart
HL HorizontalLine Button_Enable → Show/hide the HL button on the bottom right of the chart
HL HorizontalLine Button_X_Offset(Left+0-Right) → Move the HL button on the horizontal axis on the bottom right of the chart
HL HorizontalLine Button_Y_Offset(Up+0-Down) → Move the HL button on the vertical axis on the bottom right of the chart
◯TL TrendLine Disp → Show/hide the trend line
TL TrendLine FontSize → Font size of the TL button at the bottom right of the chart
TL TrendLine ButtonColor → Color of the TL button at the bottom right of the chart
TL TrendLine TextColor → Font color of the TL button at the bottom right of the chart
TL TrendLine Button_Enable → Display/hide the TL button at the bottom right of the chart
TL TrendLine Button_X_Offset(Left+0-Right) → Move the TL button at the bottom right of the chart along the horizontal axis
TL TrendLine Button_Y_Offset(Up+0-Down) → Move the TL button at the bottom right of the chart along the vertical axis
◯Si Sign Disp → Display/hide the sign
Si Sign FontSize → Font color of the SI button at the bottom right of the chart
Si Sign ButtonColor → Color of the SI button at the bottom right of the chart
Si Sign TextColor → Font color of the SI button at the bottom right of the chart
Si Sign Button_Enable → Display/hide the SI button at the bottom right of the chart
Si Sign Button_X_Offset(Left+0-Right) → Move the Si button at the bottom right of the chart along the horizontal axis
Si Sign Button_Y_Offset(Up+0-Down) → Move the Si button at the bottom right of the chart along the vertical axis
◯Gr Grid Disp → Show/hide the grid
Gr Grid FontSize → Font size of the Gr button at the bottom right of the chart
Gr Grid ButtonColor → Color of the Gr button at the bottom right of the chart
Gr Grid TextColor → Font color of the Gr button at the bottom right of the chart
Gr Grid Button_Enable → Show/hide the Gr button at the bottom right of the chart
Gr Grid Button_X_Offset(Left+0-Right) → Move the Gr button at the bottom right of the chart along the horizontal axis
Gr Grid Button_Y_Offset(Up+0-Down) → Move the Gr button at the bottom right of the chart along the vertical axis
-
■ △0▽ ZigZag Settings → △0▽ ZigZag Settings
ZigZag CornerNum → ZigZag display range (number of corners)
ZigZag1 Type → ZigZag1 line type
ZigZag1 Wide → ZigZag1 line thickness
ZigZag1 Color → ZigZag1 line color
ZigZag2 Type → ZigZag2…
※ The rest is the same as 1.
-
■ HL HorizontalLine Settings → HL horizontal line (Horizon) settings
NearestLine1 Enable1 → Display/hide undetermined most recent high/low line 1
NearestLine2~8 Enable → Display/hide undetermined most recent high/low line 2~8
NearestLine Type → Type of undetermined most recent high/low line
NearestLine Color (inverse) → Color of undetermined most recent high/low line
HorizonEnable → Display/hide horizontal line
HorizontalLine1 Type → Type of horizontal line 1
HorizontalLine1 Color_Support (inverse) → Color of support line of horizontal line 1
HorizontalLine1 Color_Resistance (inverse) → Color of resistance line of horizontal line 1
HorizontalLine2 Enable → Display/hide horizontal line 2…
※ The rest is the same as 1.
-
■ TL TrendLine Settings → TL Trendline Settings
▼ TrendLine Settings → Trendline Settings
◯TrendLine Enable → Show/hide trendline
TrendLine1 Enable → Show/hide trendline 1
TrendLine1 Sensitivity → Trendline 1 drawing sensitivity (thin out lines below the specified number)
TrendLine1 Type → Line type of trendline 1
TrendLine1 Wide → Line width of trendline 1
TrendLine1 Color_Up (reverse) → Color of trendline 1 rising
TrendLine1 Color_Down (reverse) → Color of trendline 1 falling
TrendLine2 Enable → Show/hide trendline 2…
※ The rest is the same as 1.
▼ ReverseTriangle Settings → Inverse triangle (broadening formation) settings
◯ReverseTriangle Enable → Show/hide inverse triangle
ReverseTriangle1 Enable → Show/hide inverse triangle 1
ReverseTriangle2 Enable → Show/hide inverse triangle 2
ReverseTriangle3 Enable → Show/hide inverse triangle 3
ReverseTriangle4 Enable → Show/hide inverse triangle 4
ReverseTriangle5 Enable → Show/hide inverse triangle 5
ReverseTriangle6 Enable → Show/hide inverse triangle 6
ReverseTriangle7 Enable → Show/hide inverse triangle 7
ReverseTriangle8 Enable → Show/hide inverse triangle 8
ReverseTriangle Filter → Angle magnification/upper limit of inverse triangle
ReverseTriangle TermFilter → Number of inverse triangles drawn/lower limit
ReverseTriangle TextSize → Font size of inverse triangle
ReverseTriangle Color → Line color of the inverted triangle
ReverseTriangle LineType → Line type of the inverted triangle
ReverseTriangle Wide → Line width of the inverted triangle
-
■ SI Sign Settings → SI Sign Settings
▼ DowSign Settings → Dow Theory Sign White□Green△Red▽ Settings
◯DowSign Enable → Show/Hide Dow Theory Sign
DowSign1 Enable → Show/Hide Dow Theory Sign 1
DowSign1 EvenColor (inverse) → Dow Theory White□ Sign 1 Color
DowSign1 UpColor (reverse) → Dow Theory Green△ Sign 1 Color
DowSign1 DownColor (reverse) → Dow Theory Red▽ Sign 1 Color
DowSign2 Enable → Dow Theory White□ Sign 2…
※ The rest is the same as 1.▼ LeftLowerFrame Settings → Setting the white border at the bottom left of the chart
◯LeftLowerFrame Enable → Show/hide the white border at the bottom left of the chart
LeftLowerFrame Scale → Display magnification of the white border at the bottom left of the chart
LeftLowerFrame BorderColor (inverse) → Border color of the white border at the bottom left of the chart
LeftLowerFrame BackgroundColor (inverse) → Background color of the white border at the bottom left of the chart
LeftLowerFrame X_Position(Left-0+Right) → Movement of the white border at the bottom left of the chart along the horizontal axis
LeftLowerFrame Y_Position(Up+0-Down) → Movement of the white border at the bottom left of the chart along the vertical axis
▼ TallyingSign Settings → Setting Yellow△Yellow▽
Yellow△Yellow▽ that responds when the orientations of 1 to 8 white□green△red▽ are aligned
When TallyingSign SignLevel = “5” (default value)
▽▽▽▲▲▲▲▲ Number of trends = 5 A state where trend directions up to number 5 are aligned with ▲
▽▽▲▲▲▲▲▲ Trend count = 6 A state where trend directions up to number 6 are aligned with ▲
▽▲▲▲▲▲▲▲ Trend count = 7 A state where trend directions up to number 7 are aligned with ▲
▲▲▲▲▲▲▲▲ Trend count = 8 A state where all 8 trend directions are aligned with ▲
⑧⑦⑥⑤④③②① Represents the larger standard ⑧ to the smaller standard ①.
▼▼▼▼▼▼▼▼ Number of trends = 8 All 8 trend directions are aligned with ▼
△▼▼▼▼▼▼▼ Number of trends = 7 Trend directions up to 7 are aligned with ▼
△△▼▼▼▼▼▼ Number of trends = 6 Trend directions up to 6 are aligned with ▼
△△△▼▼▼▼▼ Number of trends = 5 Trend directions up to 5 are aligned with ▼
◯TallyingSign Enable → Show/hide yellow△yellow▽
TallyingSign SignLevel → Number of yellow△yellow▽ trends
TallyingSign HistoryRemains → Keep/do not keep past history after yellow△yellow▽ reversal
TallyingSign HistoryEnable → Show/hide small yellow△yellow▽ (displayed each time the orientation of white□green△red▽ is aligned)
TallyingSign HistoryColor → Color of small yellow△yellow▽
TallyingSign AlertSignEnable → Show/hide large yellow△yellow▽
TallyingSign ResizeEnable → Displays additional trends when the number of large yellow △ yellow ▽ trends increases
TallyingSign Color → Color of large yellow △ yellow ▽
TallyingSign AlertSoundEnable → Enable or disable large yellow △ yellow ▽ alerts
TallyingSign AlertSoundLevel → Number of trends that trigger a large yellow △ yellow ▽ alert
TallyingSign AlertSound → Alert sound for large yellow △ yellow ▽
TallyingSign AlertNoticeType → Alert type for large yellow △ yellow ▽
TallyingSign AlertWindowEnable → Alert window for large yellow △ yellow ▽
TallyingSign AlertWindowSound → Cannot be set. MT4 sound settings take priority when the alert window is displayed.
▼ MinimumTrendSign Settings → Settings for updating the most recent high and low values White ∧∨ Green ∧ Red ∨
White ∧∨: Displayed when the most recent high and low values of the specified small trend are updated (unconfirmed)
Green ∧ Red ∨: Displayed when the most recent high and low values of the specified small trend are updated (confirmed)
◯MinTrendSign Enable → Display/hide White ∧∨ Green ∧ Red ∨
MinTrendSign ZigZagSize → Trend size of White ∧∨ Green ∧ Red ∨
MinTrendSign PendFont → Font of White ∧∨
MinTrendSign PendText → Display symbol of White ∧∨
MinTrendSign PendSize → Size of White ∧∨
MinTrendSign PendColor → Color of White ∧∨
MinTrendSign PendSound → White ∧∨ alert
MinTrendSign FixEnable → Show/hide Green ∧ Red ∨
MinTrendSign FixDispTerm → Number of Green ∧ Red ∨ displayed
MinTrendSign FixFont → Font for Green ∧ Red ∨
MinTrendSign FixText → Display symbol for Green ∧ Red ∨
MinTrendSign FixSize → Size of Green ∧ Red ∨
MinTrendSign FixReversedSize → Size of Green ∧ Red ∨ when reversed
MinTrendSign Green∧Color → Color of Green ∧
MinTrendSign Red∨Color → Color of Red ∨
-
■ Gr Grid Settings → Gr Grid Settings
▼ PriceGrid Settings → Vertical axis (price) grid settings
PriceGrid Enable → Show/hide vertical axis
PriceGrid Pips → Vertical axis magnification Corresponds to different magnifications depending on MT4
◎PriceGrid Num → Maximum number of grids on vertical axis when chart is reduced
◎PriceGrid Scale → Number of charts lined up vertically when chart is reduced (affects maximum number of grids when chart is expanded)
PriceGrid 10pipsColor (inverse) → Color of grid every 10 pips
PriceGrid 100pipsColor (inverse) → Color of grid every 100 pips
PriceGrid 1000pipsColor (inverse) → Color of grid every 1000 pips
PriceGrid 10000pipsColor (inverse) → Color of grid every 10000 pips
PriceGrid 10000pipsColor (inverse) → Color of grid every 10000 pips
PriceGrid 100000pipsColor (inverse) → Color of grid every 100000 pips
▼ TimeGrid Settings → Horizontal axis (time) grid settings
TimeGrid Enable → Show/hide horizontal axis
◎TimeGrid SummerTime → Horizontal axis server time standard (US format for all but XM)
TimeGrid Time_difference → Adjust horizontal axis time difference
TimeGrid UseLocalPCTime → Use PC time
◎TimeGrid Num → Upper limit of horizontal axis grids when the chart is reduced
◎TimeGrid Scale → Number of charts lined up vertically when the chart is reduced (Affects the number of grids when the chart is maximized.)
TimeGrid TextEnable → Show/hide date and time text on the horizontal axis
TimeGrid TextSize → Date and time text size on the horizontal axis
TimeGrid TextColor (inverse) → Date and time text color on the horizontal axis
TimeGrid HourColor (inverse) → Color of grids for every hour
TimeGrid SixHourColor (inverse) → Color of grids for every six hours
TimeGrid DayColor (inverse) → Color of grids for every day
TimeGrid WeekColor (inverse) → Weekly grid color
TimeGrid MonthColor (inverse) → Monthly grid color
TimeGrid QuarterColor (inverse) → Quarterly grid color
TimeGrid YearColor (inverse) → Yearly grid color
ーーーーーーーーーーーーーーー