SwingVolumePro
- 指标
- Thalles Nascimento De Carvalho
- 版本: 1.5
- 更新: 13 九月 2024
- 激活: 5
🎯 总览
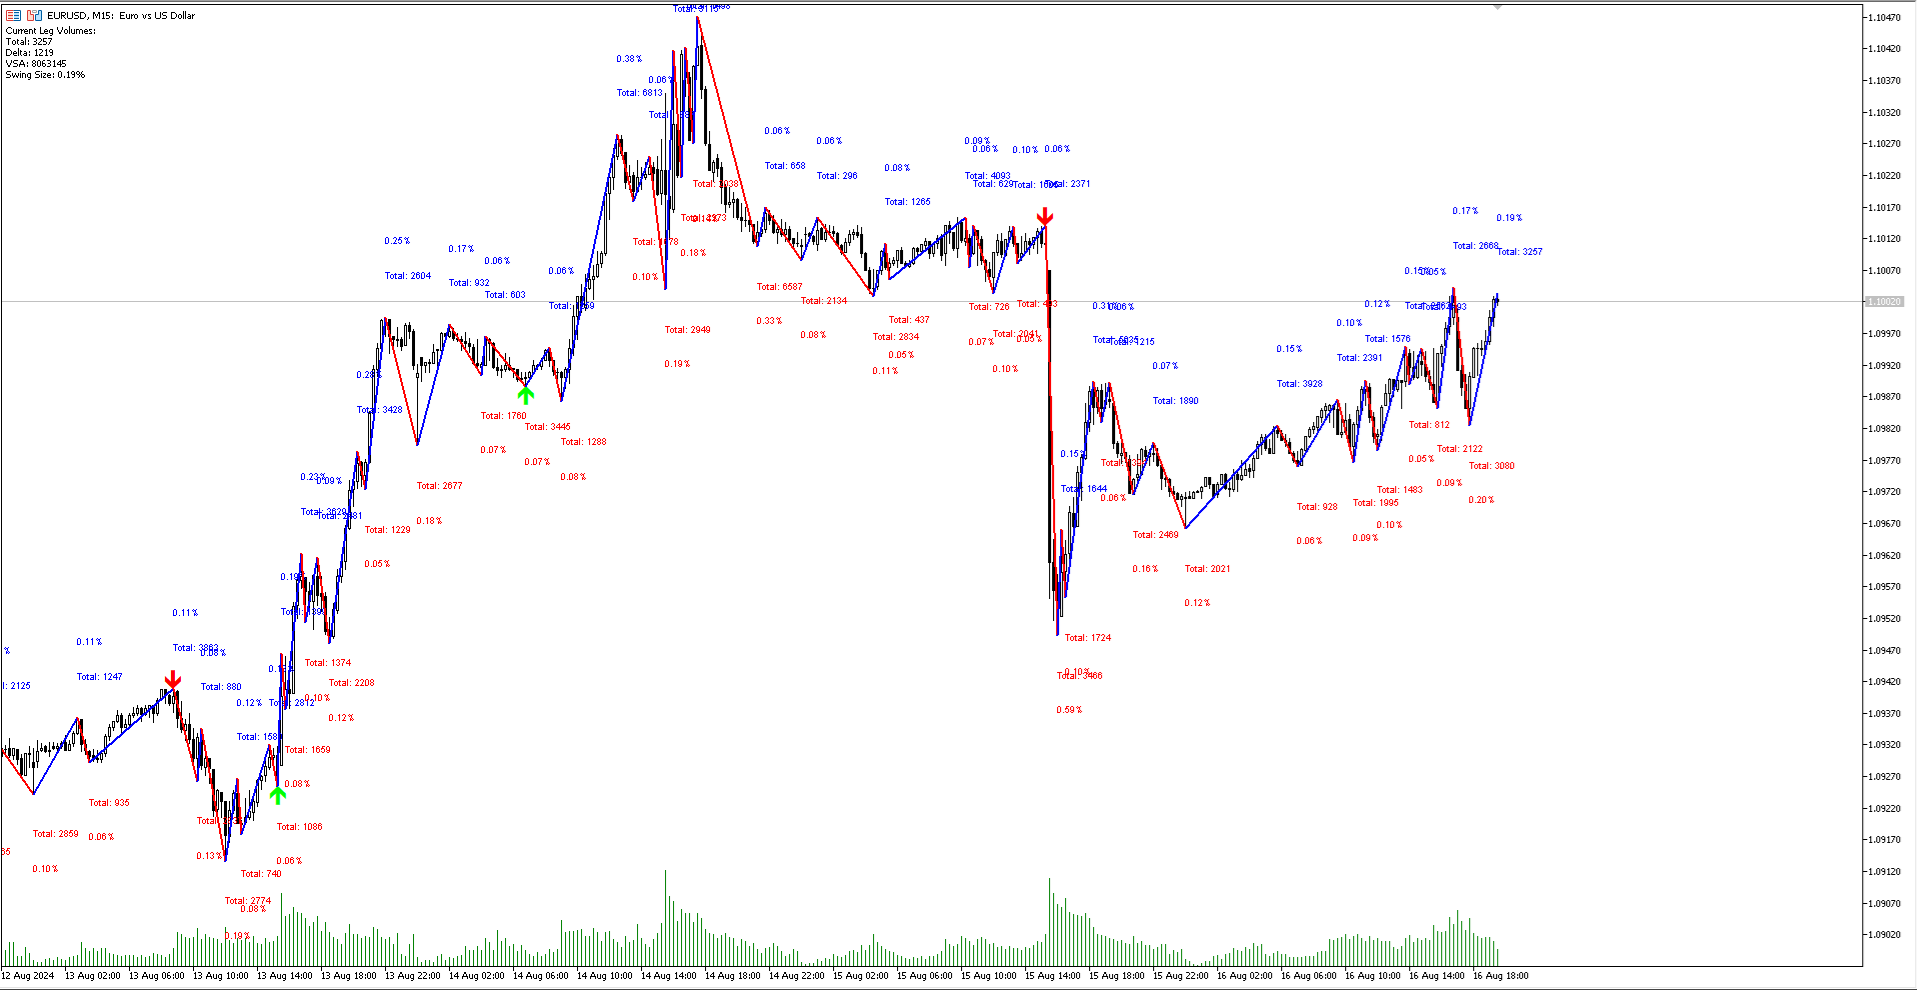
SwingVolumePro 是一个先进且多功能的指标,设计用于广泛的金融资产,并支持不同的交易风格。基于严格的成交量和价格分析开发,它提供清晰且准确的信号,使各级交易者能够根据高质量的数据做出明智的决策。
🔑 主要特点
-
🌍 多功能性: SwingVolumePro 可应用于各种资产,包括股票、外汇、加密货币等。它适用于不同的交易策略,从剥头皮到长期持有。
-
🎯 准确且可靠的信号: SwingVolumePro 侧重于提供高精度信号,采用复杂的技术识别价格吸收模式和市场攻击。这些信号以清晰的方式呈现,便于快速且有效的决策。
-
📊 先进的成交量和价格分析: 该指标通过详细分析成交量与价格之间的互动,检测出努力与结果之间的差异,提示潜在的市场动向。
-
🧩 易于解释: 借助直观且友好的界面,SwingVolumePro 生成的信号易于理解,即使是经验较少的交易者也能轻松掌握。使用箭头来指示努力与结果的关系,使信息的读取更加直接。
🤖 与EA(智能交易系统)兼容
SwingVolumePro 设计时提供了技术支持,便于创建智能交易系统(EAs),从而简化交易策略的自动化。它提供以下缓冲区,可用于智能交易系统:
- 缓冲区 0: 上箭头 📈
- 缓冲区 1: 下箭头 📉
- 缓冲区 2: 上线 ⬆️
- 缓冲区 3: 下线 ⬇️
- 缓冲区 4: 总成交量 🔄
- 缓冲区 5: 成交量差 ➕➖
- 缓冲区 6: VSA 成交量 📊
🔍 工作原理
-
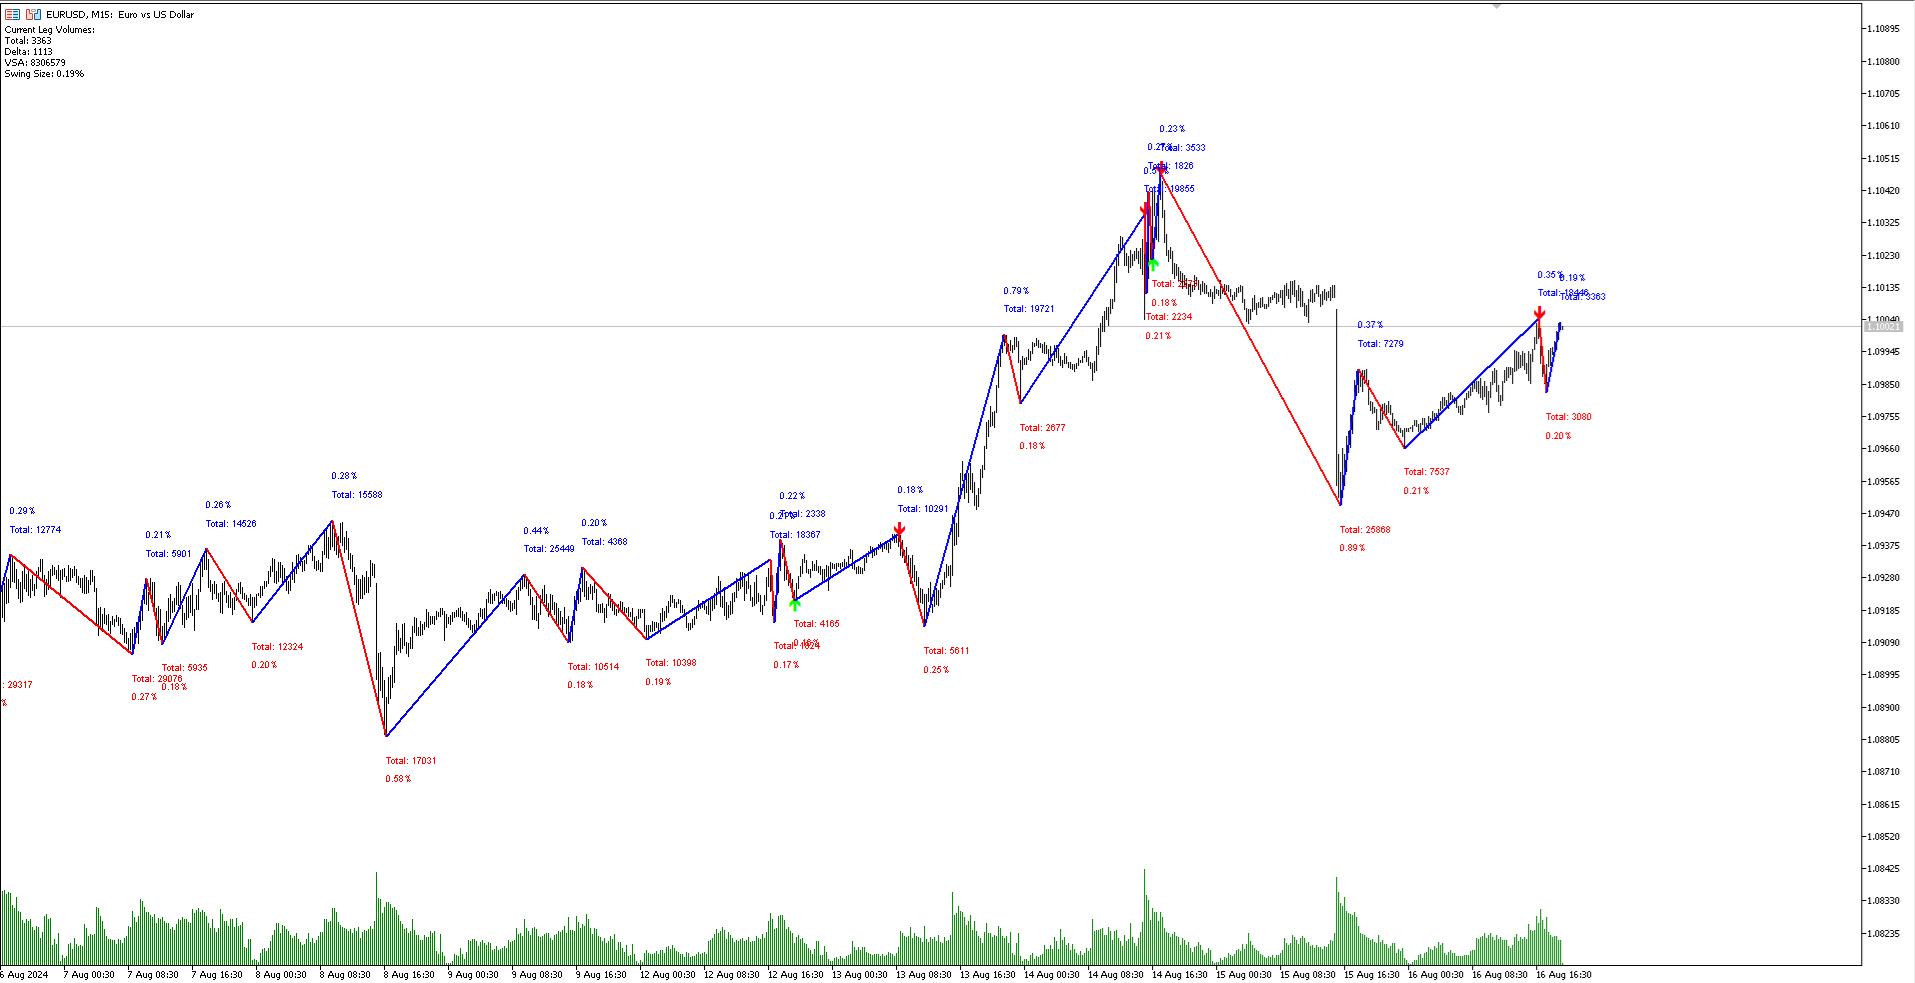
⏱️ 持续监控: SwingVolumePro 实时执行动态市场分析,识别出可能表明资产行为即将发生变化的成交量和价格模式。
-
💡 信号生成: 基于对价格吸收和市场攻击的精确分析,指标发出易于解释的信号,可应用于各种交易策略。
-
🧠 上下文分析: 除了提供信号外,SwingVolumePro 还提供市场的上下文视图,帮助交易者了解信号生成的条件,从而优化决策过程。
🏆 对交易者的好处
-
🗝️ 清晰和精确: SwingVolumePro 旨在简化市场分析,生成的信号直接且易于理解。
-
🌐 通用适用性: 无论交易何种资产,SwingVolumePro 都是一个有效的工具,能够适应不同市场的特性。
-
🔄 支持多种策略: 该指标足够灵活,可以集成到从短期到长期的各种交易策略中。
🚀 结论
SwingVolumePro 是寻求清晰、准确和高效交易操作的交易者不可或缺的工具。凭借其生成高质量技术信号的能力、与智能交易系统的兼容性,以及对成交量和价格的深入分析,它在各种市场场景中成为重要的伙伴。尝试使用 SwingVolumePro,看看它如何通过提供深入的分析和可靠的信号来提升您的交易策略。