版本 2.45
2025.04.18
🔹 Error when obtaining the fvg, it has been solved
🔹 Considerable improvement in the premium and discount zones
版本 2.40
2025.04.13
🔹 The indicator is now faster, thanks to the removal of unnecessary processes.
🔹 Improvements in CISD: they are now detected more quickly and accurately.
🔹 Clearer texts on the chart, making it easier to identify each concept.
版本 2.30
2025.03.17
🔹 Integration of a ZigZag design in the external structure to facilitate precise measurement of premium and discount price zones.
🔹 Performance optimizations in the indicator to ensure greater efficiency and accuracy in its use.
版本 2.20
2025.03.13
🔹 The premium and discount zones have been improved; now, premium and discount zones will have fewer errors or almost none.
🔹 Slight improvement in the speed of all concepts.
版本 2.10
2025.02.28
Update 2.1
🔹 Improvements in the speed of all processes.
🔹 New method added for Breaker Blocks detection.
🔹 Bug fixes in the removal of Order Blocks (OB), Breaker Blocks (BB), IFVG, Imbalance, FVG, Gap, and RDRB.
🔹 Optimization by reducing unnecessary loops.
🔹 Adjustments in Premium and Discount zones for greater accuracy.
🔹 Addition of external and internal structure.
🔹 Implementation of Mini Zig-Zag.
版本 2.1
2025.02.12
Problem solved: a problem was solved whereby if 2 bos or choch were created in the same candle, the buffers were assigned incorrectly
版本 2.0
2025.02.10
Indicator Improvements:
🔹 Optimized logic for CHoCH and BOS.
🔹 Simplified comparisons using Equals.
🔹 Reduced unnecessary loops in Order Blocks, FVG, Imbalances, Gap, RDRB, iFVG, and Breaker Blocks.
版本 1.90
2025.02.08
New Concepts and Improvements:
🔹 New method for obtaining Order Blocks based on sweeps, providing more precise identification.
🔹 Adjustment in Premium and Discount zones: they now automatically adapt to text size without modifying their height.
🔹 New concepts added:
- Breaker Blocks
- iFVG
🔹 Optimization in BOS and CHoCH:
The preliminary calculation of BOS and CHoCH is now executed in OnTimer, instead of relying on the main function, improving the speed and accuracy of the analysis.
🔹 Improved display options:
Now you can enable or disable the panel according to your preference.
Ability to hide all indicator objects without affecting buffers, ideal for use in EAs.
🔹 Increased speed and efficiency in detecting:
-Order Blocks
-FVG
-RDRB
-Imbalance
-Gap
-CHoCH
-BOS
-Swings
🔹 Bug fixes and general improvements for a more stable and precise performance.
版本 1.80
2025.01.29
Improvements and Optimization - Part 4
🔹 Faster and more precise:
The performance in detecting BOS, CHoCH, HH, LL, LH, HL, and HH has been optimized, making market structures easier and faster to identify.
🔹 New beta concept: CISD
I have integrated an experimental first version of CISD. Although it is still in beta, its logic is based on liquidity grabs followed by the breakout of the candle that initiated the move. This concept is still under development, but you can already test how it would look in action. If you are familiar with this concept or have any feedback, feel free to message me so I can improve it further.
🔹 Improvements in the ComboBox:
Now, when selecting the object ComboBox, it will be stored in a global variable instead of a common one, optimizing its functionality within sessions. (If the timeframe is changed, only the "Do Not Show Sessions" mode will work. For example, if you select "Only Show Sessions" and then change the timeframe, it will remain selected in the ComboBox, but all objects will still see)
版本 1.70
2025.01.20
Improvements and Optimization - Part 3
In this update, we have refined the final key concepts of our indicator, focusing on enhancing performance and user experience. The changes include:
-> Premium and Discount:
- The functionality of supply and demand zones has been optimized for better performance.
- Now, if the text of the Premium or Discount zones is outside its corresponding rectangle, the rectangle will automatically adjust to ensure the text remains within its boundaries.
-> BSL (Buy Side Liquidity) and SSL (Sell Side Liquidity):
- Improved the calculation method for BSL and SSL, achieving greater accuracy and faster detection.
-> Equal Highs and Equal Lows:
- Optimized the speed of detection and graphical representation of Equal Highs and Equal Lows, ensuring a smoother experience.
-> OTE (Optimal Trade Entry):
- Introduced a new section to customize OTE levels. You can now configure the colors, line styles, and other visual parameters according to your preferences.
- Additionally, we enhanced the speed at which this concept appears on the chart and optimized its overall performance.
-> Sessions:
- Fixed issues related to session rectangles. Previously, during periods of high market volatility, the rectangles were not generated correctly. Now, they always display reliably.
版本 1.60
2025.01.02
Improvements and Optimization part 2
-> Performance and speed improvements for:
-RDRB
-Imbalance
-FVG
-GAP
-> Improvements and new session visualization
版本 1.50
2024.12.19
Version: Improvements and Optimization (part 1) -We are starting to reprogram our indicator, we start with order blocks.
-Now you can choose how order blocks will be searched in addition to adding a central line in the order blocks.
-Improved speed when displaying order blocks.
版本 1.45
2024.12.10
- Version: Developers (Part 1)
-We added a new section to the configurations where parameters can be added so that the buffer values can be modified
-Change in buffers
版本 1.42
2024.12.04
-Buffer addition (HH,HL,LL,LH, etc).
版本 1.41
2024.11.07
-We added 16 buffers to store concept information.
-The control variable is no longer needed for the strategy tester.
版本 1.31
2024.10.14
-Now you can visualize the BOS and CHoCH before a high or low is formed.
版本 1.30
2024.10.11
New Section in the Panel:
Visual:
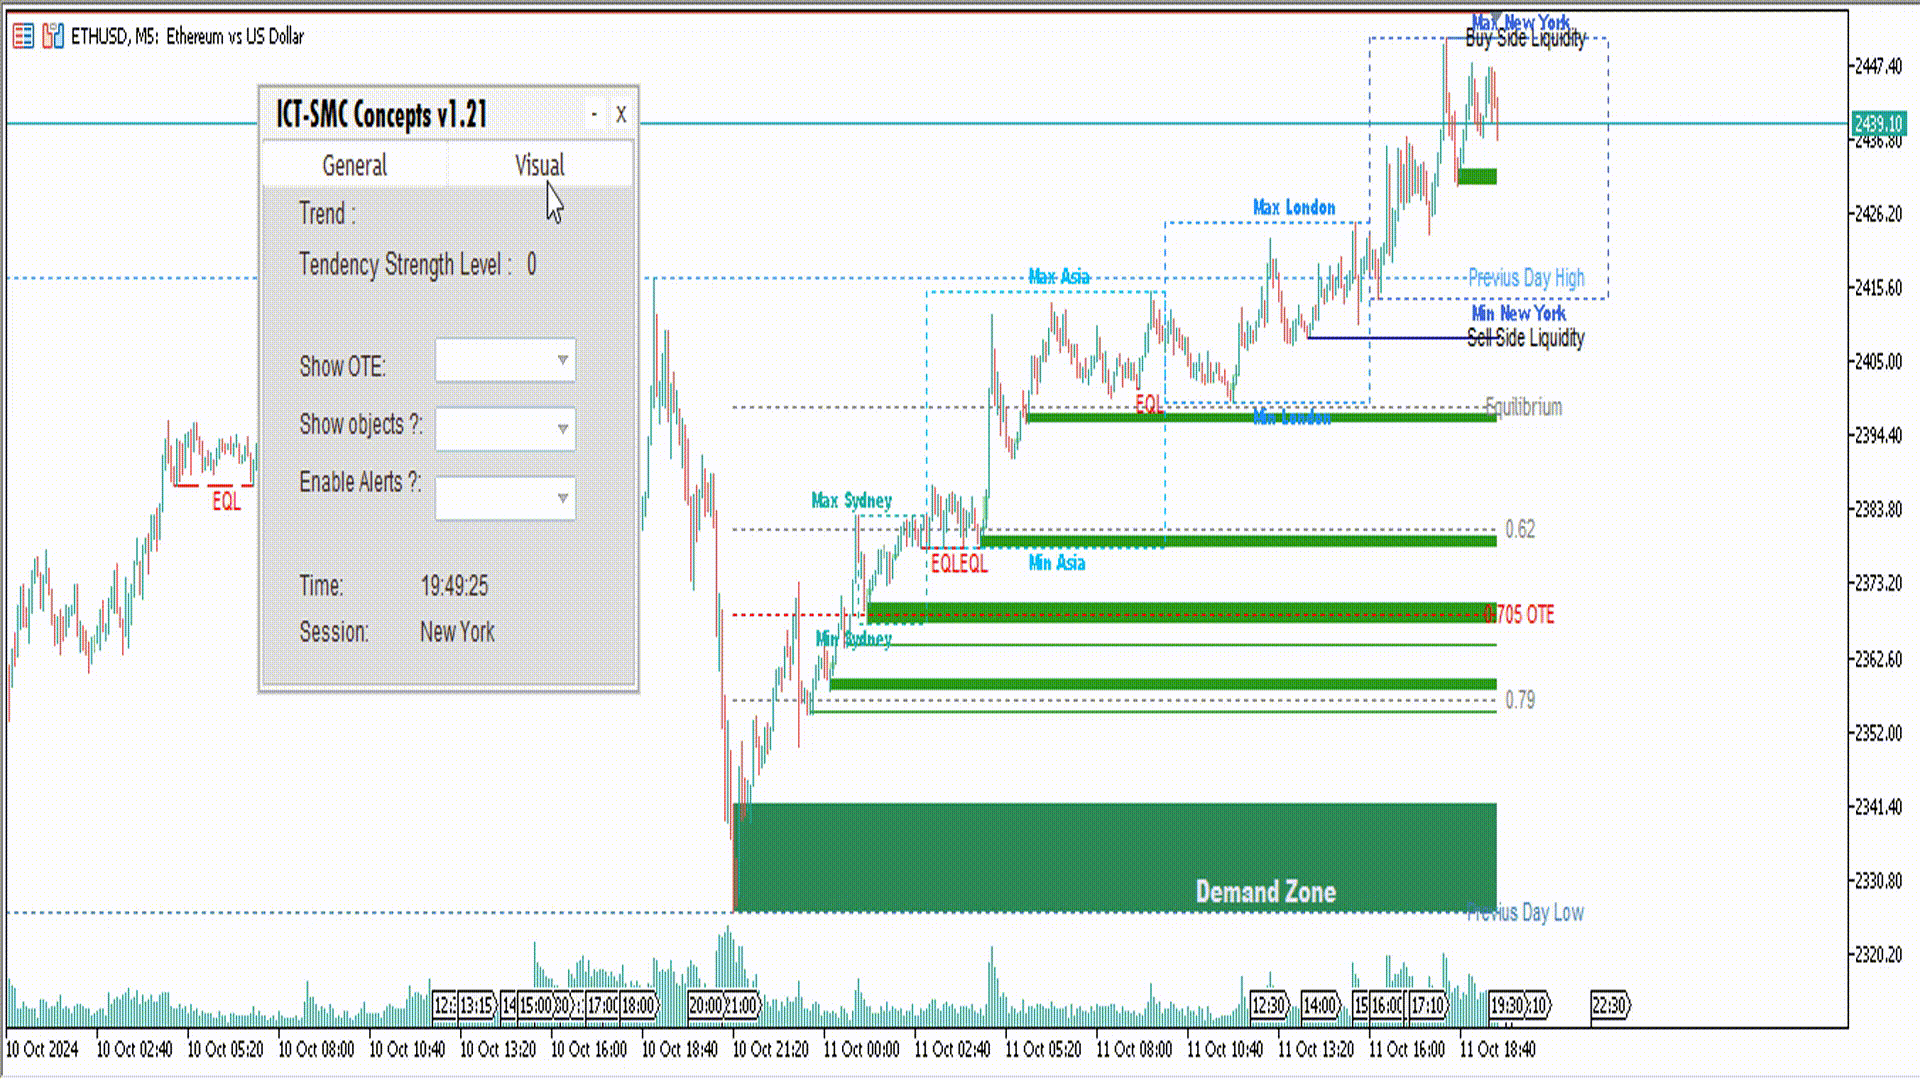
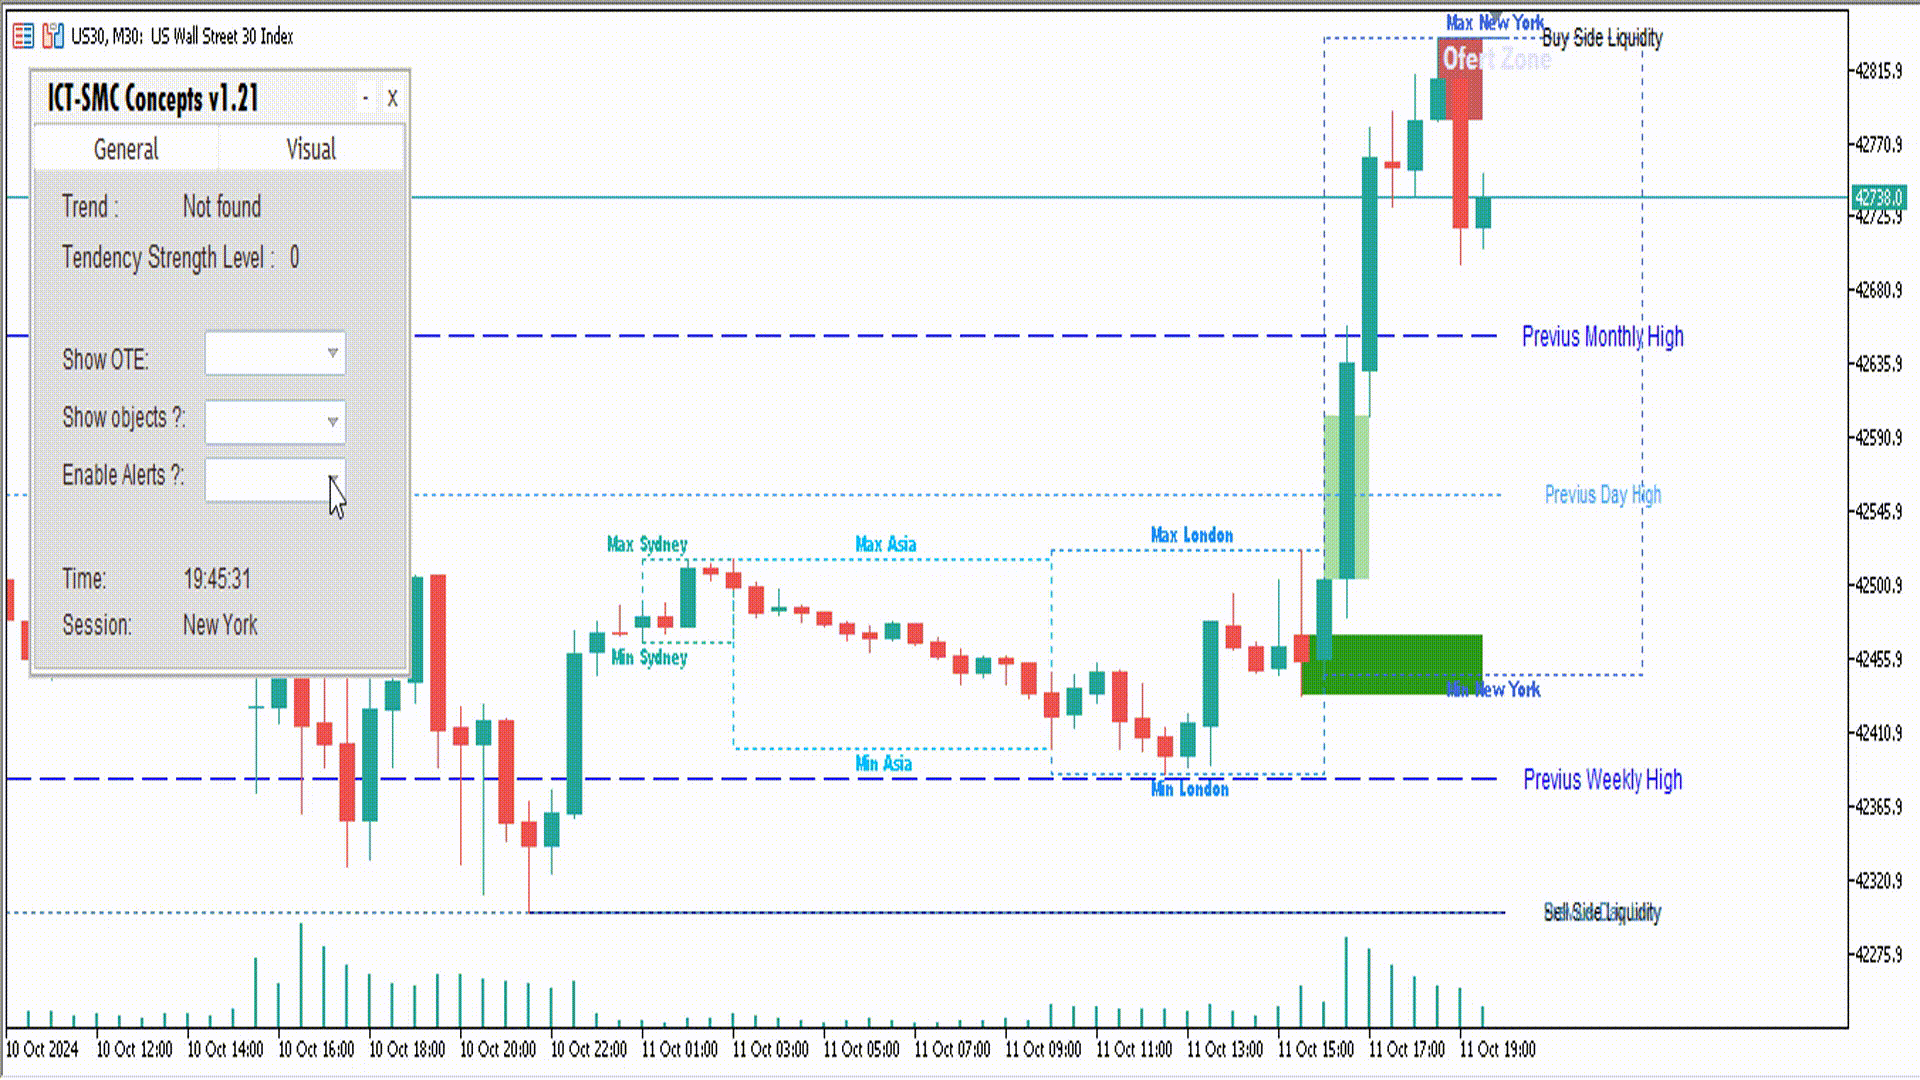
You can now view the market bias across multiple timeframes, giving you a clear insight into the trend on key timeframes.
New Concepts Integrated:
We've added more tools to enhance your market analysis:
HH (Higher High)
HL (Higher Low)
LL (Lower Low)
LH (Lower High)
Swing Highs and Swing Lows
Gaps
Imbalances
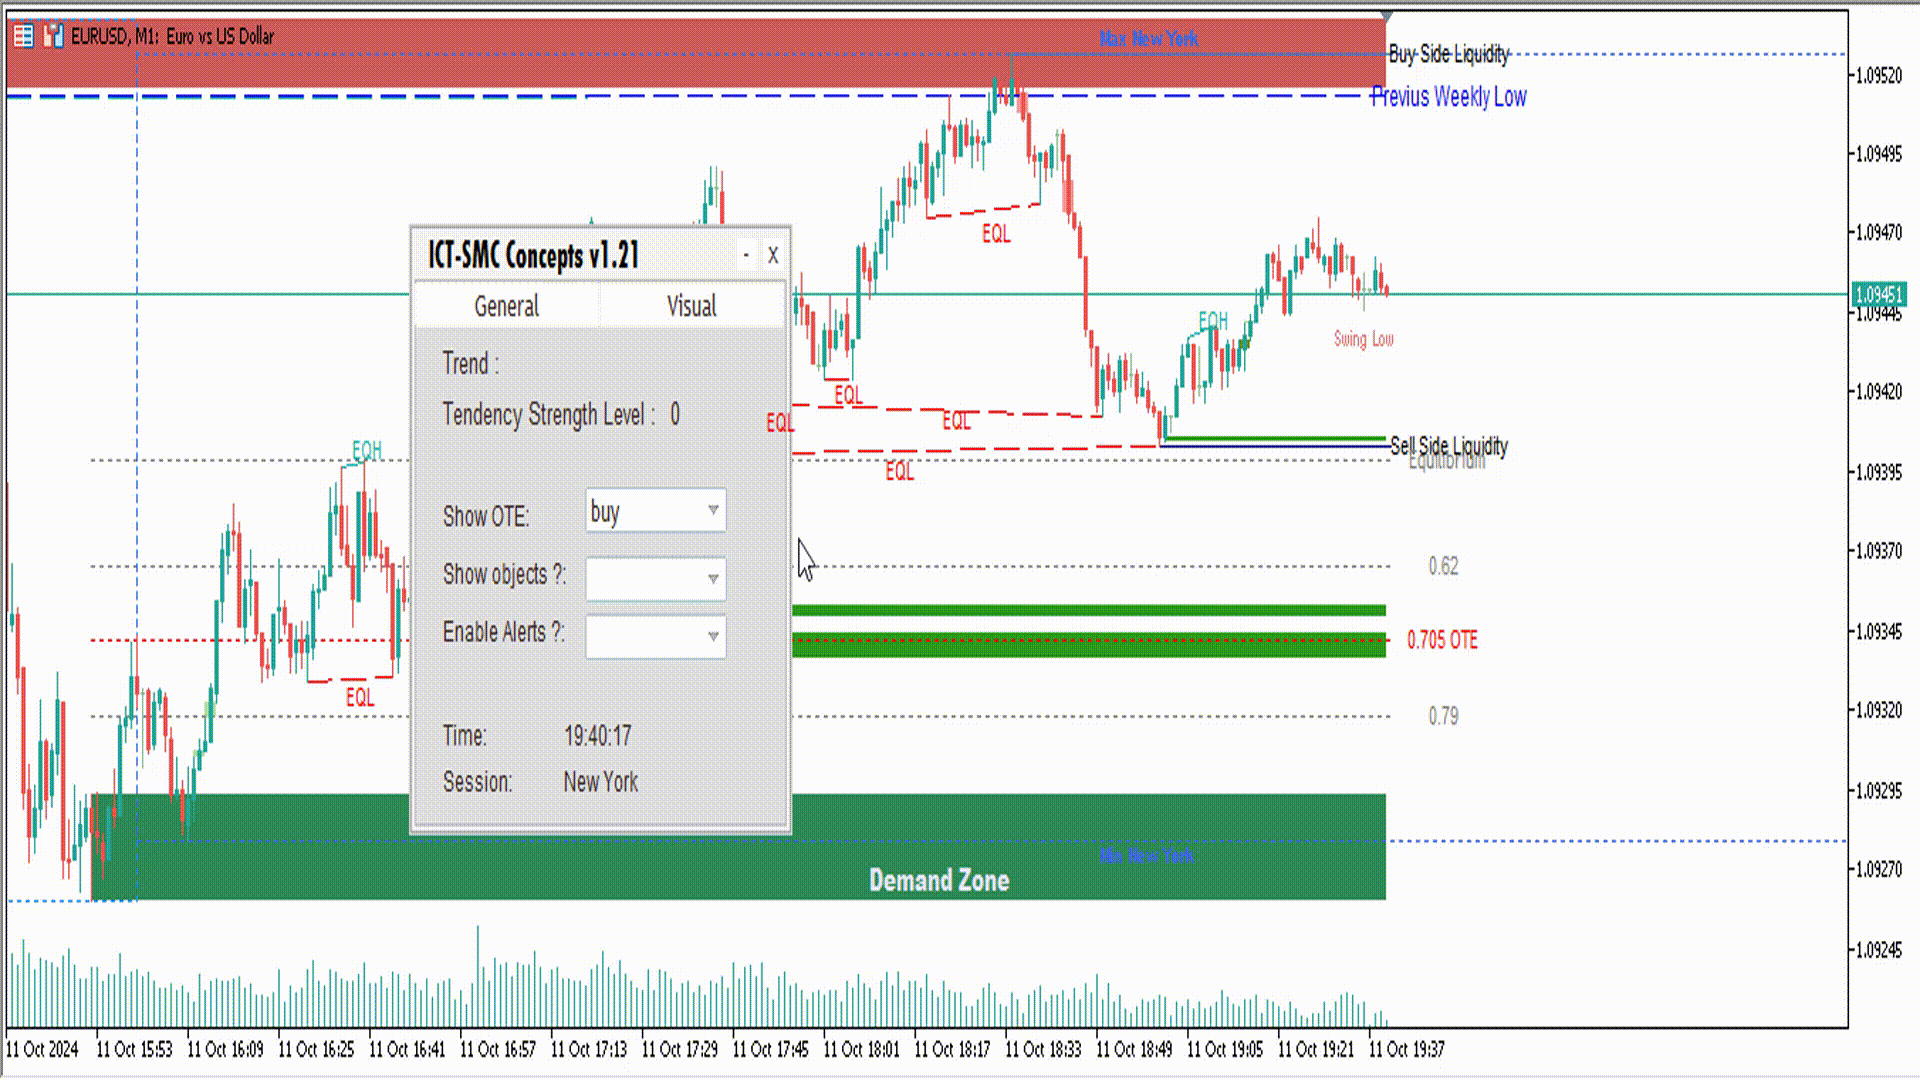
版本 1.21
2024.09.30
-Performance bug fix.
版本 1.20
2024.09.30
Version 1.2: Optimization and New Features
Improvements in Order Blocks and CHoCH/BOS Detection: Version 1.2 optimizes the indicator's performance, making it faster and more accurate in detecting Order Blocks and Change of Character (CHoCH) and Break of Structure (BOS) patterns. These enhancements provide more reliable analysis without compromising system efficiency.
Automated Scheduling with GMT 0 Time Zone: The indicator now automatically adjusts to the GMT 0 time zone, eliminating the need for manual configuration. This auto-adjustment ensures greater accuracy in tracking trading sessions.
Note: While schedules are now automated, you can still customize them if you prefer sessions to start at different times than the default settings.
New Features:
OTE (Optimal Trade Entry): Visualization of OTE for both buys and sells, allowing for deeper analysis and more optimal entry opportunities.
Equal Highs and Equal Lows: We have integrated this advanced ICT (Inner Circle Trader) concept to identify key price zones with greater precision.
Improvements to the Control Panel: You can now adjust the OTE method directly from the indicator's panel, without needing to access the settings. This allows for quick and efficient adjustments while analyzing the market.
版本 1.11
2024.09.10
Version 1.11
-Bug fixes:
-error in the trend level (corrected).
版本 1.10
2024.09.10
Version 1.1 Enhancements:
Interactive Panel:
Show Alerts: Enable real-time alerts for when the price interacts with key zones such as Order Blocks, FVGs, and RDRB areas.
Display Objects: Toggle the visibility of graphical objects on your chart, allowing you to keep your workspace organized and focused.
Session Highs and Lows:
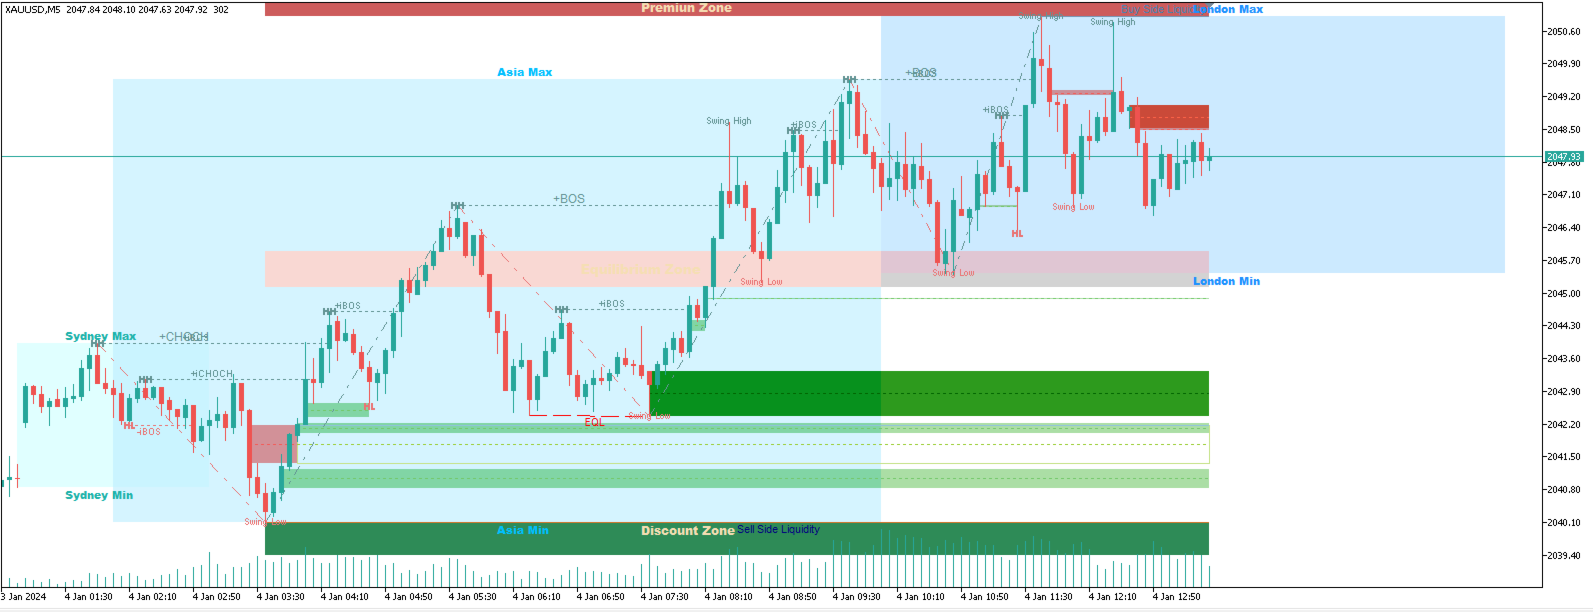
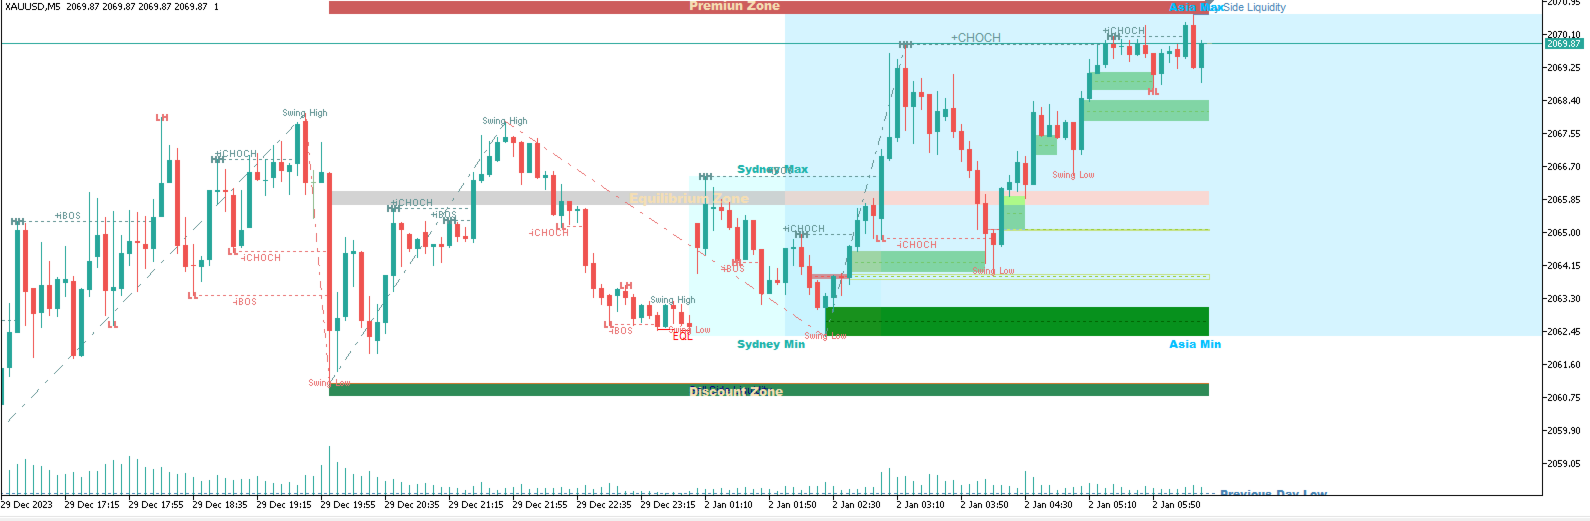
Now, you can visualize the highs and lows of trading sessions (New York, London, Asia, Sydney) through automatically drawn rectangles. This provides clearer insights into potential liquidity zones and key price levels.


This indicator is very good. It provides a comprehensive overview of the market structure and makes it easier to decide on entry and exit points. If perhaps the possibility of a multi-time frame analysis were added later - selecting a higher time frame than the main chart - this indicator would be perfect for me.