• 概述
  • 评论
  • 评论

TickChartOscillator

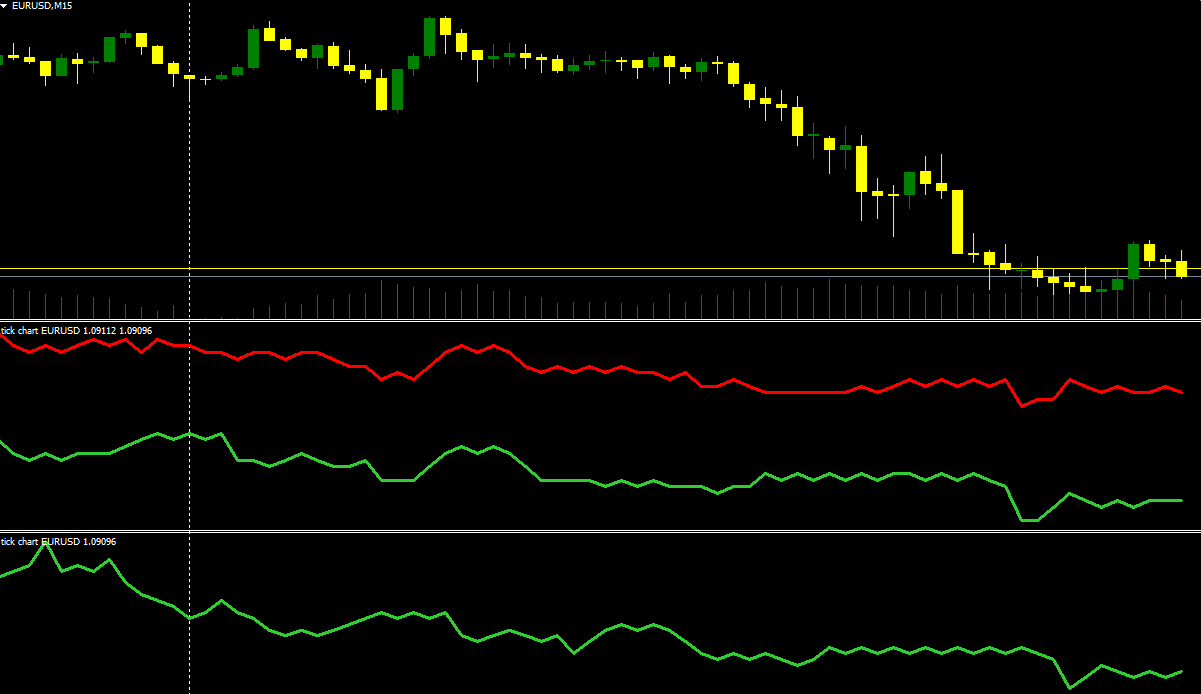
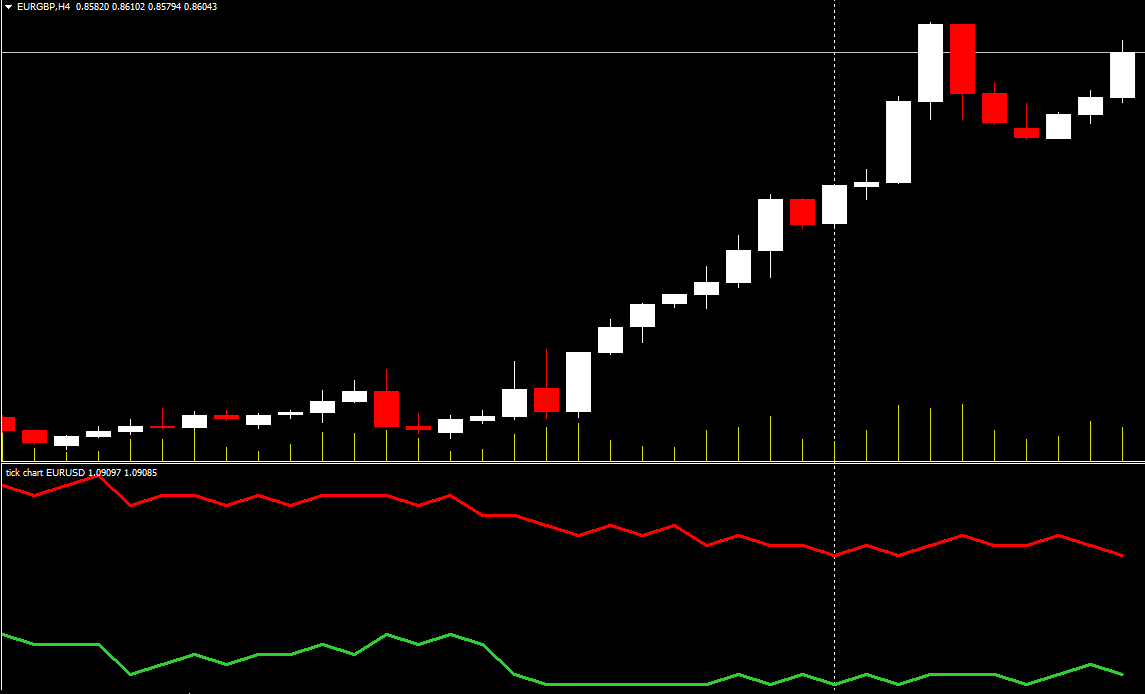
TickChartOscillator is an indicator that displays a symbol's tick chart in an oscillator subwindow. It offers flexible customization options, including:

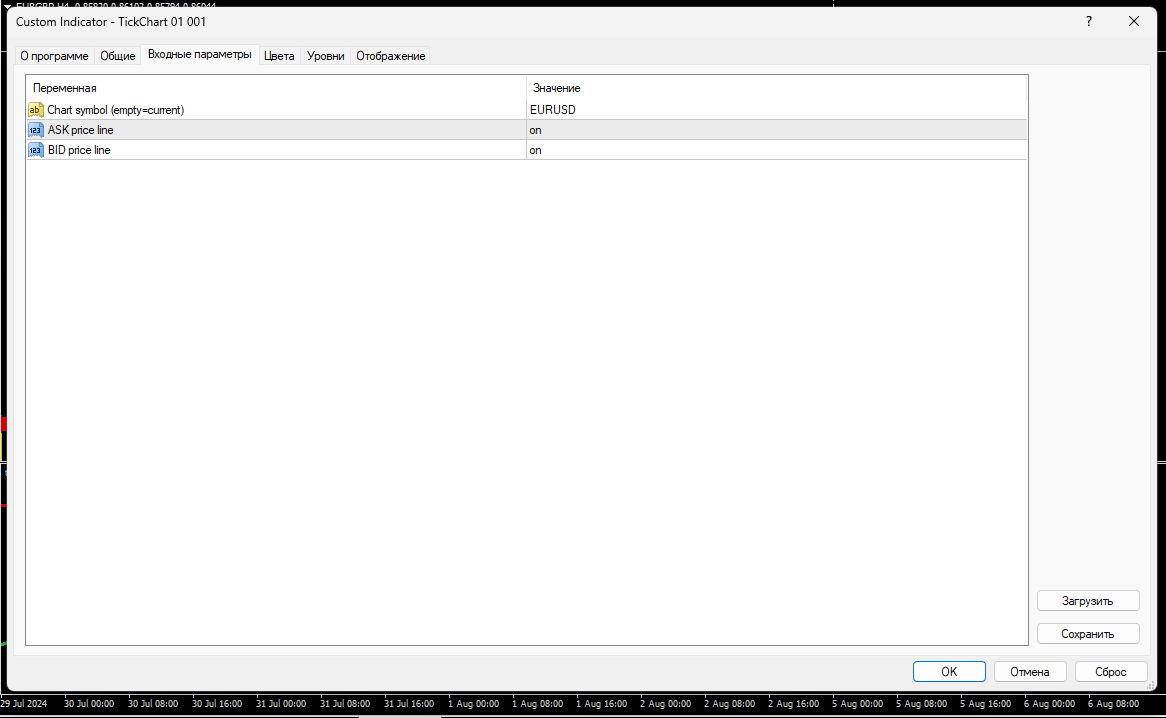
·  The ability to hide the price line in the oscillator.

·  The option to specify a different symbol for tick chart display.

If the "Symbol" parameter is left blank, the tick chart will be shown for the current symbol where the indicator is applied. This tool is perfect for traders who want to view tick dynamics in an oscillator format and use this information for analysis and trading decisions.


推荐产品
COG LR Osc AM
Andriy Matviyevs'kyy
The presented indicator allows you to determine potential entry points into the market and set protective orders at reasonable levels. This product can be useful for both beginners and experienced traders. The indicator is based on calculation methods proven by time and practicing traders. The indicator is calculated in two stages: At the first stage, linear regression (LR) of the selected price type is determined for a given number of chart periods. At the second stage, the obtained data is p
FREE
Free automatic fibonacci
Tonny Obare
4.65 (62)
Free automatic Fibonacci is an indicator that automatically plots a Fibonacci retracement based on the number of bars you select on the BarsToScan setting in the indicator. The Fibonacci is automatically updated in real time as new highest and lowest values appears amongst the selected bars. You can select which level values to be displayed in the indicator settings. You can also select the color of the levels thus enabling the trader to be able to attach the indicator several times with differe
FREE
This indicator will mirror the assets in use in another metatrader, being able to choose the timeframe and a template. This is the Metatrader 4 Client, it needs the Metatrader 4 or 5 Server versions: Metatrader 4 Mirror Chart Server: https://www.mql5.com/en/market/product/88644 Metatrader 5 Mirror Chart Server:   https://www.mql5.com/en/market/product/88652 Details of how it works in the video.
FREE
The indicator displays price distribution on a horizontal histogram. Horizontal histogram help find out key levels of price so that you can make good decision on setting point of take profit, stop loss... You can improve exist trading strategy or get new trading idea with the histogram of price. Outstanding features Support multiple time frame : you can choose to work with history data in any time frame you want. It does not depend on current display time frame. Support weighting by volume a
FREE
Easy Pips Maker
Andrei Gerasimenko
4.29 (7)
The recommended timeframe is H1! The indicator has two kinds of signal. This is a signal to open a position from the appearance of an arrow. The price leaves the channel In the first case, the indicator builds arrows based on the constructed channel and Bollinger Bands years. In another case, the trader can trade if the price just went beyond the channel. If the price is higher than the channel - we sell. If the price is lower than the channel, then you can look for a place to buy. It ca
FREE
Show Pips
Roman Podpora
4.31 (70)
This information indicator will be useful for those who always want to be aware of the current situation on the account. The indicator displays data such as profit in points, percentage and currency, as well as the spread for the current pair and the time until the bar closes on the current timeframe. VERSION MT5 - More useful indicators There are several options for placing the information line on the chart: 1. To the right of the price (runs behind the price); 2. As a comment (in the up
FREE
StrikePin
Mike Pascal Plavonil
1 (1)
The StrikePin indicator is a technical, analytical tool designed to identify trend reversals and find optimal market entries.  The StrikePin indicator is based on the pin bar pattern, which is the Price Action reversal pattern. An entry signal, in a trending market, can offer a very high-probability entry and a good risk to reward scenario. Be careful: the indicator is repainting since it is looking for highest high and lowest lows.  You should avoid to use it in experts but you can use it
FREE
Wise Men Indicator demo
Bohdan Kasyanenko
3.67 (3)
The indicator displays signals according to the strategy of Bill Williams on the chart. Demo version of the indicator has the same features as the paid, except that it can work only on a demo account . Signal "First Wise Man" is formed when there is a divergent bar with angulation.  Bullish divergent bar - with lower minimum and closing price in the upper half. Bearish divergent bar - higher maximum and the closing price at the bottom half. Angulation is formed when all three lines of Alligat
FREE
RSX Signal 2 AM
Andriy Matviyevs'kyy
The indicator displays the signals of the RSX oscillator on the price chart. (To display these signals in a separate window, along with the oscillator, another indicator is used -  RSX Osc 4 AM ). It is optimal to use the indicator signals as signals to open a trade when the price overcomes the maximum or minimum of the bar at which the signal was given. An opposite signal cancels the previous signal. Settings: Data period for indicator calculation - data period for indicator calculation; Data
FREE
TrendPlus
Sivakumar Subbaiya
4.21 (14)
Trend Plus   Trendplus  Indicator   Time Frame: Suitable for any time frame.  Purpose: Trend Prediction. Blue and red candle indicate the buy and sell call respectively. Buy: When the blue candle is formed buy call is initiated. close the buy trades when the next red candle will formed.   Sell: When the Red candle is formed Sell call is initiated. close the Sell trades when the next blue candle will formed.   Happy trade!!
FREE
Follow The Line
Oliver Gideon Amofa Appiah
4.07 (14)
FOLLOW THE LINE GET THE FULL VERSION HERE: https://www.mql5.com/en/market/product/36024 This indicator obeys the popular maxim that: "THE TREND IS YOUR FRIEND" It paints a GREEN line for BUY and also paints a RED line for SELL.  It gives alarms and alerts of all kinds. IT DOES NOT REPAINT and can be used for all currency pairs and timeframes. Yes, as easy and simple as that. Even a newbie can use it to make great and reliable trades. NB: For best results, get my other premium indicators for more
FREE
Extremum Reverse Bar
Yurij Izyumov
3.55 (11)
This indicator has been created for finding the probable reversal points of the symbol price. A small candlestick reversal pattern is used it its operation in conjunction with a filter of extremums. The indicator is not redrawn! If the extremum filter is disabled, the indicator shows all points that have a pattern. If the extremum filter is enabled, the condition works – if the history Previous bars 1 candles back contains higher candles and they are farther than the Previous bars 2 candle, such
FREE
High Low Open Close MT4
Alexandre Borela
4.82 (22)
如果你象这个项目一样,就有5个饥饿审查。 塔克的后续工作: borelatech 这项指标采用了既定价格的公开、高、低价和关闭价格 可以对特定时间区加以调整。 许多机构和专业人士都认为这些是重要的。 贸易商可以为你了解他们可能更进一步的地点, 积极。 现有期间为: 前一日。 前一星期。 曾任Month。 曾任。 前一年。 或: 目前日。 目前周。 目前 Month。 目前配额。 今年。
FREE
The Analytical cover trend indicator is a revolutionary trend trading and filtering solution with all the important features of a trend tool built into one tool! The Analytical cover indicator is good for any trader, suitable for any trader for both forex and binary options. You don’t need to configure anything, everything is perfected by time and experience, it works great during a flat and in a trend. The Analytical cover trend indicator is a tool for technical analysis of financial markets
Donchian Trend Histogram
Mariusz Piotr Rodacki
Donchian channels are a tool in technical analysis used to determine the relative volatility of a market and the potential for price breakouts. Can help identify potential breakouts and reversals in price, which are the moments when traders are called on to make strategic decisions. These strategies can help you capitalize on price trends while having pre-defined entry and exit points to secure gains or limit losses. Using the Donchian channel can thus be part of a disciplined approach to manag
FREE
Matrix Arrow Indicator Multi Timeframe Panel MT4 是一个免费的附加组件,是您的 Matrix Arrow Indicator MT4 的重要资产。它显示了当前 Matrix Arrow Indicator MT4 信号,用于 5 个用户自定义的时间范围和总共 16 个可修改的符号/工具。用户可以选择启用/禁用 Matrix Arrow Indicator MT4 包含的 10 个标准指标中的任何一个。所有 10 个标准指标属性也是可调整的,如 Matrix Arrow Indicator MT4 。 Matrix Arrow Indicator Multi Timeframe Panel MT4 还提供了更改它所附加的当前图表的选项,方法是单击 16 个可修改符号按钮中的任何一个。这将使您能够更快地在不同符号之间工作,并且不会再次错过交易机会。 如果您想使用这个免费的 Matrix Arrow Indicator Multi Timeframe Panel MT4 插件,您需要在此处单独购买 Matrix Arrow Indicat
FREE
PZ The Zone
PZ TRADING SLU
4.25 (4)
This indicator displays buy or sell signals according to Bill Williams' definition of the Trading Zone. [ Installation Guide | Update Guide | Troubleshooting | FAQ | All Products ] Easy to use and understand Avoid trading flat markets Deterministic indicator with clear rules The indicator is non-repainting It implements alerts of all kinds It has straightforward trading implications. A blue arrow is a buy signal A red arrow is a sell signal According to Bill Williams trading in the zone helps to
FREE
Comb
Iurii Tokman
3.5 (2)
Comb   指示器显示蜂窝网格或正六边形。替代标准交易终端网格。 指标设置说明: color_comb - 网格颜色 width - 宽度,例如:22为1920*1080分辨率的屏幕,15为1366*768分辨率的屏幕等。 height - 高度,例如:6代表分辨率为1920*1080的屏幕,4代表分辨率为1366*768的屏幕等。   指示器显示蜂窝网格或正六边形。替代标准交易终端网格。 指标设置说明: color_comb - 网格颜色 width - 宽度,例如:22为1920*1080分辨率的屏幕,15为1366*768分辨率的屏幕等。 height - 高度,例如:6代表分辨率为1920*1080的屏幕,4代表分辨率为1366*768的屏幕等。
FREE
OrderBlock TS Roman
Vladislav Vlastovskii
3.88 (8)
Индикатор строит блоки заказов (БЗ) по торговой системе (ТС) Романа. Поиск блоков осуществляется одновременно на двух таймфремах: текущем и старшем (определяемым в настройках). Для оптимизации и игнорирования устаревших блоков в настройках задается ограничение количества дней в пределах которых осуществляется поиск блоков. Блоки строятся по правилам ТС состоящем из трех шагов: какую свечу вынесли (что?); какой свечой вынесли (чем?); правило отрисовки (как?).
FREE
RSI Signal AM
Andriy Matviyevs'kyy
This indicator displays the signals based on the values of the classic RSI indicator on the price chart. The RSI can be used for determining the overbought or oversold areas on the chart. Reaching these levels means that the market can soon turn around, but it does not give signal, as in a strong trend the market can stay in the overbought or oversold state for quite a long time. As with most oscillators, the signals are generated when leaving these areas. This indicator allows to display three
FREE
HMA Trend
Pavel Zamoshnikov
4.62 (84)
A trend indicator based on the Hull Moving Average (HMA) with two periods. The Hull Moving Average is an improved variant of the moving average, which shows the moment of trend reversal quite accurately. It is often used as a signal filter. Combination of two types of Hull Moving Averages makes a better use of these advantages: HMA with a slow period identifies the trend, while HMA with a fast period determines the short-term movements and signals in the trend direction. Features The movement
FREE
The Mode
Naim El Hajj
3.75 (4)
The M.O.D.E stands for " Multiple Oscillator Divergence Exit ". It is an indicator which signals a divergence between the price, and multiple oscillators. It is initially an exit indicator because it signals the weakening of a trend, but it could be used as an entry signal if used analytically Key Features: Check many divergences at once Non repainting Sends   Alerts and Push Notifications You could load the M.O.D.E onto a single chart, and be able to see the divergences happening on multiple os
FREE
Wave Reversal Indicator
Vitalyi Belyh
5 (3)
Wave Reversal Indicator - determines the direction of trend waves and price reversals. The indicator shows wave movements and trend directions. It gives recommendations where to follow the trader, helps to follow the trading strategy. It is an addition to an intraday or medium-term strategy. Almost all parameters are selected for each time frame and are changed automatically, the only parameter for manual adjustment is the wavelength. Works on various trading instruments and timeframes, rec
FREE
Traditional MACD MT4
Daniel Lewis
4.61 (71)
MetaTrader 4/5 中的 MACD 指标看上去与其它许多图表软件里的 MACD 不同。这是因为 MetaTrader 4/5 版本的 MACD 显示 MACD 曲线作为直方图,而传统上显示为曲线。此外,MetaTrader 4/5 版本使用 SMA 计算信号线,而根据 MACD 的定义,它应该使用 EMA。MetaTrader 4/5 版本也不计算实际的 MACD 直方图 (即 MACD 与信号线之间的差异)。这可能对那些 MetaTrader 4/5 的新手带来困惑,因为将 MACD 线显示为直方图,而未提供实际的 MACD 直方图。 这款指标按照其创造者 (Gerald Appel) 的定义显示 MACD,如同其它图表软件里显示的那样。而 MACD 线的计算采用 "快速" EMA 和 "慢速" EMA 之间的差异。信号线是 MACD 线的 EMA。MACD 直方图是MACD 和信号线之间的差异 (MACD 直方图可自行作为可靠的用作背离信号)。 True/False 启用开关,您可以显示/隐藏 MACD/信号线,以及 MACD 直方图。
FREE
KeltnerChannelIndicator
Todd Terence Bates
5 (1)
The Keltner Channel is a volatility-based technical indicator composed of three separate lines. The middle line is an exponential moving average (EMA) of the price. Additional lines are placed above and below the EMA. The upper band is typically set two times the Average True Range (ATR) above the EMA, and the lower band is typically set two times the ATR below the EMA. The bands expand and contract as volatility (measured by ATR) expands and contracts. Since most price action will be encompasse
FREE
GS spread
Aleksander Gladkov
The indicator calculates the current spread for each tick using the formula Spread=(ASK-BID)/Point. Schedule of changes in the boundaries spread over the timeframe displayed in a separate window from the date of accession of the indicator. Two lines corresponding to the minimum and maximum spread values are displayed. The indicator window is self-adjusted according to the minimum and maximum values from the moment of launch. The minimum and maximum values for the entire period of the indicator o
FREE
Hma Vvm Hull
Valerij Mazurenko
Hma Vvm Hull 是適用於任何市場的專業指標,在交易貨幣對時特別有效,它顯示早期趨勢以改變趨勢。該指標有許多設置,可讓您成功地將其與各種交易方法和交易策略一起使用。可以在一張圖表上安裝多個具有不同參數的指標。各種可定制的警報讓交易者始終掌控市場情況並及時找到正確的市場切入點。 使用該指標的實踐表明,它可以讓您大幅增加獲利交易的數量。 使用該指標進行​​交易的主要方式有以下三種: 1. 價格突破指標線後立即建倉。 2. 收到第一次回滾重繪線的信號後入市。 3. 沿趨勢的所有後續回調的條目。 設置: TimeFrame - 時間範圍設置。當前 - 當前 TF。此外,從一分鐘到一個月。 TimeFrameAuto - 能夠根據更高時間框架的數據調整當前圖表上的指標讀數。 Interpolane - 曲線平滑模式。 HMAPeriod - 指標週期。最佳 - 21。 HMAPrice - 相對於價格的方法。 HMASpeed——速度因子。 HMAHot - 敏感度。 HMASift - 換檔。 NotifDistance -
Cumulative Delta MT4
Evgeny Shevtsov
4.69 (36)
The indicator analyzes the volume scale and splits it into two components - seller volumes and buyer volumes, and also calculates the delta and cumulative delta. The indicator does not flicker or redraw, its calculation and plotting are performed fairly quickly, while using the data from the smaller (relative to the current) periods. The indicator operation modes can be switched using the Mode input variable: Buy - display only the buyer volumes. Sell - display only the seller volumes. BuySell -
FREE
TTF Signal AM
Andriy Matviyevs'kyy
This indicator displays the moment when the TTF oscillator crosses the zero value, and the moment when the TTF oscillator crosses its smoothed value. Crossing the zero value by the TTF oscillator is a buy/sell signal. If the TTF oscillator crosses its smoothed value, it is a signal of a trend change. The signal is given after the end of the formation of the candle. The signal is confirmed when the price crosses the high/low of the bar on which the signal was given. The indicator does not redraw.
FREE
Triple RSI
Pablo Leonardo Spata
2.5 (2)
LOOK AT THE FOLLOWING STRATEGY   WITH THIS INDICATOR.   Triple RSI   is a tool that uses the classic Relative Strength Indicator, but in several timeframes to find market reversals.    1.  ️ Idea behind the indicator and its strategy: In Trading, be it Forex or any other asset, the ideal is   to keep it simple, the simpler the better . The   triple RSI   strategy is one of the simple strategies that seek market returns. In our experience, where there is more money to always be won, i
FREE
该产品的买家也购买
Gann Made Easy
Oleg Rodin
4.87 (95)
Gann Made Easy 是一个专业且易于使用的外汇交易系统,它基于使用先生理论的最佳交易原则。 W.D.江恩。该指标提供准确的买入和卖出信号,包括止损和获利水平。您甚至可以使用推送通知在旅途中进行交易。 购买后请联系我!我将免费与您分享我的交易技巧和丰厚的红利指标! 您可能已经多次听说过江恩交易方法。通常 Gann 的理论不仅对于新手交易者而且对于那些已经有一定交易经验的人来说都是非常复杂的东西。这是因为江恩的交易方法在理论上并不那么容易应用。我花了几年时间来完善这些知识,并将最好的原则应用到我的外汇指标中。 该指标非常易于应用。您所需要的只是将其附加到您的图表并遵循简单的交易建议。该指标不断进行市场分析工作并寻找交易机会。当它检测到一个好的入口点时,它会为您提供一个箭头信号。该指标还显示止损和获利水平。 换句话说,当您像先生一样进行交易时,该指标会为您提供最佳江恩建议。江恩亲自告诉你此时此刻该做什么。但最好的部分是您不需要了解任何有关江恩交易原则的知识,因为该指标会为您完成整个市场分析工作。
Gold Stuff
Vasiliy Strukov
4.9 (268)
Gold Stuff 是专为黄金设计的趋势指标,也可用于任何金融工具。 该指标不会重绘,也不会滞后。 推荐时间框架 H1。 在它指标工作全自动专家顾问 EA Gold Stuff。 你可以在我的个人资料中找到它。 重要! 购买后立即与我联系,以获得说明和奖金!   您可以免费收到我们的强力支持和趋势扫描指标的副本,请私信。大部头书! 购买后立即联系我以获得设置和个人奖励!   设置 绘制箭头 - 打开关闭。 在图表上绘制箭头。 警报 - 打开关闭声音警报。 电子邮件通知 - 打开关闭。 电子邮件通知。 Puch-notification - 打开关闭。 推送通知。 接下来,调整色域。 Gold Stuff 是专为黄金设计的趋势指标,也可用于任何金融工具。 该指标不会重绘,也不会滞后。 推荐时间框架 H1。 在它指标工作全自动专家顾问 EA Gold Stuff。 你可以在我的个人资料中找到它。 购买后立即联系我以获得设置和个人奖励!   设置 绘制箭头 - 打开关闭。 在图表上绘制箭头。 警报 - 打开关闭声音警报。 电子邮件通知 - 打开关闭。 电子邮件通
Trend Pulse
Mohamed Hassan
5 (3)
Please contact me after purchase to immediately get your PDF strategy + documentation for Trend Pulse !  Official release price of $99  ( 17 / 50 copies left). Next price is $199 . Introducing Trend Pulse , a unique and robust indicator capable of detecting bullish, bearish, and even ranging trends! Trend Pulse uses a special algorithm to filter out market noise with real precision. If the current symbol is moving sideways, Trend Pulse will send you a ranging signal, letting you know that
Trend Punch
Mohamed Hassan
4.95 (21)
This indicator is unstoppable when combined with our other indicator called  Support & Resistance . After purchase, send us a message and you will get it   for  FREE as a BONUS! Introducing Trend Punch , the revolutionary forex trend indicator that will transform the way you trade! Trend Punch is uniquely designed to provide precise buy and sell arrows during strong market trends, making your trading decisions clearer and more confident. Whether you're trading major currency pairs or exotic sym
Scalper Inside PRO
Alexey Minkov
4.75 (60)
An exclusive indicator that utilizes an innovative algorithm to swiftly and accurately determine the market trend. The indicator automatically calculates opening, closing, and profit levels, providing detailed trading statistics. With these features, you can choose the most appropriate trading instrument for the current market conditions. Additionally, you can easily integrate your own arrow indicators into Scalper Inside Pro to quickly evaluate their statistics and profitability. Scalper Inside
FX Power MT4 NG
Daniel Stein
5 (12)
通过 mql5 和 Telegram 上 的晨间简报获取每日市场更新,包括详细信息和屏幕截图 ! FX Power MT4 NG 是我们长期以来非常受欢迎的货币强度计算器 FX Power 的下一代产品。 这款下一代强度计算器能提供什么?您所喜爱的原版 FX Power 的所有功能 附加功能 黄金/XAU 强度分析 更精确的计算结果 可单独配置的分析周期 可自定义计算限制,以获得更好的性能 为希望查看更多信息的用户提供特殊的多实例设置 无尽的图形设置,可在每个图表中设置您最喜欢的颜色 无数的通知选项,让您再也不会错过任何重要信息 采用 Windows 11 和 macOS 风格的全新圆角设计 神奇的移动指标面板 FX Power 主要功能 所有主要货币的完整强势历史 所有时间框架内的货币强弱历史 所有经纪商和图表的计算结果完全相同 100% 可靠的实时计算 -> 无重绘 可通过下拉列表选择分析时段 通过自定义模式单独配置分析时段 可在一个图表中使用多个实例 可移动 FX Power 显示屏(通过拖放) 适用于高分辨率 QHD、UHD 和 4K 显示器 自动终端配置 针对平板电脑
Currency Strength Wizard
Oleg Rodin
4.92 (50)
货币强度向导是一个非常强大的指标,为您提供成功交易的一体化解决方案。该指标使用多个时间范围内所有货币的数据来计算这个或那个外汇对的力量。此数据以易于使用的货币指数和货币电力线的形式表示,您可以使用它们来查看这种或那种货币的力量。 您所需要的只是将指标附加到您要交易的图表上,该指标将向您显示您交易的货币的真实强度。该指标还向您显示买卖量压力的极值,您可以在顺势交易时利用这些压力。该指标还显示了基于斐波那契的可能目标。该指标可用于各种交易时间范围。该指标支持各种货币对的交易。 该指标为您提供所有类型的警报,包括推送通知。 购买后请联系我。我将与您分享我的交易技巧,并免费为您提供丰厚的红利指标! 祝您交易愉快,获利丰厚!
Atomic Analyst
Issam Kassas
5 (3)
首先值得强调的是,该交易指标是非重绘、非延迟的指标,这使其成为手动和机器人交易的理想选择。 用户手册:设置、输入和策略。 Atomic Analyst是一种PA价格行动指标,利用价格的力量和动量来寻找市场上更好的机会。配备了高级过滤器,可帮助去除噪音和假信号,并提高交易潜力。使用多层复杂的指标,Atomic Analyst扫描图表,并将复杂的数学计算转化为任何初学者都能理解并用来做出一致交易决策的简单信号和颜色。 “Atomic Analyst”是专为新手和经验丰富的交易者量身定制的综合交易解决方案。它将高级指标和一流功能融合为一体的交易策略,使其成为所有类型交易者的多功能选择。 日内交易和剥头皮策略:专为快速准确的日内交易和短期交易而设计。 日内和摆动交易策略:可用作追求价格大幅波动的日内和摆动交易者的可靠工具。 多货币和市场:凭借其可靠的精度,在不同的工具和市场上运作。 多个时间框架:可在多个时间框架上使用,性能良好。 稳定性:所有指标均不重绘、不重绘和不滞后,确保可靠的信号。 信号清晰度:提供箭头信号,用于清晰的入场和出场点。 实时警报:通过交易入场、SL和TP警报通知交
Apollo Pips PLUS SP
Oleg Rodin
5 (1)
请在购买产品之前阅读下面的信息! Apollo Pips PLUS SP 是一款独特的产品!它适合那些想要获得我的新“APOLLO PIPS”指标以及“超级包”奖金以及访问我所有交易指标的人! 通过购买 Apollo Pips PLUS SP 产品,您实际上购买的是全新版本的 Apollo Pips 指标。此版本的指标具有改进的算法和易于使用的参数,使您有机会在任何市场和任何交易风格中使用该指标。 该产品的购买者还可以免费访问我的所有其他指标,作为我的超级奖励!如果您想获得我所有的交易工具,那么该产品非常适合您!:) 但这还不是全部!:) 该产品的所有购买者也有资格免费获得我的新指标!:) 如果我有一个新的交易指标可用,您将能够在我的特权“SUPER PACK”终身奖金计划中完全免费获得它! 购买后请联系我以获得我的交易提示和超级礼包奖金!
首先,值得强调的是,这个交易工具是非重绘、非重画和非滞后的指标,非常适合专业交易。 在线课程,用户手册和演示。 智能价格行动概念指标是一个非常强大的工具,既适用于新手,也适用于经验丰富的交易者。它将超过20个有用的指标合并到一个指标中,结合了高级交易思想,如内圈交易员分析和智能资金概念交易策略。该指标侧重于智能资金概念,提供有关大型机构交易方式的见解,帮助预测它们的动向。 它在流动性分析方面尤其擅长,有助于理解机构的交易方式。它擅长预测市场趋势,并仔细分析价格波动。通过将您的交易与机构策略对齐,您可以更准确地预测市场走向。该指标多才多艺,擅长分析市场结构,识别重要的订单区块,并识别各种模式。 它擅长识别BOS和CHoCH等模式,理解动量的转变,并突出显示供需强劲的关键区域。它还擅长发现强大的不平衡,并分析价格创造更高高点或更低低点的模式。如果您使用斐波那契回撤工具,该指标可以满足您的需求。它还可以识别相等的高点和低点,分析不同的时间框架,并通过仪表板显示数据。 对于使用更高级策略的交易者,该指标提供了工具,如公平价值差指标和优惠和折扣区域的识别。它特别关注高时间框架订单
Advanced Currency Strength28 Indicator
Bernhard Schweigert
4.91 (666)
目前26%的折扣 任何新手或专家交易者的最佳解决方案! 这个指标是一个独特的、高质量的、可负担得起的交易工具,因为我们纳入了一些专有的功能和一个新的公式。只需一个图表,你就可以读出28个外汇对的货币强度!想象一下,你的交易将如何得到改善,因为你的交易是在你的手中进行的。想象一下,你的交易将如何改善,因为你能够准确地确定新趋势或剥头皮机会的触发点? 用户手册:点击这里  https://www.mql5.com/en/blogs/post/697384 这是第一本,原版的! 不要买一个毫无价值的崇拜者的克隆品。 特别的 子窗口中的箭头显示强劲的货币势头GAP将指导你的交易! 当基础货币或报价货币处于超卖/超买区域(外盘斐波那契水平)时,在个人图表的主窗口中出现警告信号。 当货币力量从外围区间回落时,回撤/反转警报。 十字星模式的特别警报 可选择多个时间框架,以快速查看趋势! 货币强度线在所有的时间框架中都非常平稳,当使用较高的时间框架来识别总体趋势,然后使用较短的时间框架来确定精确的入口时,效果非常好。你可以根据自己的意愿选择任何时间框架。每个时间框架都由其自身进
M1 Arrow
Oleg Rodin
4.73 (15)
M1 Arrow - 基于市场的两个基本原则的盘中策略。 该算法基于使用附加过滤器对交易量和价格波动的分析。该指标的智能算法仅在两个市场因素合二为一时才会发出信号。该指标使用较高时间框架的数据计算 M1 图表上某个范围的波浪。为了确认波浪,该指标使用了成交量分析。 从理论上讲,该指标可以与其他时间框架一起使用,但您需要考虑到该指标最初是为在 M1 上交易而开发的这一事实。 该指标是一个现成的交易系统。交易者所需要的只是跟随信号。此外,该指标可以成为您自己的交易系统的基础。交易仅在分钟图表上进行。 尽管指标使用 MTF 原理,但指标算法尽可能稳定。 购买后,一定要写信给我!我将与您分享我的交易设置和建议!祝您交易成功!感谢您的关注!
TakePropips Donchian Trend Pro
Eric John Pajarillaga Aldana
4.61 (18)
TakePropips Donchian Trend Pro   (MT4) 是一款功能强大且有效的工具,可使用 Donchian 通道自动检测趋势方向,并为您提供进场和退场交易信号! 这个多功能指标包括趋势扫描器、交易信号、统计面板、筛选器、交易时段和警报历史仪表板。它旨在为您提供交易信号并节省您分析图表的时间! 您可以在我们的博文中下载用户手册和安装指南:   https   :// www.mql5.com/en/blogs/post/751368 今天立减 50%!价格从 98 美元降到 49 美元! 您可以在 Strategy Tester 上测试该指标(启用可视模式) 视频教程也可在说明下方获得更多详细信息。 如果您有任何问题或需要任何帮助,请与我联系。 TakePropips Donchian Trend Pro 指标适用于所有外汇对、金属、商品、指数和加密货币。 主要特点 交易信号 - 检测多个时间范围内所有货币对的买卖机会。它将为您提供警报并在图表上绘制交易信号,最多 3 个止盈价和一个止损价。 Trend Scanner   - 用于快速扫描和识别跨多个时间
TPSpro RFI Levels
Roman Podpora
4.83 (23)
Reversal First Impulse levels (RFI)    INSTRUCTIONS        RUS       -       ENG              R ecommended to use with an indicator   -   TPSpro  TREND PRO -  Version MT5 A key element in trading is zones or levels from which decisions to buy or sell a trading instrument are made. Despite attempts by major players to conceal their presence in the market, they inevitably leave traces. Our task was to learn how to identify these traces and interpret them correctly. Main functions: Displaying activ
TPSproTREND PrO
Roman Podpora
4.78 (18)
TPSpro TRENDPRO  - is a trend indicator that automatically analyzes the market and provides information about the trend and each of its changes, as well as giving signals for entering trades without redrawing! The indicator uses each candle, analyzing them separately. referring to different impulses - up or down impulse. Exact entry points into transactions for currencies, crypto, metals, stocks, indices!  -  Version MT5               DETAILED DESCRIPTION                R ecommended to use with
Trend Screener
STE S.S.COMPANY
4.82 (92)
趋势指标,趋势交易和过滤的突破性独特解决方案,所有重要趋势功能都内置在一个工具中! 它是 100% 非重绘多时间框架和多货币指标,可用于所有符号/工具:外汇、商品、加密货币、指数、股票。 趋势筛选器是有效的指标趋势跟踪指标,它在图表中提供带有点的箭头趋势信号。 趋势分析器指标中可用的功能: 1.趋势扫描仪。 2. 具有最大利润分析的趋势线。 3.趋势货币强度计。 4. 带有警报的趋势反转点。 5. 带有警报的强趋势点。 6. 趋势箭头 每日分析示例,每日信号表现...等与我们的趋势筛选指标,可以在这里找到: 点击这里 限时优惠:Trend Screener Indicator 仅售 50 美元且终身可用。原价 125$) 通过访问我们的 MQL5 博客,您可以找到我们所有的高级指标以及分析示例、每日信号表现...等。 : 点击这里 我们的趋势系统由 2 个指标组成: 1. Trend Screener Indicator:显示趋势仪表盘、图表中的趋势线、入场点...等。 2. Trend Line Map Indicator:显示买卖作为仪表板,活动信号盈利/亏损
- Real price is 80$ - 50% Discount ( It is 39$ now ) Contact me for instruction, any questions! Introduction The breakout and retest strategy is traded support and resistance levels. it involves price breaking through a previous level.  The break and retest strategy is designed to help traders do two main things, the first is to avoid false breakouts. Many false breakouts start with a candlestick that breaks out of a level but ends with an immediate candlestick that brings the price back into t
目前八折优惠! 对任何新手或专家交易者来说都是最好的解决方案! 这个仪表板软件适用于28种货币对。它基于我们的两个主要指标(高级货币强度28和高级货币冲动)。它对整个外汇市场提供了一个伟大的概述。它显示高级货币强度值,货币运动速度和28个外汇对在所有(9)时间段的信号。想象一下,当你可以使用图表上的单一指标观察整个市场,以确定趋势和或剥头皮的机会时,你的交易将得到改善 我们已经在这个指标中建立了一些功能,使你更容易识别强势和弱势货币,同时识别和确认潜在的交易。该指标以图形方式显示货币的强势或弱势是增加还是减少,以及它在所有时间段的表现。 增加的新功能是动态市场斐波那契水平,它适应当前的市场条件变化,这是一个已经在我们的高级货币强度28和高级货币冲动指标中使用的成熟的加分项。 在交易时,总是将弱势货币和强势货币配对,这个新指标将帮助你做到这一点。 用户手册:点击这里  https://www.mql5.com/en/blogs/post/708783 特点  显示每个时间段的ACS28和GAP-speed(冲动)的货币强度值。 列:颜色代码以7种颜色
Quantum Trend Sniper Indicator MT4
Bogdan Ion Puscasu
4.6 (40)
介绍   量子趋势狙击指标 ,突破性的 MQL5 指标,正在改变您识别和交易趋势反转的方式!由拥有超过13年交易经验的资深交易员团队开发,     量子趋势狙击指标   旨在通过其创新的方式以极高的准确度识别趋势反转,将您的交易之旅推向新的高度。 ***购买量子趋势狙击指标,即可免费获得量子突破指标!*** 当量子突破指标识别出趋势反转时,它会向您发出警报和信号箭头,并建议您三个止盈水平。 它既适合新手交易者,也适合专业交易者。 量子 EA 通道:       点击这里 MT5版本:       点击这里 建议: 时间范围:  所有时间范围。为了获得最佳结果,我们建议在 M15、M30 和 H1 时间范围内使用它。 货币对:欧元兑美元、英镑兑美元、澳元兑美元、欧元兑英镑, EURAUD, XAUUSD 账户类型:ECN、Raw 或 Razor,点差极低 经纪时间:任意 经纪商:IC Markets、Pepperstone with Raw 和 Razor 的点差最低 建议止损:50 点 建议止盈水平:20 点、50 点和 1
Ultimate Sniper Dashboard
Hispraise Chinedum Abraham
4.85 (27)
折扣价为299美元! 未来可能会涨价! 请阅读下面的描述! 终极狙击手仪表盘的最佳进入系统。终极动态水平。(请查看我的产品) 由于MT4多币种测试的限制,终极狙击手仪表盘只适用于实时市场。 介绍Ultimate-Sniper Dashboard! 我们最好的产品包括HA-狙击手、MA-狙击手和许多特殊模式。终极狙击手仪表盘是一个绝对的野兽! 对于任何新手或专家交易者来说,这是最好的解决方案! 永远不要再错过任何一个动作! 对于那些喜欢简单和点数的交易者,我们有一个特别的产品给你。本质上很简单,该仪表板根据多种自定义算法查看28种货币对,完成所有工作。只需一张图表,你就可以像专家一样阅读市场。试想一下,如果你能在任何外汇对开始移动时准确地确定其方向,你的交易会有多大的改善。   我们的系统是为了寻找高概率信号并实时向用户发送警报。没有滞后或错误的信号。 为了保持图表的清洁,你可以在不需要时隐藏Ultimate-Sniper。只需按下箭头按钮即可隐藏仪表板。 Ultimate-Sniper适用于从1分钟到月度的所有时间框架,因此你可以在你选择的任何时间框架上快速
BullsEye Signal NoRepaint
Martin Alejandro Bamonte
3 (2)
BullseyeSignal – NoRepaint 是一种信号,如其名称所示,在任何情况下都不会重新绘制。信号在图像中观察到的同一根蜡烛上发出。它非常适合高度波动的市场,如外汇、加密货币、股票、指数和期货。 你只会看到绿色箭头表示买入和红色箭头表示卖出,但背后有许多指标共同工作,以提供更简化的交易体验。 它专为提供精确的进入点而设计, 不是大量的,而是特定的进入点,当我们的指标显示趋势变化并穿过0水平线与前一趋势相反时。为了实现更精确的交易,指标等待第一个回调以确认趋势变化,从而避免假反转。因此,在突破前一趋势并确认回调后,将发出信号。 这是一种非常谨慎的交易方法, 因此重要的是要遵循这些提示(新手和更高级的交易者都可以使用这种策略): 建议使用纽约市场、伦敦市场或两者重叠的市场。如果你需要在其他市场交易,例如亚洲市场,必须事先检查交易的货币对是否处于非常狭窄的范围内。范围市场:可以交易吗?可以,但要交易任何处于范围内的货币对,你必须观察货币对和范围长度。例如,如果你在M5图表上,合适的范围大约是200点(最高点和最低点之间)。如果范围较小,我们将得到很少的点数,甚至可能遇到
RelicusRoad Pro
Relicus LLC
4.73 (141)
现在$ 147(更新后增加到$ 499) - 无限帐户(PC或Mac) RelicusRoad 用户手册 + 培训视频 + 访问 Private Discord Group + VIP 身份 一种看待市场的新方式 RelicusRoad 是世界上最强大的外汇、期货、加密货币、股票和指数交易指标,为交易者提供保持盈利所需的所有信息和工具。我们提供技术分析和交易计划,帮助每一位交易者取得成功,从初学者到高级。它是一个关键的交易指标,可以提供足够的信息来预测未来的市场。我们相信一个完整的解决方案,而不是图表上几个没有意义的不同指标。这是一个多合一指标,显示无与伦比且非常准确的信号、箭头 + 价格行为信息。 RelicusRoad 基于强大的人工智能,提供缺失的信息和工具来教育您并使您成为交易专家,成为成功的交易者。 几乎所有技术指标都滞后,这意味着它们只能报告已经发生的事情。因此,他们只确认您过去可以看到的价格已经在哪里。我们相信领先指标可以预测未来价格,而无需重新绘制,也不要过度依赖可能改变并导致重新绘制的滞后指标。如果您根据滞后指标进行交易并建立头寸,您就知道您已
How to use Pair Trading Station Pair Trading Station is recommended for H1 time frame and you can use it for any currency pairs. To generate buy and sell signal, follow few steps below to apply Pair Trading Station to your MetaTrader terminal. When you load Pair Trading Station on your chart, Pair Trading station will assess available historical data in your MetaTrader platforms for each currency pair. On your chart, the amount of historical data available will be displayed for each currency pai
XQ Indicator MetaTrader 4
Marzena Maria Szmit
3.67 (3)
Step into the realm of Forex trading with confidence and precision using XQ, a cutting-edge Forex indicator designed to elevate your trading game to unprecedented heights. Whether you're a seasoned trader or just stepping into the world of currency exchange,   XQ Forex Indicator   empowers you with the insights and signals needed to make informed trading decisions. The signal conditions are a combination of three indicators, and XQ Forex Indicator only display  medium and long-term trends . The
Introduction to X3 Chart Pattern Scanner X3 Cherart Pattern Scanner is the non-repainting and non-lagging indicator detecting X3 chart patterns including Harmonic pattern, Elliott Wave pattern, X3 patterns, and Japanese Candlestick patterns. Historical patterns match with signal patterns. Hence, you can readily develop the solid trading strategy in your chart. More importantly, this superb pattern scanner can detect the optimal pattern of its kind. In addition, you can switch on and off individu
Gold Buster M1 System - 是 XAUUSD 货币对 M1 图表的专业交易系统。但是,尽管该系统最初是专门为交易黄金而开发的,但该系统也可以与其他一些货币对一起使用。购买后,我会给你一个除了XAUUSD之外,可以和系统一起使用的交易对列表,这将扩大你使用这个系统的可能性 系统中的所有指标都不会重复! 该系统是一组三个指标。它是一个趋势指标、箭头指标和成交量指标,直观地显示了市场的强弱。 购买后,您可以立即下载趋势指标。我将免费为您提供剩余的两个指标,因为它们是整个系统的一部分。我还将为您提供一个模板,您可以使用该模板在图表上加载指标。此外,我将教你如何使用我的系统进行交易并分享我的建议。还有丰厚的红利等着你! 购买后请务必立即写信给我!
Market Reversal Alerts
LEE SAMSON
4.21 (121)
成為突破者,隨著價格反轉,市場結構會改變利潤。 訂單突破者指示器可以識別趨勢或價格走勢何時接近枯竭並準備好逆轉。它會提醒您市場結構的變化,通常會在發生逆轉或重大回調時發生。 該指標使用專有計算來確定突破和價格動能。每當在可能的耗盡點附近形成新的高點時,指標就會繪製最後一個生成該高點的順序塊。然後,它將隨價格移動隨價格跟隨定單。然後,當價格轉向相反方向並突破該訂單塊時,它會提醒您,從而創建新的市場結構並開始趨勢或重大回調的可能逆轉。 訂單塊是在創建高/低之前的最後一個相反的彩色蠟燭,並且當價格跌破這些關鍵區域以下時,這表明趨勢可能會發生短期或長期反轉。 特徵 提醒您關鍵耗盡點的市場結構變化 價格接近耗盡水平時自動提取訂單塊 在一個方向繼續移動時,在價格後面跟踪定單,以提醒您最佳的反轉輸入 將顏色更改為純色塊,以顯示何時發生市場結構中斷。 適用於所有交易品種和時間範圍 內置集成的彈出窗口和電子郵件警報 策略和如何與定單破壞者指標進行交易 當斷路器塊發生時,您有兩個選擇。 看左邊!我們正在尋求供應/需求或支撐/阻力位嗎?市場結構轉變(逆轉)通常發生在價格重新測試舊水平或
`All in One Chart Patterns` 图表形态在交易者之间是一个有争议的话题;有些人认为它们是可靠的信号,而另一些人则不这样认为。我们的“Chart Patterns All-in-One”指标显示了各种图表形态,让您可以自行测试这些理论。这些形态的盈利能力并不反映指标的有效性,而是对形态本身的评估。“Chart Patterns All-in-One”指标是可视化这些形态的绝佳工具,让您能够对它们在您的交易策略中的有效性得出自己的结论。 该指标将多个图表模式组合成一个统一的工具,用于MetaTrader 4 (MT4)。它提供了直接从图表上开启或关闭每个模式的功能,使分析更加高效和可定制。以下是该指标和包含的模式的详细描述: #### 包含的模式: 1. **模式 1-2-3**    - **描述**:该模式用于识别市场中的潜在反转点。它寻找三个点(高点或低点)的序列,标志着趋势的变化。    - **信号**:       - 买入信号:当有两个连续的低点,第二个低点高于第一个低点,随后是一个低于前一个高点的高点时形成。      - 卖出信号:当
TopBottom Checker
Oleg Rodin
4.89 (9)
TopBottom Checker 是确定价格底部和顶部的指标。该指标可用于任何货币对。该指标适用于从 M1 到 D1 的任何时间范围。 该指标可以用作独立的交易系统,也可以作为您使用的任何交易系统的一部分,因为该指标适用于对绝对任何策略都非常重要的市场方面。指标信号既可用于顺势入场,也可用于逆势反转,也可用于指示可能关闭未平仓头寸,即退出市场。该指标非常易于使用。您只需将指标添加到图表并根据您的需要遵循其信号。该工具可用于外汇交易和二元期权交易。 默认情况下,该指标可能会略微重新绘制其信号,因为进行分析以预测价格反转,试图找到形成此类条件的最早迹象。重绘是次要的,但可能。但我有办法将其减少到零!我向所有买家提供这种方法。 注意力!我将为每个买家提供我自己使用此指标的方法,这样可以消除信号的重绘,而不会延迟信号本身!我将教您如何使用该指标进行交易,并提供我自己的方法,该方法已在实践中证明是有效的。使用我的方法,您将对使用此交易指标充满信心。 购买后,请写信给我有关如何使用指标的提示和秘密,以及丰厚的奖金!
Scalper Vault
Oleg Rodin
5 (29)
Scalper Vault 是一个专业的剥头皮系统,为您提供成功剥头皮所需的一切。该指标是一个完整的交易系统,可供外汇和二元期权交易者使用。推荐的时间范围是 M5。 该系统为您提供趋势方向的准确箭头信号。它还为您提供顶部和底部信号以及江恩市场水平。无论您拥有何种交易经验,该系统都易于使用。您只需要遵循简单的规则并每天重复该过程。 建议将此系统用于主要货币对。感谢您的关注! 请注意,该指标在策略测试器中可能无法正常工作。因此,我建议仅在模拟或真实账户的真实交易条件下使用该系统。 指示器提供所有类型的警报,包括推送通知。 购买指标后请与我联系。我将免费与您分享我的个人交易建议和出色的奖励指标! 祝您交易愉快,盈利!
作者的更多信息
SpectorMA
Sergii Krasnyi
5 (1)
We present you an indicator that not only improves the visual aspect of the chart, but also gives it a lively, dynamic character. Our indicator is a combination of one or more Moving Average (MA) indicators, which constantly change their color, creating an interesting and colorful look. This product is a graphical solution, so it is difficult to describe what it does in text, it is easier to see by downloading it, besides the product is free. This indicator is suitable for bloggers who want t
FREE
ZoomChart
Sergii Krasnyi
The ZoomChart indicator displays data from other timeframes on the current chart in the subwindow, acting as a magnifying glass or, conversely, shrinking the chart to display larger timeframes. The ZoomChar indicator automatically tracks the current outermost bar on the chart and moves with the chart as it shifts. The indicator can display data from another financial instrument, not limited to the main chart instrument. The robot carries the function of “mirroring” - The ability to conver
FREE
ChartOverlay
Sergii Krasnyi
ChartOverlay indicator has two main functions 1. mirroring - i.e. for example, it will make USDEUR from EURUSD 2. displaying the price chart of the selected financial instrument (with selected period)  in the subwindow of the main chart. This tool allows traders to easily analyze the relationship between different currency pairs and assets, offering unique customization and visualization features. Key Features: Price Chart Display: The indicator displays the price chart of the selected instrum
FREE
ZoomChart2
Sergii Krasnyi
The ZoomChart indicator works with two charts - the current chart on which it is launched and the next one. The indicator translates the second chart to the time where the first one is now. Thus, the second chart depicts the same situation on the first chart (where the indicator is launched), but on a different time-frame. In other words, this indicator serves as a magnifying glass or, on the contrary, reduces the chart to display the situation on a larger time-frame. The ZoomChar indicator a
FREE
SpectorChart
Sergii Krasnyi
5 (1)
This indicator continuously, smoothly changes the color of candlestick edges and bodies, as well as the color of volumes in real time like a lamp. The indicator is easy to use. The palette of colors is diverse. This product is a graphical solution, so it is difficult to describe what it does by text, it is easier to see by downloading it, besides the product is free. The indicator is suitable for bloggers who want to create a beautiful picture of a chart for video editing or traders who want to
FREE
SpreadChartOscillator is an indicator that displays the spread line of a symbol in the subwindow of the oscillator. In the parameters it is possible to specify another symbol from which the spread line will be broadcast. If the "Symbol" parameter is left empty, the spread line will be displayed from the current symbol on which the indicator is set. This tool is ideal for traders who want to see the spread dynamics in the oscillator format and use it to protect themselves from entering the market
FREE
筛选:
无评论
回复评论