VSA Scanner Dashboard for MT5
- 指标
- Huu Hai Ngo
- 版本: 1.0
- 激活: 10
The VSA Scanner Dashboard is a multi-symbol, multi-timeframe scanner that displays VSA signals. It is based on the Volume Plus and VSA Signals indicator.
Features
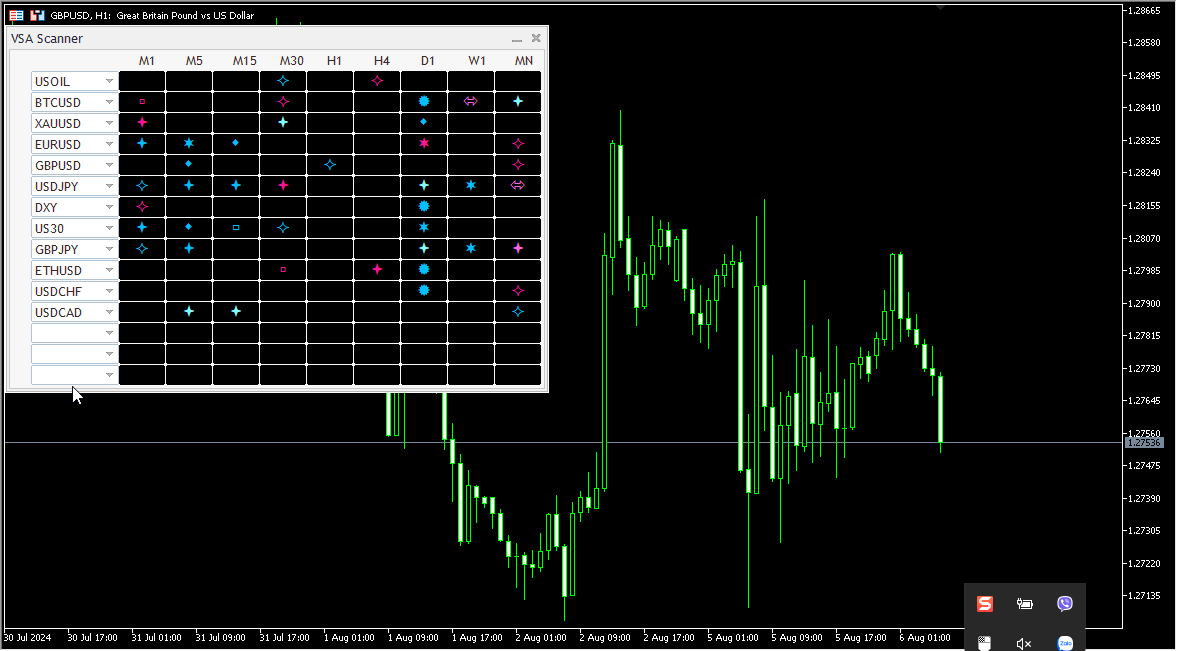
- Displays the VSA signal of the last closed candle.
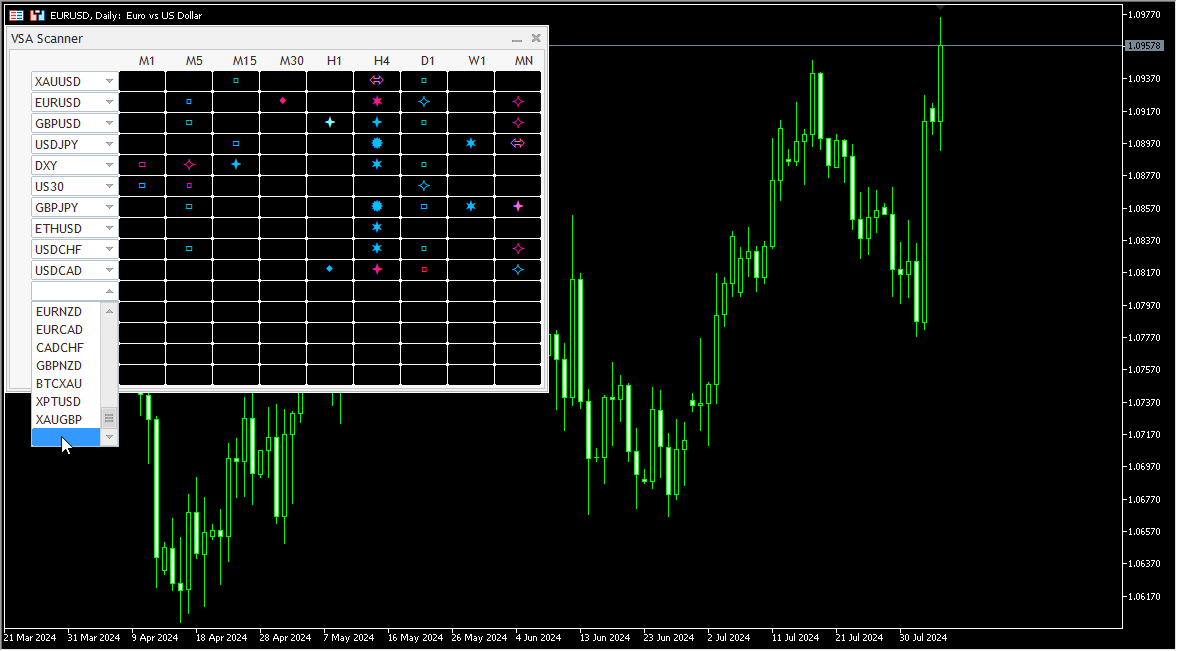
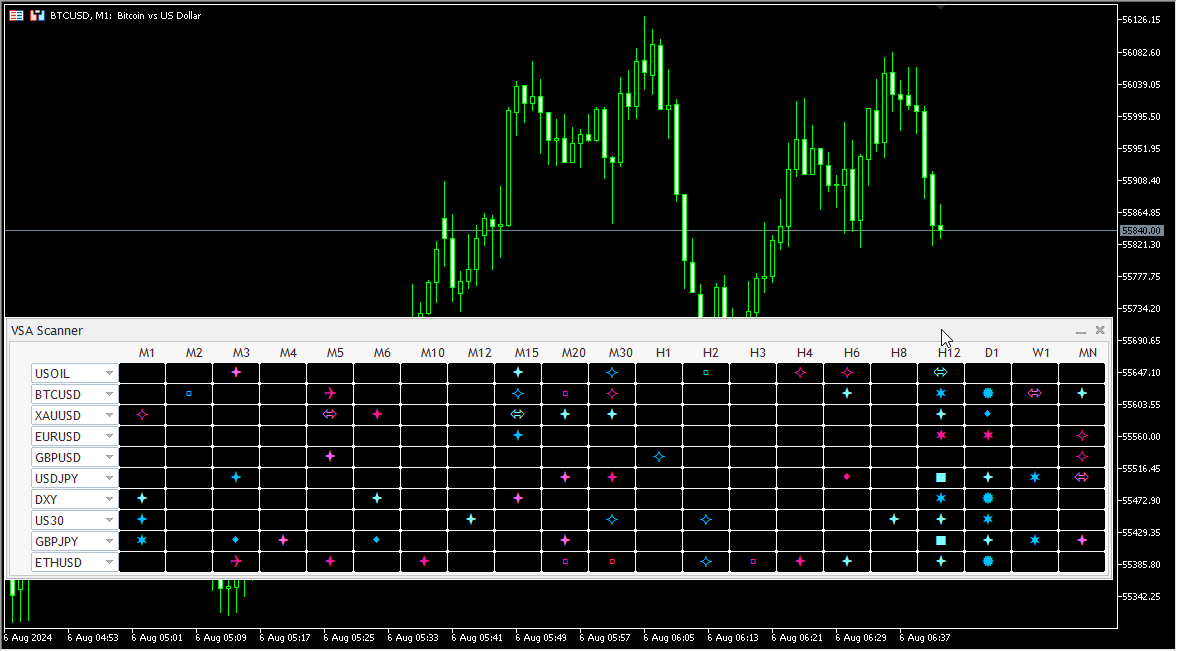
- Monitors 28 customizable instruments (symbols) and up to 21 timeframes at the same time.
- Easily arrange symbols in any order.
- Each signal has a tooltip that displays the name and time of appearance.
- Click on each signal to open a new chart.
- All types of alerts (sound, pop-up, email, mobile push notification) are available.
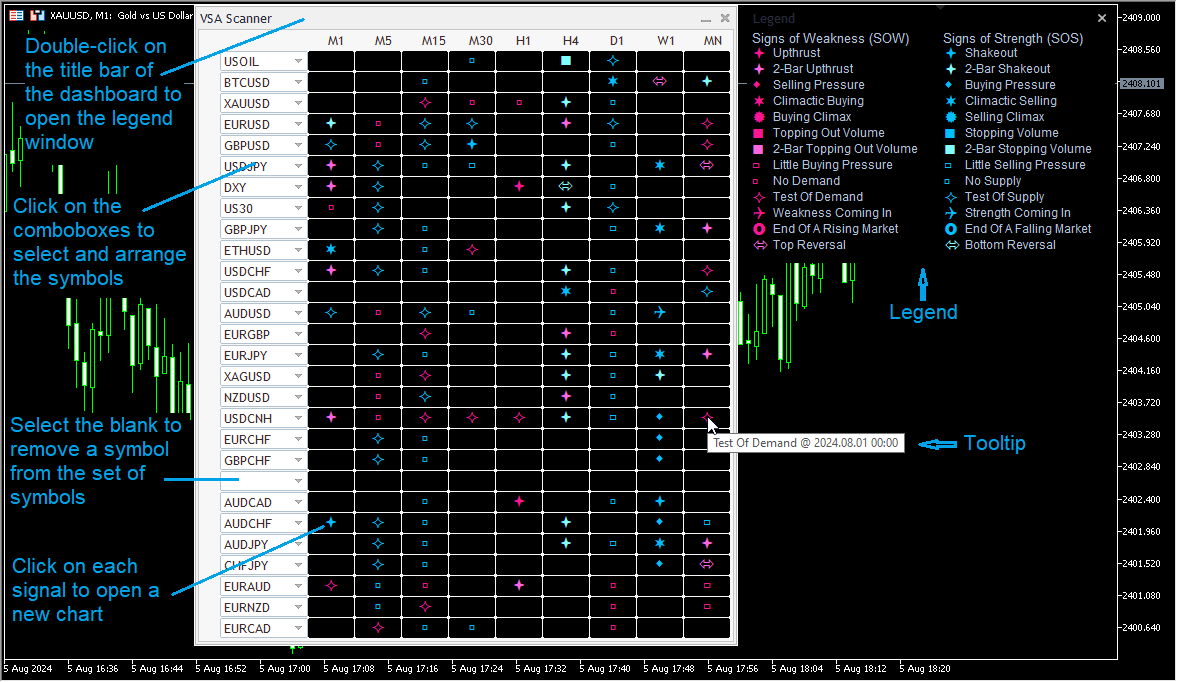
Legend
Double-click on the title bar of the dashboard to open the legend window.
The legend details are provided in the screenshots.
The indicator contains 13 SOWs (Signs of Weakness) and 13 SOSs (Signs of Strength).
| SOW | SOS |
|---|---|
| Upthrust | Shakeout |
| 2-Bar Upthrust | 2-Bar Shakeout |
| Selling Pressure | Buying Pressure |
| Climactic Buying | Climactic Selling |
| Buying Climax | Selling Climax |
| Topping Out Volume | Stopping Volume |
| 2-Bar Topping Out Volume | 2-Bar Stopping Volume |
| Little Buying Pressure | Little Selling Pressure |
| No Demand | No Supply |
| Test Of Demand | Test Of Supply |
| Weakness Coming In | Strength Coming In |
| End Of A Rising Market | End Of A Falling Market (Bag Holding) |
| Top Reversal | Bottom Reversal |
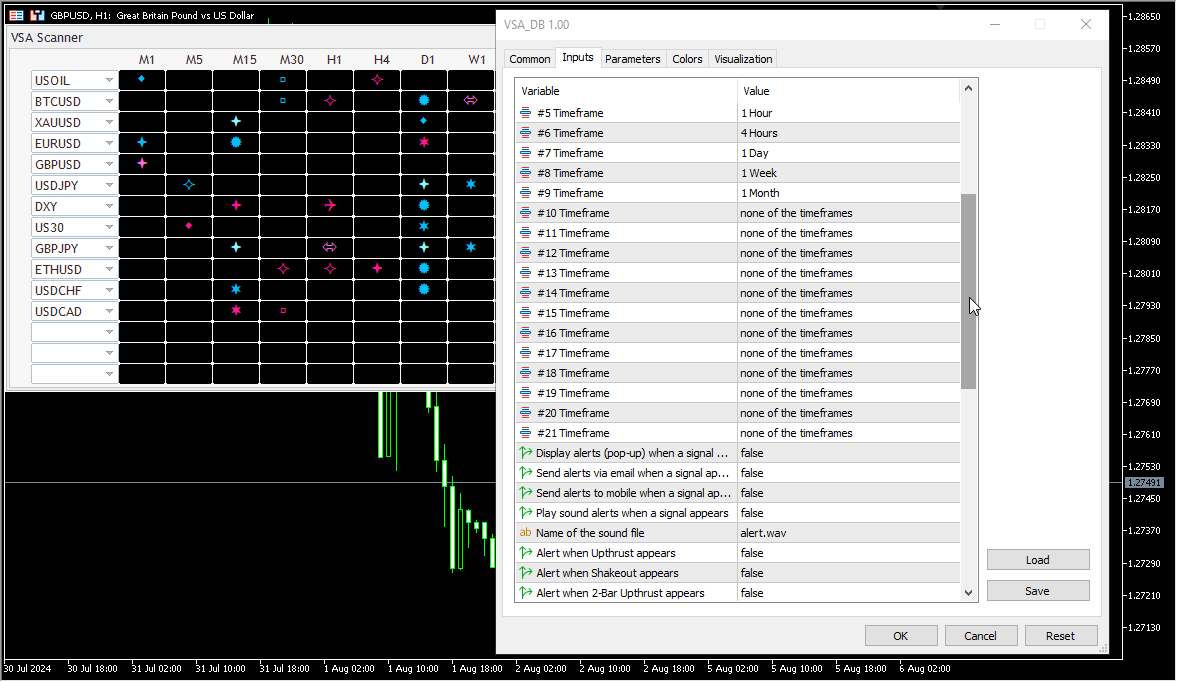
Input parameters
- Use strict conditions to recognize signals.
- Period for the moving average.
- Volume type (tick or real).
- Color of the SOS icons.
- Color of the SOW icons.
- Font size of the icons.
- Unique Identification number of the symbol set.
- Number of rows in the dashboard.
- Select the timeframes.
- Display alerts (pop-up) when a signal appears.
- Send alerts via email when a signal appears.
- Send alerts to mobile when a signal appears.
- Play sound alerts when a signal appears.
- Name of the sound file.
- Select the signals that will be alerted when they appear.
Notes:
- The first time you load the indicator, it might take a while for MT5 to update the historical data.
- The symbols you want to add to the dashboard must be visible in the Market Watch window.
- If you want to monitor more than 28 symbols you can load the indicator on another chart with different "Unique Identification number of the symbol set" in the settings and set different symbols for it.
You can download the demo version (which only scans M2 and M4 timeframes) here: VSA_DB_Demo.ex5
(SHA1: de62997ddea08b226629a978503b2778a8cc35c8)