Average Session Range
- 指标
- Tien Long Tu
- 版本: 1.40
- 更新: 19 八月 2024
Average Session Range: Calculate and Average the Sessions High-Low Range of Specific Time Sessions Over Multiple Days.
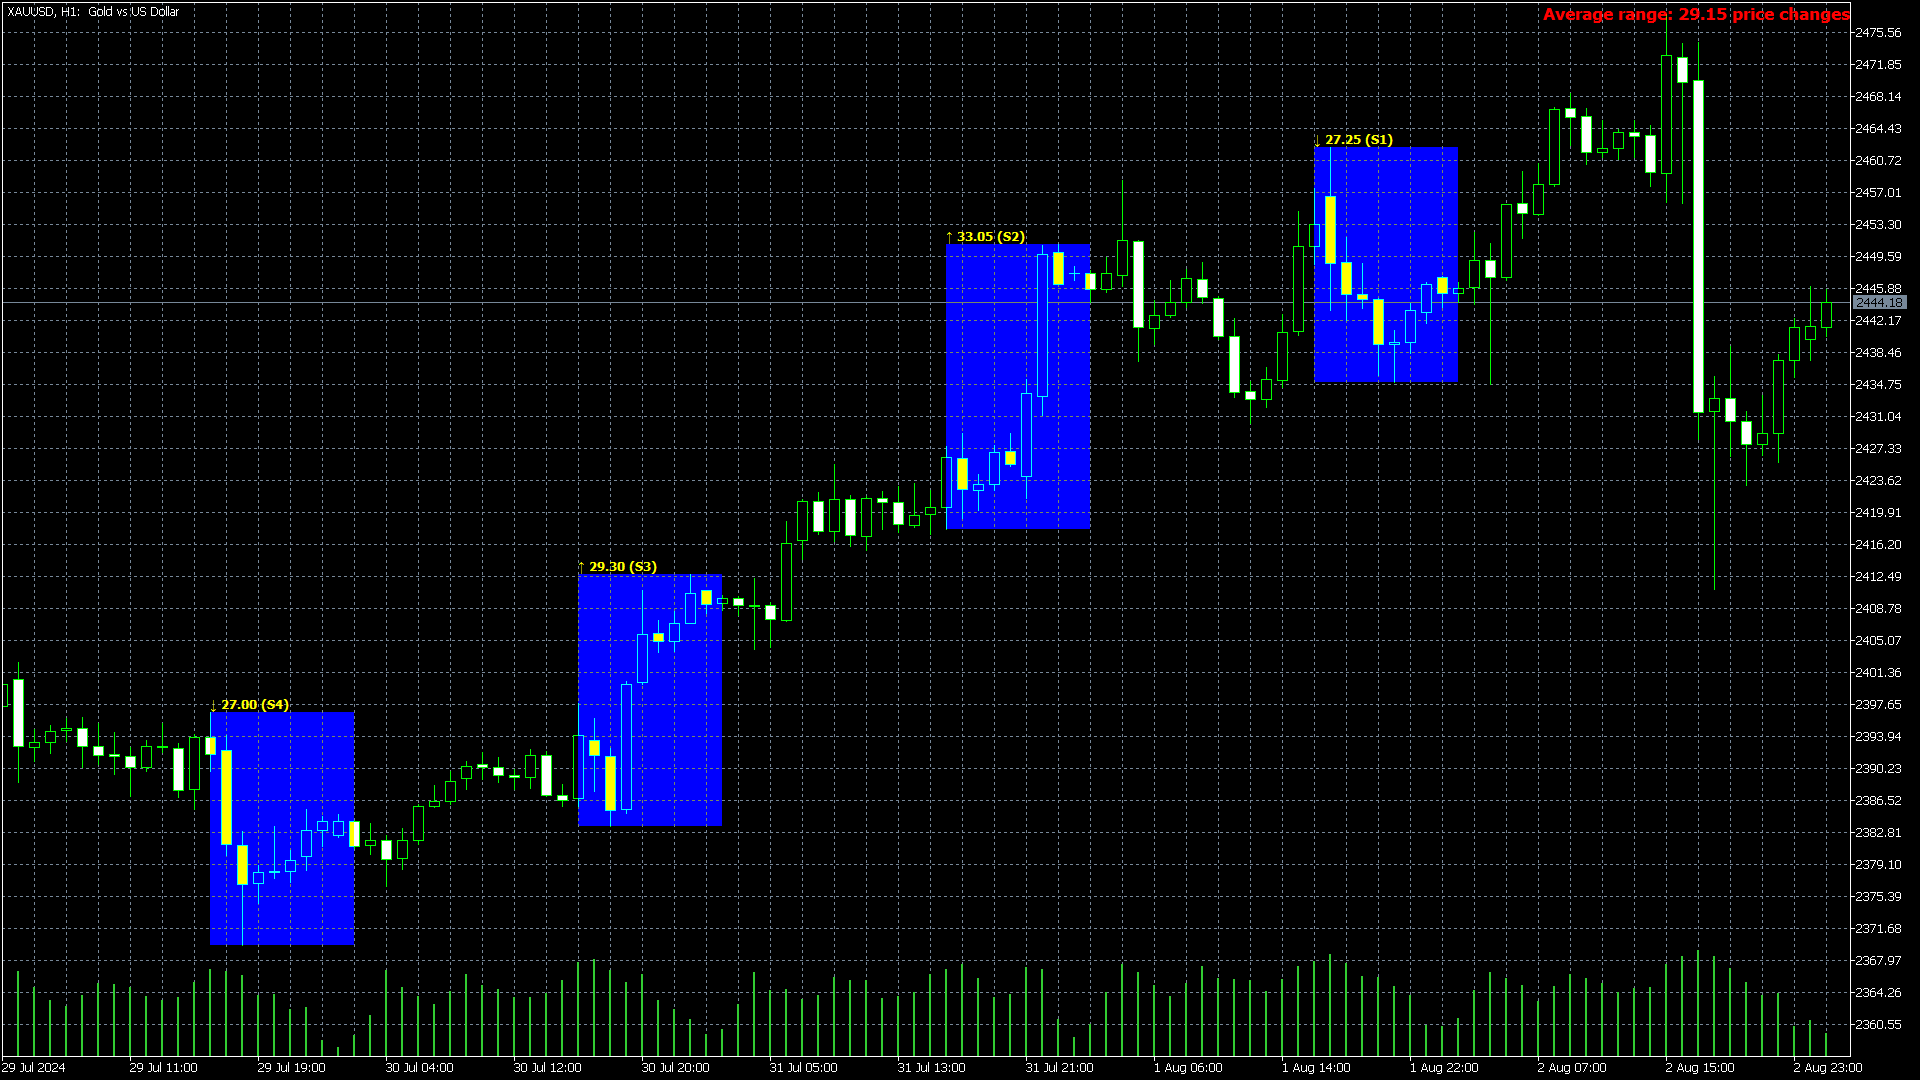
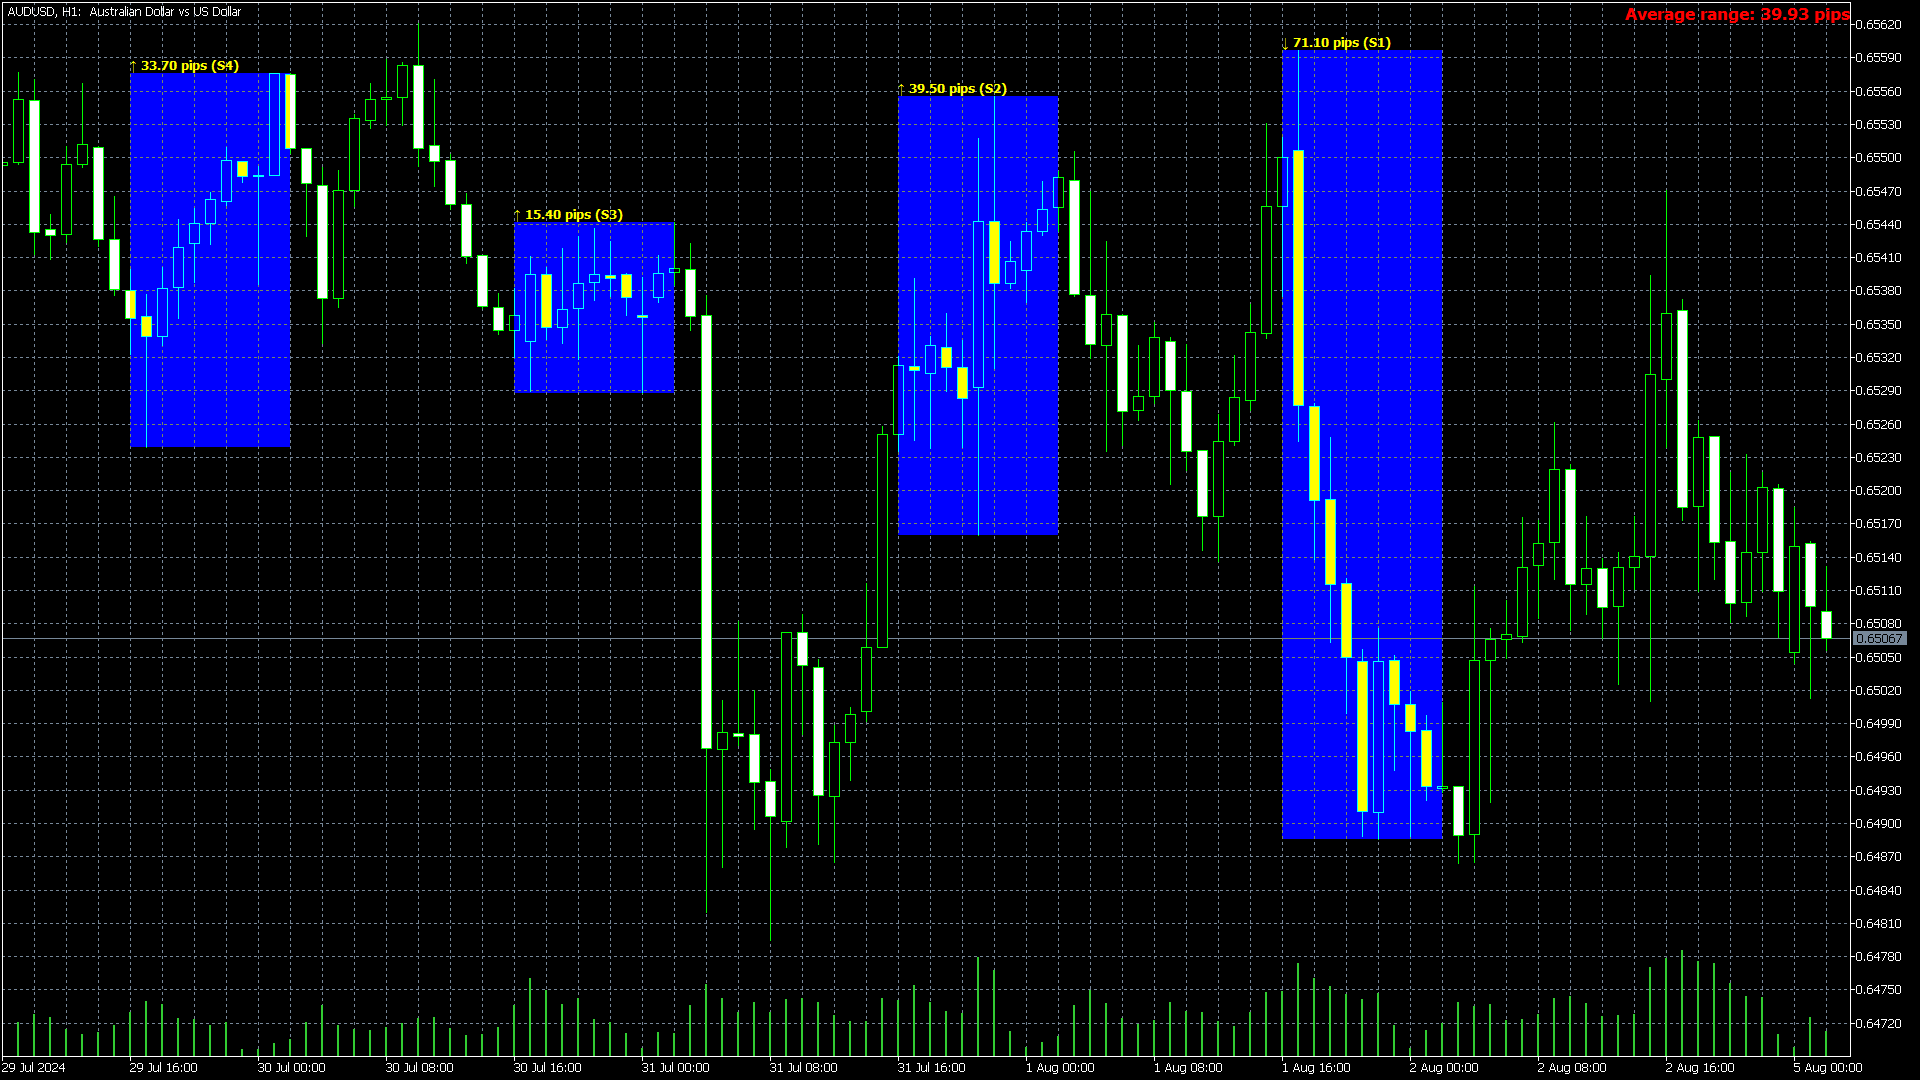
The Session Average Range is a sophisticated and precise tool designed to calculate the volatility of specific time sessions within the trading day. By meticulously analyzing the range between the high and low prices of a defined trading session over multiple days, this tool provides traders with a clear and actionable average range.
**Note:** When the trading platform is closed, the indicator may not load correctly. To ensure it works, you may need to load the indicator, unload it, and then load it again.
Key Features:
- Precision Calculation: Accurately measures the high and low range of a selected time session.
- Multi-Day Analysis: Aggregates data over a specified number of days to ensure reliability and robustness.
- Dynamic Adaptation: Adjusts to different market conditions, providing consistent insights across various trading environments.
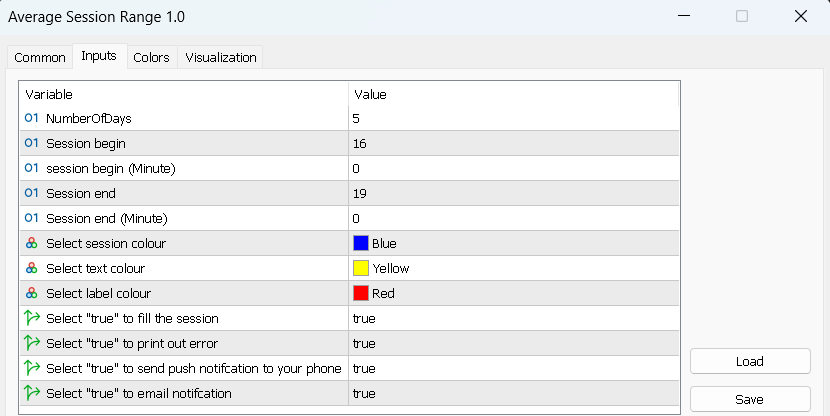
- User-Defined Sessions: Flexibly set the start and end times for the session of interest, allowing for customized analysis.
- Handling Non-Continuous Trading Days: Accurately displays the average price range for shorter trading sessions during holidays or breaks, ensuring reliable data even when trading days are less than 24 hours.
Benefits:
- Enhanced Volatility Understanding: Gain deeper insights into the typical price movements within specific trading sessions, enabling better risk management and strategy development.
- Optimal Entry and Exit Points: Use the average range data to identify optimal trading windows and improve timing for entries and exits.
- Adaptability: Whether you're focusing on the London, New York, or Tokyo sessions, the Session Average Range adapts to your needs, providing relevant and timely data.
With the Session Average Range, you can transform raw market data into powerful trading insights, enabling you to make informed and strategic trading decisions with confidence. Experience the precision and adaptability of this essential trading tool and elevate your trading performance to new heights.
note: Works for timeframes of H4 and below.
Main inputs