• 概述
  • 评论 (1)
  • 评论 (4)
  • 新特性

Golden Spikes Premium

Golden Spikes Detector

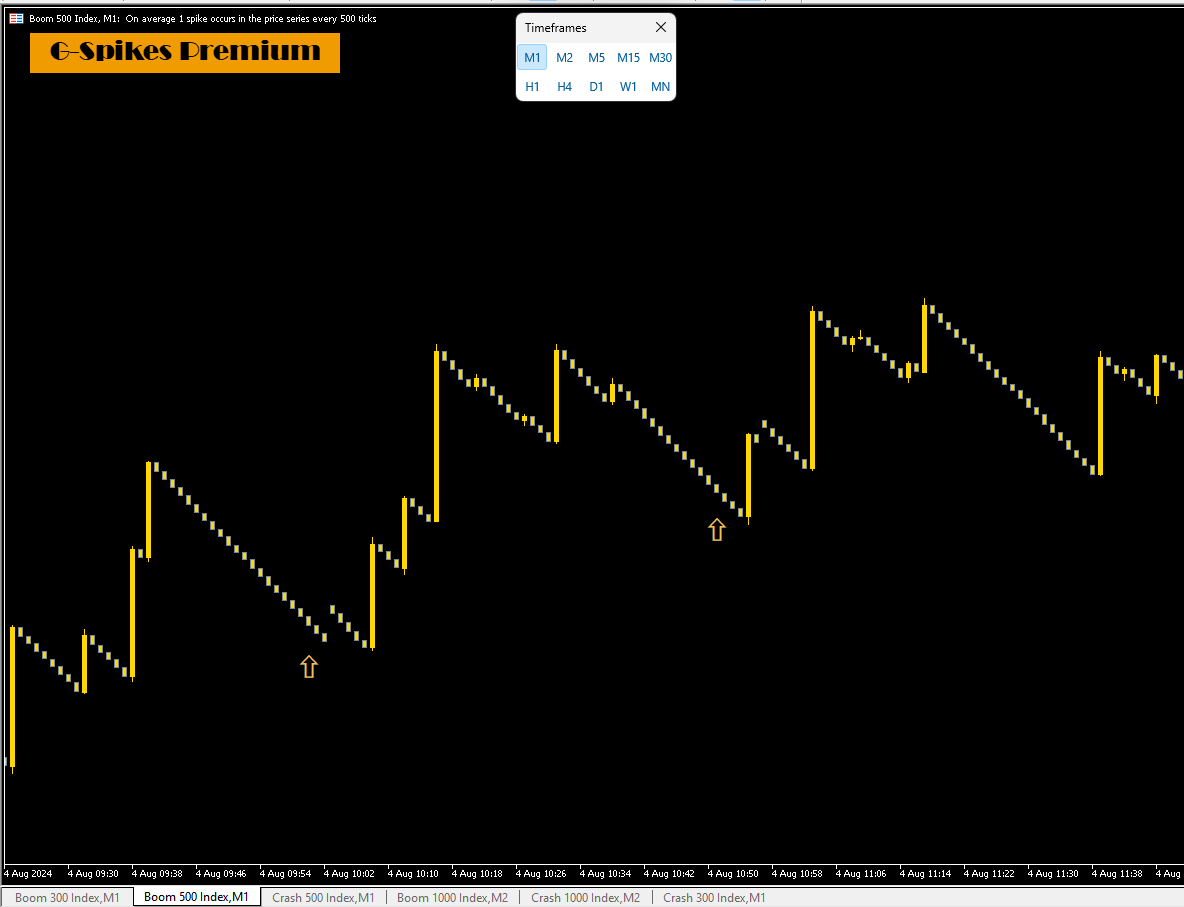
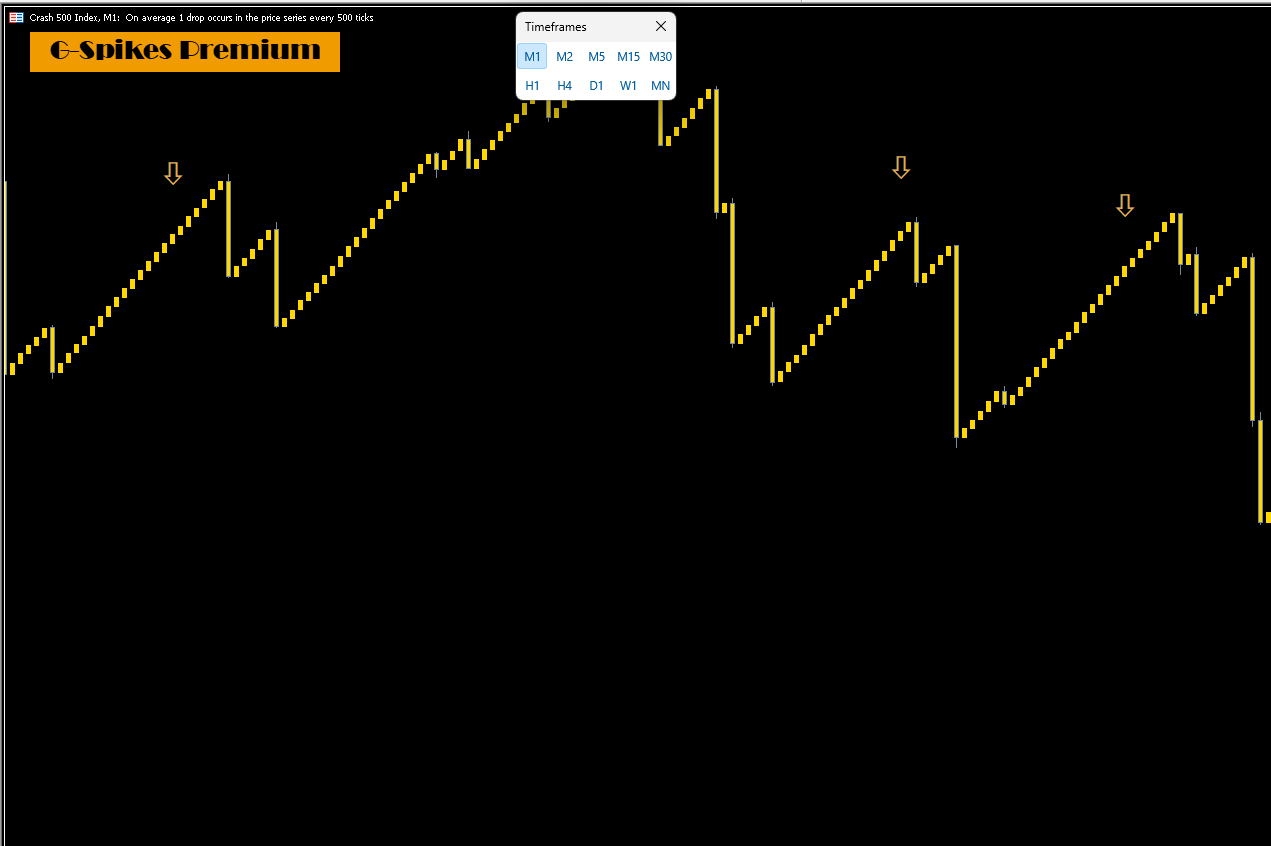
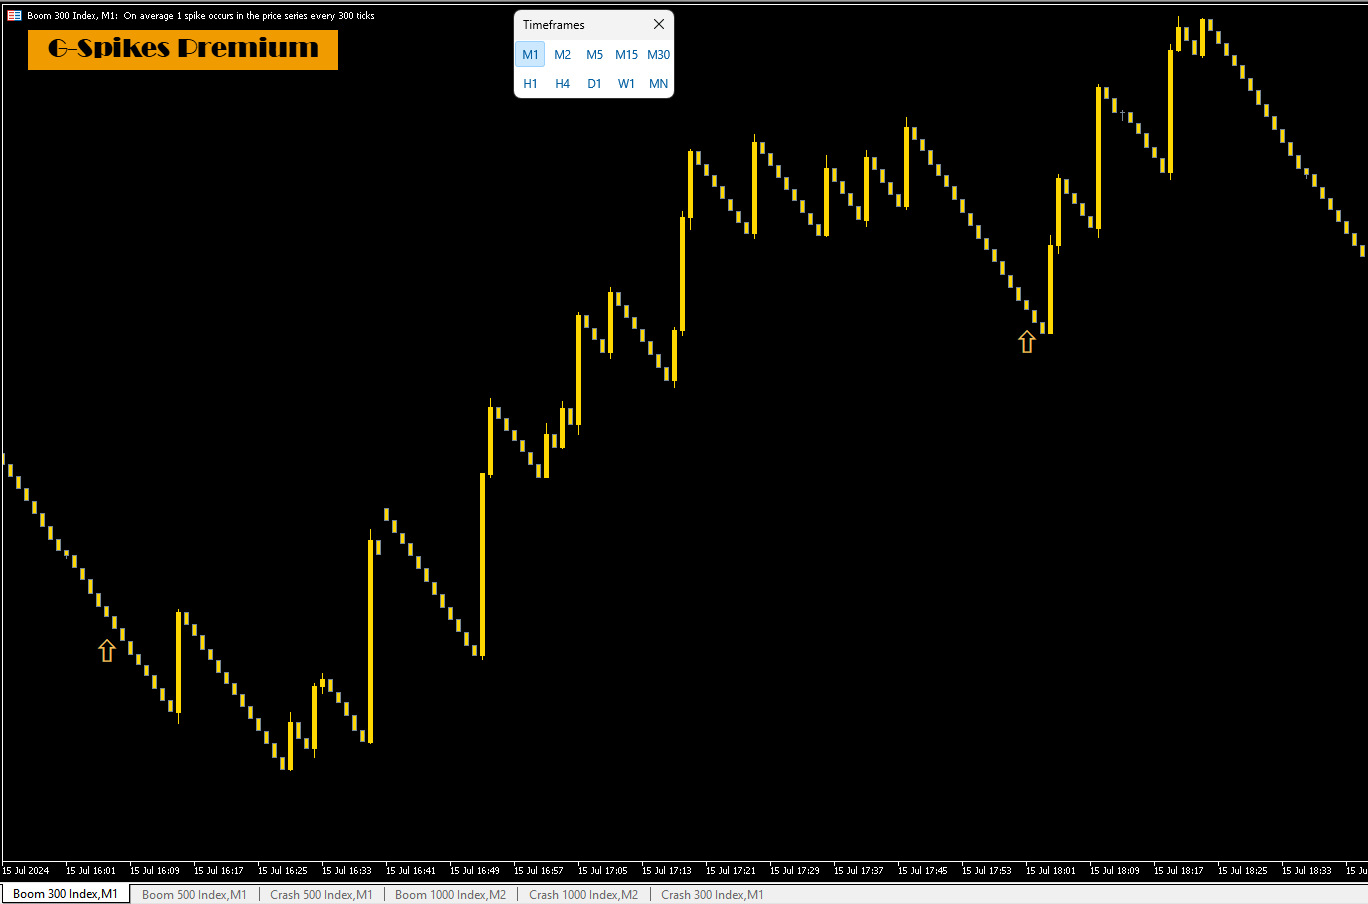
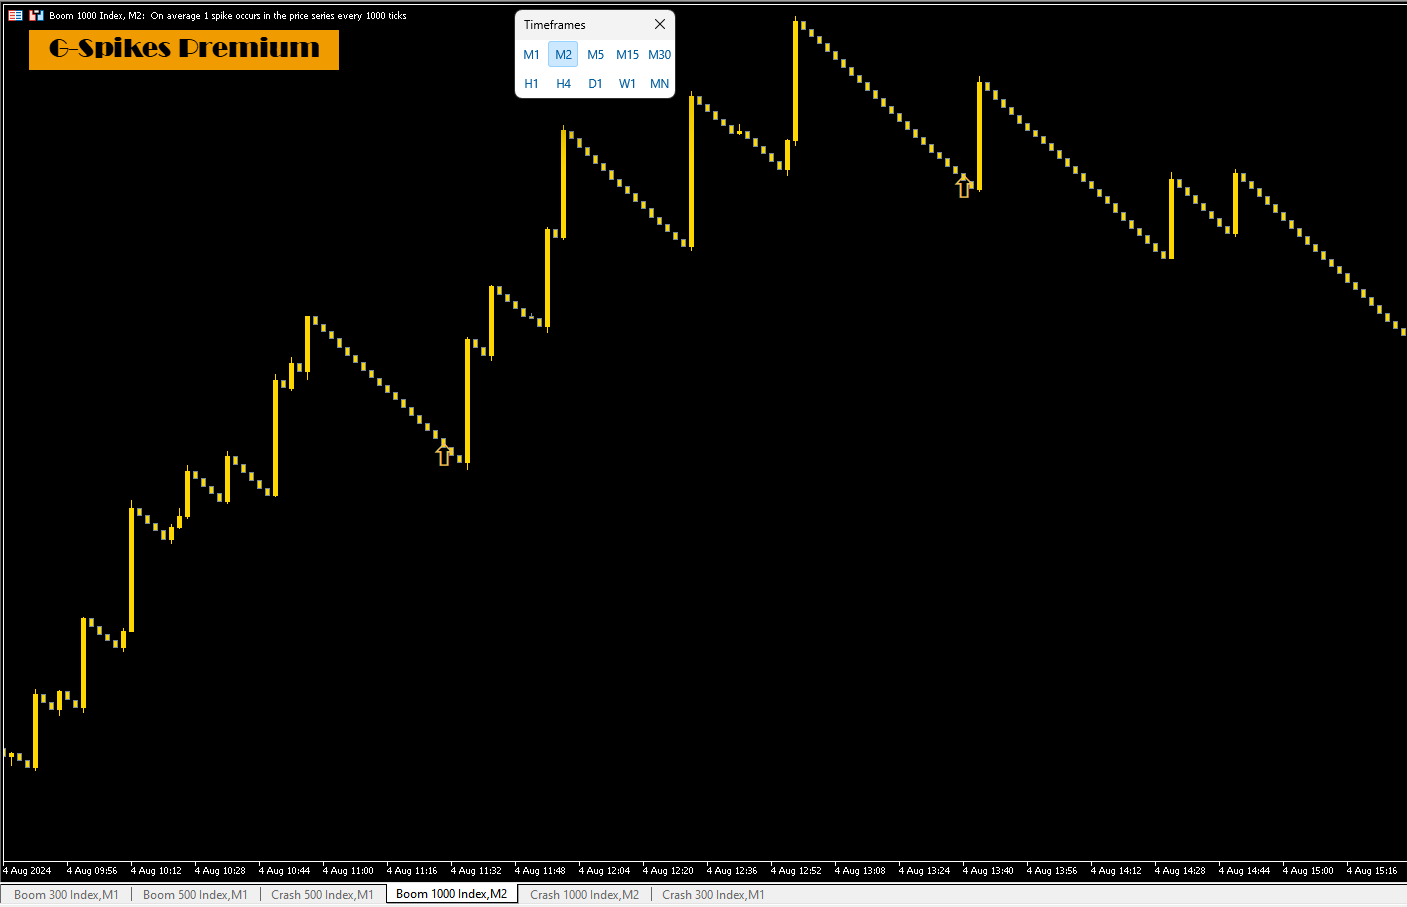
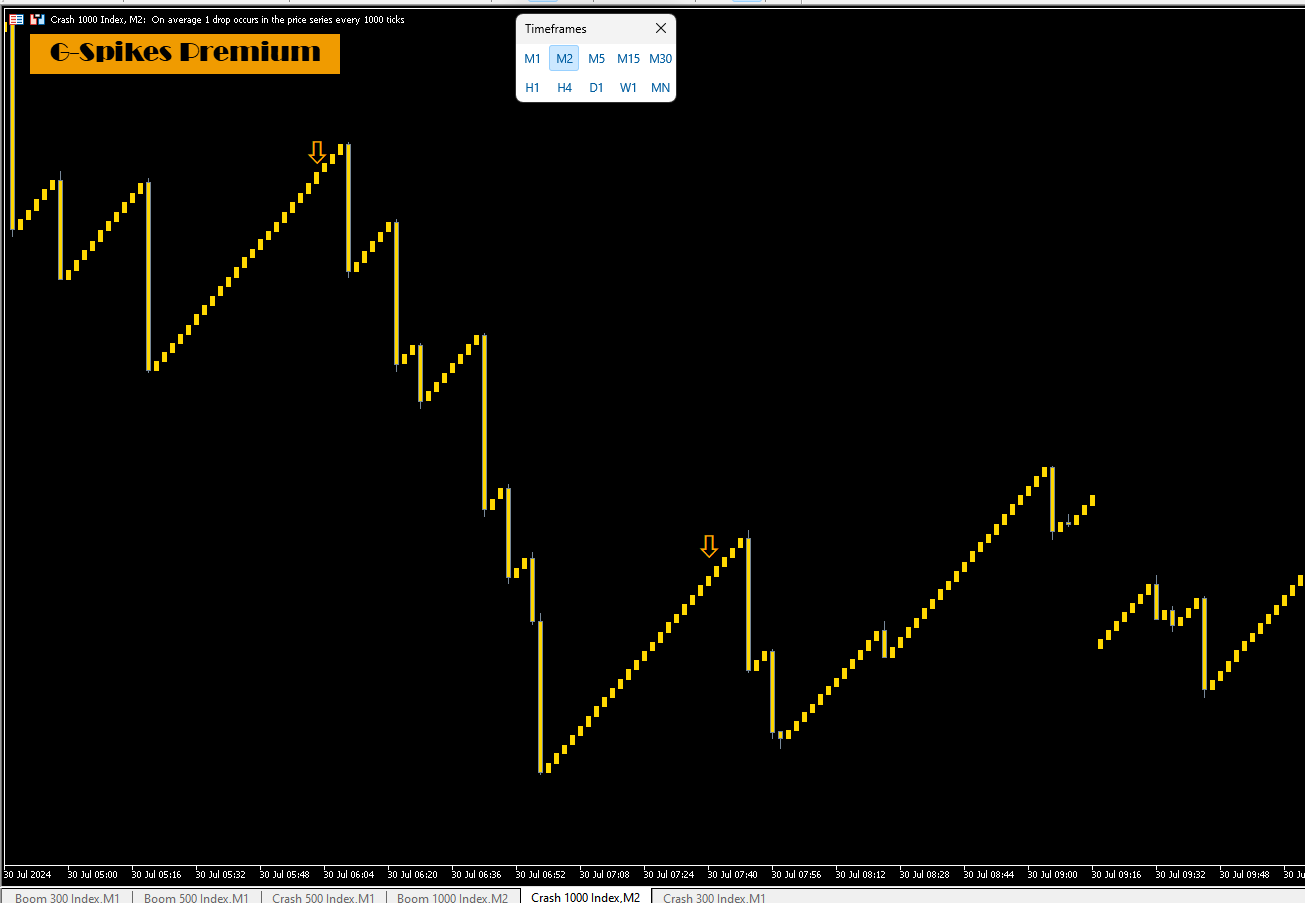
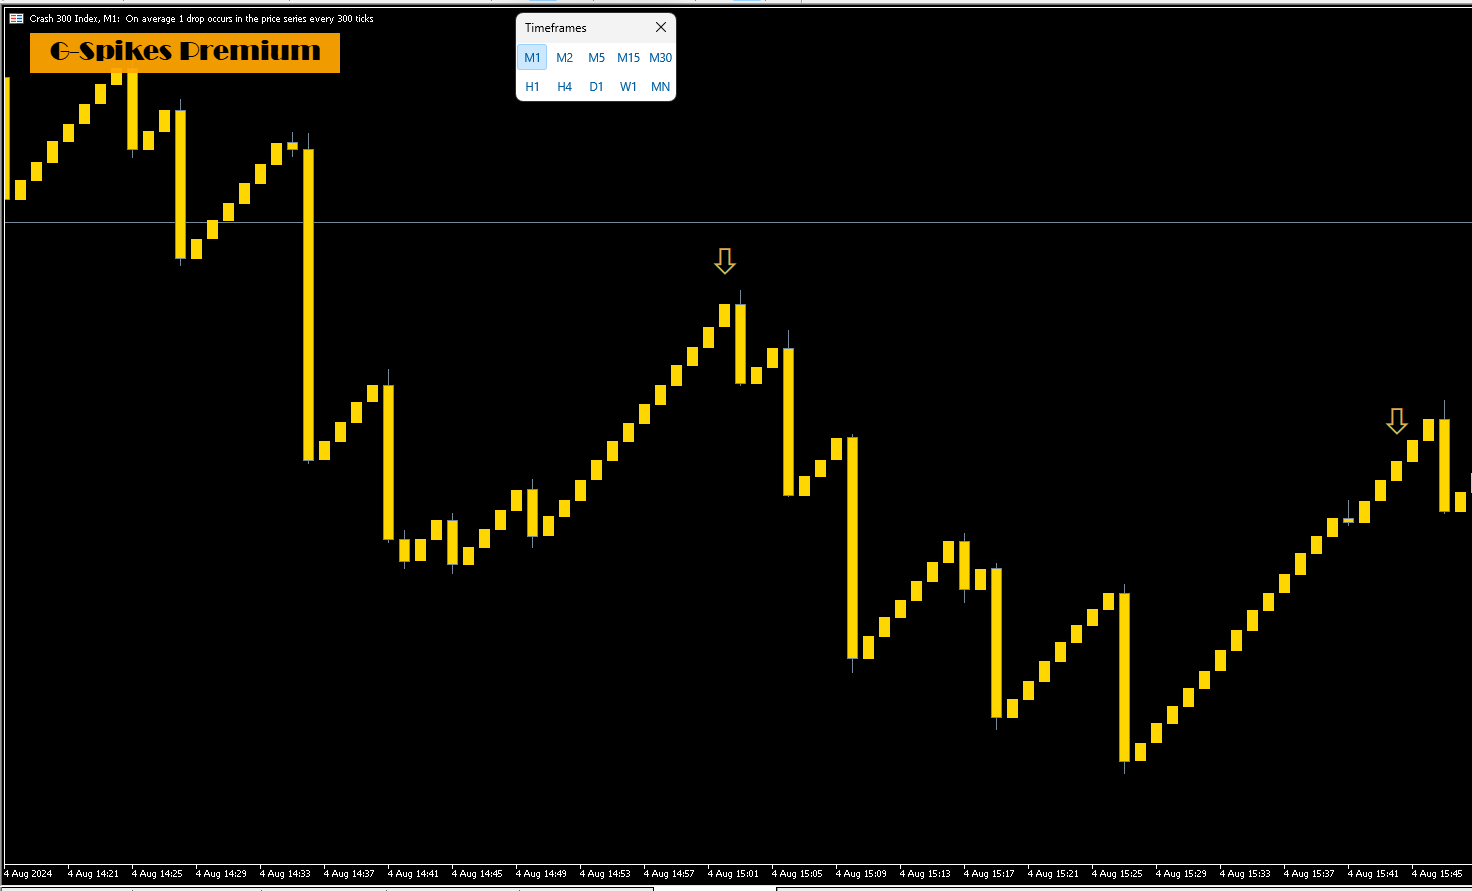
Overview: The Golden Spikes Premium is a groundbreaking trading indicator meticulously crafted for the Boom and Crash indices on the Deriv market. Tailored to meet the needs of discerning traders, this powerful tool operates exclusively on the one-minute timeframe, providing timely and precise signals to maximize your trading potential. The Golden Spikes Detector stands out in its ability to deliver accurate signals, ensuring that you capitalize on market opportunities with confidence and efficiency.

developer: https://t.me/Machofx

Key Features:

  • Precision Signals: The Golden Spikes Detector excels in identifying key market spikes with unparalleled accuracy. This feature allows traders to take advantage of short-term market movements, which is essential for successful Boom and Crash trading.
  • One-Minute Timeframe: Designed specifically for the one-minute timeframe, the Golden Spikes Detector ensures rapid signal generation. This allows for quick decision-making and execution, critical for capturing fleeting market opportunities.
  • High Accuracy: While the signals generated are not overly frequent, they boast an impressive accuracy rate of up to 90%. This high level of precision minimizes the risk of false signals, providing traders with a reliable tool for making informed trading decisions.
  • User-Friendly Interface: The Golden Spikes Detector is easy to set up and use, making it accessible for both novice and experienced traders. Its intuitive design allows for seamless integration into your existing trading strategy.
  • High Performance: Engineered for reliability, the Golden Spikes Detector consistently delivers high-quality signals. This enhances your trading strategy by providing dependable insights into market movements.
  • Customization Options: The indicator comes with various customization settings, allowing traders to tailor it to their specific trading style and preferences. This flexibility ensures that the Golden Spikes Detector can adapt to different market conditions and trading strategies.

Why Choose Golden Spikes Detector?

  • Exclusive Design: The Golden Spikes Detector is created specifically for the Boom and Crash indices on the Deriv platform. This specialized design ensures that the indicator performs optimally within this unique market, providing traders with tailored performance and results.
  • Enhanced Trading: By boosting your trading accuracy and efficiency, the Golden Spikes Detector helps you stay ahead of the market. The precise signals allow you to make well-informed decisions, reducing the likelihood of costly mistakes.
  • Strategic Advantage: Gain a competitive edge with a tool that simplifies complex market analysis. The Golden Spikes Detector makes it easier to spot profitable opportunities, giving you a strategic advantage in your trading endeavors.
  • Risk Management: With its high accuracy rate and reliable signals, the Golden Spikes Detector aids in effective risk management. By providing accurate market insights, the indicator helps you minimize potential losses and maximize gains.
  • Time-Saving: The one-minute timeframe functionality ensures that you receive signals quickly, allowing you to make prompt trading decisions. This time-saving feature is crucial for traders who need to react swiftly to market changes.
  • Comprehensive Support: The Golden Spikes Detector comes with comprehensive support, including detailed user guides and customer service. This ensures that you have all the resources you need to effectively utilize the indicator.

How It Works:

The Golden Spikes Detector employs advanced algorithms to analyze market data and identify potential trading opportunities. The indicator scans the Boom and Crash indices on the Deriv platform, focusing on the one-minute timeframe to capture short-term market movements. When a potential spike is detected, the indicator generates a signal, alerting the trader to a possible trade setup.

Given its high accuracy rate of up to 90%, the Golden Spikes Detector produces fewer but highly reliable signals. This selective approach ensures that traders are not overwhelmed with excessive alerts, allowing them to focus on quality over quantity. Each signal is accompanied by detailed information, including entry and exit points, to assist traders in making informed decisions.

Benefits for Traders:

  • Increased Profitability: The precision and accuracy of the Golden Spikes Detector's signals can lead to increased profitability. By accurately identifying market spikes, traders can enter and exit trades at optimal points, maximizing their potential profits.
  • Reduced Stress: The reliability of the Golden Spikes Detector reduces the stress associated with trading. Knowing that you have a dependable tool for identifying market opportunities allows you to trade with greater confidence and peace of mind.
  • Improved Trading Skills: Using the Golden Spikes Detector can enhance your trading skills. By following the accurate signals and understanding the market movements, you can gain valuable insights and improve your overall trading strategy.
  • Versatility: Whether you are a day trader or prefer a more long-term approach, the Golden Spikes Detector's customization options allow it to fit seamlessly into your trading style. This versatility makes it a valuable addition to any trader's toolkit.
  • Community and Support: Joining the community of Golden Spikes Detector users provides access to a wealth of knowledge and experience. Engaging with other traders can offer new perspectives and strategies, further enhancing your trading success.

Disclaimer:

Trading the Boom and Crash indices involves significant risk, and it is possible to lose all of your invested capital. The Golden Spikes Detector is designed to provide accurate trading signals, but no tool can guarantee 100% accuracy. Past performance is not indicative of future results. Users should exercise caution and ensure they understand the risks involved in trading. It is recommended to use the Golden Spikes Detector in conjunction with a comprehensive trading strategy and to seek professional financial advice if necessary. The creators and distributors of the Golden Spikes Detector are not responsible for any losses incurred while using this tool.

Conclusion:

The Golden Spikes Detector is an indispensable tool for any serious trader focused on the Boom and Crash indices on the Deriv platform. Its combination of precision, high accuracy, and user-friendly design makes it a standout choice for traders seeking to improve their trading outcomes. By delivering fewer but highly reliable signals, the Golden Spikes Detector ensures that you can trade with confidence and efficiency, ultimately leading to greater success in the markets.

Experience the power of precision with the Golden Spikes Detector and take your Boom and Crash trading to the next level. Make every trade count with a tool that is designed to help you succeed.


推荐产品
TrendDetect
Pavel Gotkevitch
The Trend Detect indicator combines the features of both trend indicators and oscillators. This indicator is a convenient tool for detecting short-term market cycles and identifying overbought and oversold levels. A long position can be opened when the indicator starts leaving the oversold area and breaks the zero level from below. A short position can be opened when the indicator starts leaving the overbought area and breaks the zero level from above. An opposite signal of the indicator can
This indicator builds upon the previously posted Nadaraya-Watson smoothers. Here we have created an envelope indicator based on Kernel Smoothing with integrated alerts from crosses between the price and envelope extremities. Unlike the Nadaraya-Watson estimator, this indicator follows a contrarian methodology. Please note that by default this indicator can be subject to repainting. Users can use a non-repainting smoothing method available from the settings. The triangle labels are designed
用於確定平面和趨勢的指標。 如果價格低於兩條直方圖和兩條線(紅色和藍色)中的任何一條,則這是一個賣出區域。 購買此版本的指標時,一個真實賬戶和一個模擬賬戶的 MT4 版本 - 作為禮物(收到,給我寫私信)! 如果價格高於兩條直方圖和兩條線(紅色和藍色)中的任何一條,則這是一個買入區域。 MT4 版本: https://www.mql5.com/en/market/product/3793 如果價格在兩條線之間或在任何直方圖的區域內,那麼市場就沒有明確的趨勢。簡單地說,市場是平的。 指標的工作在屏幕截圖中更清楚地顯示。 該指標可用作獨立的交易系統。該指標可用於獲取領先數據或確定當前趨勢的方向。對於任何級別的交易者來說,這都是一個很好的工具!
Gioteen Volatility Index (GVI) - your ultimate solution to overcoming market unpredictability and maximizing trading opportunities. This revolutionary indicator helps you in lowering your losing trades due to choppy market movements. The GVI is designed to measure market volatility, providing you with valuable insights to identify the most favorable trading prospects. Its intuitive interface consists of a dynamic red line representing the volatility index, accompanied by blue line that indicate
Breakthrough signal indicator for the MT5 platform: Your reliable assistant in the world of trading! We are pleased to present you with an innovative signal indicator, which was created in collaboration with an outstanding mathematician. This indicator combines advanced algorithms and the best of the world of mathematical analysis, providing traders with a unique tool for predicting market movements. Why is this indicator unique? 1 .Entry signals without redrawing If a signal appears, it
Beauty Trend
Nikolay Kositsin
Простой индикатор тренда в NRTR виде с отрисовкой линий стоплосса и тейпрофита, цвет и направление движения которых определяются действующим трендом. Индикатор имеет возможность подавать алерты, отправлять почтовые сообщения и push-сигналы при смене направления тренда. Следует учесть что значение входного параметра индикатора Deviation of the take profit line in points для каждого финансового актива на каждом таймфрейме   необходимо подбирать индивидуально!
PZ Mean Reversion MT5
PZ TRADING SLU
3 (2)
采用专业和量化方法进行均值回归交易的独特指标。它利用了价格以可预测和可衡量的方式转移并返回均值这一事实,这允许明确的进入和退出规则大大优于非量化交易策略。 [ Installation Guide | Update Guide | Troubleshooting | FAQ | All Products ] 清晰的交易信号 非常容易交易 可定制的颜色和尺寸 实现性能统计 优于大多数交易策略 显示合适的止损和止盈水平 它实现了电子邮件/声音/视觉警报 这个怎么运作 该指标从更高的时间范围测量完全可定制的移动平均线的标准偏差,并使用趋势跟踪方法精确地找到交易。交易是通过深入当前图表的价格行为发现的,并在价格返回到平均价格区间时关闭,根据您选择的更高时间范围计算。由于其编码方式,该指标将远离高波动性和强劲趋势市场,并且仅在可预测的情况下进行交易,在可接受的波动性与方向性比率范围内,回归均值是可行的。 指标剖析 绿线是更高时间范围内的移动平均线(也就是平均值) 虚线区域是移动平均线周围的典型价格区间 蓝线是看涨交易的突破价格 红线是看跌交易的突破价格 交易是针对均值进行的,并在
Your Pointer
Nadiya Mirosh
Your Pointer is no ordinary Forex channel. This corridor is built on the basis of the analysis of several candles, starting from the last one, as a result of which the extremes of the studied interval are determined. They are the ones who create the channel lines. Like all channels, it has a middle line as well as a high and low line. This channel is worth watching for its unusual behavior. The use of the Your Pointer indicator allows the trader to react in time to the price going beyond the bo
Renko System
Marco Montemari
This indicator can be considered as a trading system. It offers a different view to see the currency pair: full timeless indicator, can be used for manual trading or for automatized trading with some expert advisor. When the price reaches a threshold a new block is created according to the set mode. The indicator beside the Renko bars, shows also 3 moving averages. Features renko mode median renko custom median renko 3 moving averages wicks datetime indicator for each block custom notificatio
ATR Line
Evgeny Levchenko
The indicator - "ATR Line" determines the current trend and gives signals to buy (green arrow to the top) or sell (red arrow to the bottom). The indicator calculation is based on the deviation of the average price of the instrument from its average true range - ATR. The moving average of prices is used to reduce "market noise". If the main line of the indicator - "ATR Line" is lower the instrument price chart, then the market is in a "bullish" trend. If the main line of the indicator is higher t
Gekko MACD Plus
Rodrigo Galeote
3 (3)
Type: Oscillator This is Gekko's Cutomized Moving Average Convergence/Divergence (MACD), a customized version of the famous MACD indicator. Use the regular MACD and take advantage of several entry signals calculations and different ways of being alerted whenever there is potential entry point. Inputs Fast MA Period: Period for the MACD's Fast Moving Average (default 12); Slow MA Period: Period for the MACD's Slow Moving Average (default 26); Signal Average Offset Period: Period for the Signal
PZ Trend Trading MT5
PZ TRADING SLU
3.67 (3)
许多盈利交易者不仅知道如何识别市场趋势,而且也能把握趋势建立后的交易机会。 Pz 趋势交易 指标设计用来在趋势行情中尽可能的赚取利润。 已建立的趋势提供了一揽子交易机会,但大多数趋势交易指标完全忽视了它们,让交易者在趋势行情时完全不知道该如何做!一般趋势指标只通知有关的趋势变化,但根本不足以得到卓越的回报. Pz 趋势交易 指标比一般趋势指标显示多达 20 倍的交易 , 因为它注重所谓的市场时机。它不仅显示当前的市场趋势,也有回调,内柱线的突破和调整。它令您在趋势回调之后介入,安全的柱线内突破金字塔加仓,以及发现潜在的反转,和已知的调整。 趋势改变 一个趋势改变在市场方向变化时发生。趋势变化在图表上用带数字的彩色圆圈显示。蓝色 (1) 信号为上涨开始, 而红色 (1) 信号为下跌开始。趋势变化并非评估当前价格动作的结果, 它意味着交易设置是不定时地。如果您正确使用本指标, 在趋势变化时, 您将将已经入场 (参看下面的调整)。 回调 但凡趋势在运动中,行情上下抖动,盈利者收割利润,且其它参与者入场。趋势回调代表好的买入机会,通常是由主力获利离场导致。如果行情在回调后回归上行, 指
ATrend
Zaha Feiz
4 (1)
ATREND: 工作原理及使用方法 工作原理 “ATREND”指标针对MT5平台设计,旨在通过结合多种技术分析方法为交易者提供强有力的买卖信号。该指标主要利用平均真实波幅(ATR)来测量波动性,并结合趋势检测算法来识别潜在的市场动向。 购买后请留言,您将获得特别的赠品。 剩余8份,售价39美元。 主要特点: - 动态趋势检测:该指标评估市场趋势并相应调整信号,帮助交易者与当前市场条件对齐策略。 - 波动性测量:通过使用ATR,该指标衡量市场波动性,这对于确定最佳止损(SL)和止盈(TP)水平至关重要。 - 信号可视化:该指标在图表上直观地表示买卖信号,增强交易者的决策能力。 操作步骤 输入和设置: - 时间框架:此输入允许您设置指标计算的主要时间框架,默认值为15分钟。 - 时间框架2:此输入可用于定义额外分析的辅助时间框架,默认值为1分钟。 - 移动:此参数允许您将指标的计算向回移动,默认值为0。 - SLATR:此输入定义用于根据ATR计算止损水平的乘数,默认值为2.56。 - TPATR:此输入定义用于根据ATR计算止盈水平的乘数,默认值也为2.56。 - Alerts
Gekko RSI Plus
Rodrigo Galeote
This is Gekko's Cutomized Relative Strength Index (RSI), a customized version of the famous RSI indicator. Use the regular RSI and take advantage two entry signals calculations and different ways of being alerted whenever there is potential entry or exit point. Inputs Period: Period for the RSI calculation; How will the indicator calculate entry (swing) signals: 1- Produces Exit Signals for Swings based on RSI entering and leaving Upper and Lower Levels Zones; 2- Produces Entry/Exit Signals fo
Supertrend indicator uses a combination of a moving average and average true range to detect the trend of a trading instrument. Supertrend indicator for MetaTrader 5 easily shows the trend as a line following the price. Triple SuperTrend Histo indicator  calculate  three supertrends to show the trend as a histogram. Changing the color from red to green means you can BUY , from green to red means you can SELL . Description of the method of drawing a histogram. The price is above the EMA 20
MetaCOT 2 is a set of indicators and specialized utilities for the analysis of the U.S. Commodity Futures Trading Commission reports. Thanks to the reports issued by the Commission, it is possible to analyze the size and direction of the positions of the major market participants, which brings the long-term price prediction accuracy to a new higher-quality level, inaccessible to most traders. These indicators, related to the fundamental analysis, can also be used as an effective long-term filter
Hush mt5
Iurii Plokhov
4.33 (3)
Hush mt5 is an advanced indicator that gives a signal about the overbought or oversold market in a certain period of time Hush mt5 the advantage of this indicator is that it does not disappear after the signal on the chart Suitable for any trade: forex, stocks, cryptocurrency, metals Hush mt5 can be used on any time period. The signal goes to the beginning of the next candle after the arrow Hush mt5 performed best on the period H1,H4,daily It can be used in addition to forex, in binar
Blahtech Market Profile MT5
Blahtech Limited
5 (9)
Was: $249  Now: $99   Market Profile defines a number of day types that can help the trader to determine market behaviour. A key feature is the Value Area, representing the range of price action where 70% of trading took place. Understanding the Value Area can give traders valuable insight into market direction and establish the higher odds trade. It is an excellent addition to any system you may be using. Inspired by Jim Dalton’s book “Mind Over Markets”, this indicator is designed to suit the
Price Channel Premium
Ignacio Agustin Mene Franco
PriceChannel! It is an indicator programmed to capture floor entries and ceiling sales! gives multiple inputs according to the temporality that you use it works for support and resistance too! It works in any temporality, works for forex currency markets ! for the pairs of synthetic indices ! Ideal for volatility and jumps! It also works for crash and boom! Good Profit, World Investor.
Nrha
Ratna Purwantari
This indicator uses Fibonacci to determine your trading levels precisely and measurably. It helps you to earn big profits. This indicator can also be used for various currency charts. You can also combine it with other indicators that you like so that the profits you get are also even greater. I hope you give me input so that this indicator can be better. We recommend using for the period M1 to M15. feel free to discuss with me. Thanks. 
Introduction Excessive Momentum Indicator is the momentum indicator to measure the excessive momentum directly from raw price series. Hence, this is an extended price action and pattern trading. Excessive Momentum Indicator was originally developed by Young Ho Seo. This indicator demonstrates the concept of Equilibrium Fractal Wave and Practical Application at the same time. Excessive Momentum detects the market anomaly. Excessive momentum will give us a lot of clue about potential reversal and
Go Way TREND
Ywsf Hsyn Hmad Alrsh
順應潮流。是的,在 15 分鐘的框架上等待進場信號,無論是買入還是賣出,並檢查信號是否出現在 30 分鐘的框架上(有時信號需要一個小時或更長時間才會出現。您可以返回到15分鐘框架並返回到30分鐘框架,重複此操作,直到主要訊號出現在您面前。被記錄,或當相反的訊號出現時它非常簡單並且適用於所有主要貨幣。  金屬、指標和所有框架,但最好的結果是 30 分鐘框架。 始終將止損設置在蠟燭底部下方,資金管理不得超過 資本的10% 順應潮流。是的,在 15 分鐘的框架上等待進場信號,無論是買入還是賣出,並檢查信號是否出現在 30 分鐘的框架上(有時信號需要一個小時或更長時間才會出現。您可以返回到15分鐘框架並返回到30分鐘框架,重複此操作,直到主要訊號出現在您面前。被記錄,或當相反的訊號出現時它非常簡單並且適用於所有主要貨幣。  金屬、指標和所有框架,但最好的結果是 30 分鐘框架。 始終將止損設置在蠟燭底部下方,資金管理不得超過 資本的10% 順應潮流。是的,在 15 分鐘的框架上等待進場信號,無論是買入還是賣出,並檢查信號是否出現在 30 分鐘的框架上(有時信號需要一個小時或更長時
The indicator detects divergence signals - the divergences between the price peaks and the MACD oscillator values. The signals are displayed as arrows in the additional window and are maintained by the messages in a pop-up window, e-mails and push-notifications. The conditions which formed the signal are displayed by lines on the chart and in the indicator window. The indicator parameters MacdFast - fast MACD line period MacdSlow - slow MACD line period MacdSignal - MACD signal line period Mac
Terra Infinity
Ivan Simonika
Terra Infinity is a flat indicator. This improved version of the CalcFlat indicator has three additional lines that significantly increase its effectiveness. Unlike its predecessor with two static levels, Terra Infinity adds three dynamic lines above the main histogram, which are interpreted as follows: base signal line, minimum signal line, maximum signal line. These lines are formed using the additional parameter Avg, which is the average value of the histogram. Averaging produces a line
This is my version of Currency Strength Meter.  One of the best indicators for spotting weak and strong currencies. Based on the information obtained, its very simple to decide which currency buy and which sell.  It is very simple to use, but extremely effective.  General rules are: - Buy currencies above level 0  - Sell currencies below level 0 You can also mix the main currencies together -->  EURUSD > 0 and USDJPY < 0  --> BUY on EURJPY 
FREE
RevCan Trend Entry MT5
A K M Syedur Rahman
5 (1)
[75% OFF - SALE ENDS SOON] - RevCan Trend Entry Point   is a trend based trade alert indicator for serious traders. It does all the price and chart analysis all by itself, and whenever it finds any potential high quality trading opportunity(Buy or Sell) using its revolutionized price prediction algorithms, it sends instant trade alert directly on the chart, MT4 terminal and on the mobile device.  The trade signals will be visible on the chart as Up and Down arrows, while the instant audible ale
Pullback Hunter
Anton Polkovnikov
PULLBACK HUNTER (回调猎手) 每个交易员的终极梦想是什么?要毫不迟疑地看到反转将在哪里发生。当然,这也是一种魔法,虽然... 没有什么是不可能的。但与此同时,我为你准备了一个指标,它可以实时标记当前运动的修正结束,或者简而言之,它可以捕捉到反转的情况。什么是主旨?许多人在价格向开仓方向移动时练习反弹。他们在新极点的形成过程中这样做。一切都很好,但在这种情况下,头寸的加权平均价格并不理想。但如果我们等待回调并在趋势中买入,我们将获得一个良好的平均价格。这个指标显示了矫正运动可能结束的地方。 什么是重要的?不建议 "正面 "使用指示器。也就是说,在向上的箭头上买入,等待向下的箭头来关闭购买。指标的最佳用途是设定一个位置。通过这个额外的工具,你可以过滤你的方向,并在箭头上买入(或做空)被过滤的方向。例如,你使用累积三角洲。它向你展示了整个市场的购买情况。你等待上升的箭头,然后买入。使用额外的分析工具来退出头寸。 该指标的原理是什么?箭头是价格测试支撑或阻力水平的地方。这些水平是由指标内部的算法计算出来的。一个相同的蜡烛图可能同时测试几个支撑位。这可以通过箭头的颜色看出。如果烛
ACB Breakout Arrows MT5
KEENBASE SOFTWARE SOLUTIONS
5 (1)
The ACB Breakout Arrows indicator provides a crucial entry signal in the market by detecting a special breakout pattern. The indicator constantly scans the chart for a settling momentum in one direction and provide the accurate entry signal right before the major move. Get multi-symbol and multi-timeframe scanner from here - Scanner for ACB Breakout Arrows MT 5 Key features Stoploss   and Take Profit levels are provided by the indicator. Comes with a MTF Scanner dashboard which tracks the br
Smart M Concept MT5
Andrei Novichkov
Our new indicator is an important part of the Smart Money Concepts (SMC) system It uses a modern market vision and fast calculation methods. As a result, the trader has a complete picture of the trade at every moment in time, which makes the process of obtaining results easier and faster. Our new indicator displays the following important patterns:   Order Blocks. Imbalance – Fair Value Gap (FVG). Break Of Structures (BoS). Change of character (CHoCH). Equal highs & lows. Premium , Equili
Automated Trendlines MT5
Georgios Kalomoiropoulos
趋势线是外汇交易中最重要的技术分析工具。不幸的是,大多数交易者没有正确绘制它们。自动趋势线指标是专业交易者的专业工具,可帮助您可视化市场的趋势运动。 有两种类型的趋势线看涨趋势线和看跌趋势线。 在上升趋势中,外汇趋势线是通过价格变动的最低摆动点绘制的。 连接至少两个“最低点”将创建一条趋势线。 在下跌趋势中,趋势线是通过价格走势的最高摆动点绘制的。 连接至少两个“最高点”将创建一条趋势线。 趋势线何时突破? 当看跌蜡烛收于看涨​​趋势线下方并且蜡烛的高点在趋势线上方时,看涨趋势线会被打破。 当看涨蜡烛收于看跌趋势线上方并且蜡烛的低点低于趋势线时,看跌趋势线会被打破。 趋势线何时删除? 当一根完整的蜡烛在看涨趋势线下方形成时,看涨趋势线将被删除。 当完整的蜡烛在看跌趋势线上方形成时,看跌趋势线将被删除。 您可以从输入参数更改看涨和看跌趋势线的颜色和宽度。
该产品的买家也购买
Atomic Analyst MT5
Issam Kassas
4.79 (19)
首先值得强调的是,该交易指标是非重绘、非延迟的指标,这使其成为手动和机器人交易的理想选择。 用户手册:设置、输入和策略。 Atomic Analyst是一种PA价格行动指标,利用价格的力量和动量来寻找市场上更好的机会。配备了高级过滤器,可帮助去除噪音和假信号,并提高交易潜力。使用多层复杂的指标,Atomic Analyst扫描图表,并将复杂的数学计算转化为任何初学者都能理解并用来做出一致交易决策的简单信号和颜色。 “Atomic Analyst”是专为新手和经验丰富的交易者量身定制的综合交易解决方案。它将高级指标和一流功能融合为一体的交易策略,使其成为所有类型交易者的多功能选择。 日内交易和剥头皮策略:专为快速准确的日内交易和短期交易而设计。 日内和摆动交易策略:可用作追求价格大幅波动的日内和摆动交易者的可靠工具。 多货币和市场:凭借其可靠的精度,在不同的工具和市场上运作。 多个时间框架:可在多个时间框架上使用,性能良好。 稳定性:所有指标均不重绘、不重绘和不滞后,确保可靠的信号。 信号清晰度:提供箭头信号,用于清晰的入场和出场点。 实时警报:通过交易入场、SL和TP警报通知交
首先,值得强调的是,这个交易系统是一个非重绘、非重画和非滞后的指标,这使得它非常适合手动和机器人交易。 在线课程,手册和下载预设。 “智能趋势交易系统 MT5”是专为新手和经验丰富的交易者量身定制的综合交易解决方案。它结合了超过 10 个优质指标,具有 7 多个强大的交易策略,使其成为适用于各种市场条件的多功能选择。 趋势跟随策略:提供精确的入场和止损管理,以有效地跟随趋势。 反转策略:识别潜在的趋势反转,使交易者能够利用区域市场的机会。 剃头策略:专为快速准确的日内交易和短期交易而设计。 稳定性:所有指标都不会重绘、不会重画和不会滞后,确保可靠的信号。 定制:支持自定义策略,以满足个人交易偏好。超过 7 种策略和组合可帮助您找到最佳策略。 信号清晰度:提供箭头信号,以指示清晰的入场和退出点。 实时警报:通过交易进出警报使交易者保持了解。 深入分析:提供更高时间框架的趋势分析和实时交易监控。 自适应颜色编码:利用蜡烛颜色编码来显示成交量、趋势和反转蜡烛信号。通过蜡烛颜色分析市场方向。 “智能趋势交易系统 MT5”赋予交易者必要的工具,以便在各种市场条件下做出明智和战略性的交易决策。无论
TPSpro RFI Levels MT5
Roman Podpora
4.67 (9)
Reversal First Impulse levels (RFI)      INSTRUCTIONS        RUS       -       ENG              R ecommended to use with an indicator   -   TPSpro  TREND PRO -  Version MT4                 A key element in trading is zones or levels from which decisions to buy or sell a trading instrument are made. Despite attempts by major players to conceal their presence in the market, they inevitably leave traces. Our task was to learn how to identify these traces and interpret them correctly. Main functi
首先,值得强调的是,这个交易工具是非重绘、非重画和非滞后的指标,非常适合专业交易。 在线课程,用户手册和演示。 智能价格行动概念指标是一个非常强大的工具,既适用于新手,也适用于经验丰富的交易者。它将超过20个有用的指标合并到一个指标中,结合了高级交易思想,如内圈交易员分析和智能资金概念交易策略。该指标侧重于智能资金概念,提供有关大型机构交易方式的见解,帮助预测它们的动向。 它在流动性分析方面尤其擅长,有助于理解机构的交易方式。它擅长预测市场趋势,并仔细分析价格波动。通过将您的交易与机构策略对齐,您可以更准确地预测市场走向。该指标多才多艺,擅长分析市场结构,识别重要的订单区块,并识别各种模式。 它擅长识别BOS和CHoCH等模式,理解动量的转变,并突出显示供需强劲的关键区域。它还擅长发现强大的不平衡,并分析价格创造更高高点或更低低点的模式。如果您使用斐波那契回撤工具,该指标可以满足您的需求。它还可以识别相等的高点和低点,分析不同的时间框架,并通过仪表板显示数据。 对于使用更高级策略的交易者,该指标提供了工具,如公平价值差指标和优惠和折扣区域的识别。它特别关注高时间框架订单
Entry Points Pro for MT5
Yury Orlov
4.56 (163)
这款指标用于 MT5,可提供准确的入场交易信号,且无重绘。 它可应用在任何金融资产:外汇、加密货币、贵金属、股票、指数。 它将提供极其精准的评估,并告诉您何时开仓和平仓的最佳时机。 观看 视频 (6:22),其中包含一个仅处理单一信号的示例,该信号即可值回指标购价! 大多数交易者在 Entry Points Pro 指标的帮助下,在第一个交易周内即改善了他们的交易结果。 订阅我们的 Telegram 群 ! Entry Points Pro 指标的益处。 入场信号无重绘 如果信号出现,并得到确认,则它不会再消失;不像是重绘指标,它会导致重大的财产损失,因为它们可以在显示信号后再将其删除。 无差错开仓 指标算法可令您找到入场交易(买入或卖出资产)的理想时机,从而提高每位交易者的成功率。 Entry Points Pro 可操作任何资产 它允许您在 MT5 平台上交易任何经纪商的加密货币、股票、贵金属、指数、大宗商品和货币。 提供任何方向的信号 Entry Points Pro 指标提供针对任意价格走势的入场交易信号 - 上涨、下跌或横盘(横向)。
Quantum Trend Sniper
Bogdan Ion Puscasu
4.92 (48)
介绍   量子趋势狙击指标 ,突破性的 MQL5 指标,正在改变您识别和交易趋势反转的方式!由拥有超过13年交易经验的资深交易员团队开发,     量子趋势狙击指标   旨在通过其创新的方式以极高的准确度识别趋势反转,将您的交易之旅推向新的高度。 ***购买量子趋势狙击指标,即可免费获得量子突破指标!*** 当量子突破指标识别出趋势反转时,它会向您发出警报和信号箭头,并建议您三个止盈水平。 它既适合新手交易者,也适合专业交易者。 量子 EA 通道:       点击这里 MT4版本:       点击这里 建议: 时间范围: 所有时间范围。为了获得最佳结果,我们建议在 M15、M30 和 H1 时间范围内使用它。 货币对:欧元兑美元、英镑兑美元、澳元兑美元、欧元兑英镑、, EURAUD,  XAUUSD 账户类型:ECN、Raw 或 Razor,点差极低 经纪时间:任意 经纪商:IC Markets、Pepperstone with Raw 和 Razor 的点差最低 建议止损:50 点 建议止盈水平:20 点、50 点和
FX Power MT5 NG
Daniel Stein
5 (6)
通过 mql5 和 Telegram 上 的晨间简报获取每日市场更新,包括详细信息和屏幕截图 ! FX Power MT5 NG 是我们长期以来非常受欢迎的货币强度计算器 FX Power 的下一代产品。 这款下一代强度计算器能提供什么?您所喜爱的原版 FX Power 的所有功能 附加功能 黄金/XAU 强度分析 更精确的计算结果 可单独配置的分析周期 可自定义计算限制,以获得更好的性能 为希望查看更多信息的用户提供特殊的多实例设置 无尽的图形设置,可在每个图表中设置您最喜欢的颜色 无数的通知选项,让您再也不会错过任何重要信息 采用 Windows 11 和 macOS 风格的全新圆角设计 神奇的移动指标面板 FX Power 主要功能 所有主要货币的完整强势历史 所有时间框架内的货币强弱历史 所有经纪商和图表的计算结果完全相同 100% 可靠的实时计算 -> 无重绘 可通过下拉列表选择分析时段 通过自定义模式单独配置分析时段 可在一个图表中使用多个实例 可移动 FX Power 显示屏(通过拖放) 适用于高分辨率 QHD、UHD 和 4K 显示器 自动终端配置 针对平板电脑
FX Volume MT5
Daniel Stein
4.94 (17)
通过 mql5 和 Telegram 上 的 " 晨间简报 "获取每日市场更新,包括详细信息和屏幕截图 ! 外汇交易量(FX Volume)是第一个也是唯一一个从经纪商角度真正洞察市场情绪的交易量指标。 直接在您的图表上看到这些信息是真正改变游戏规则和突破性的交易解决方案。 受益于独特的市场数据洞察,如 比率(Ratios )显示货币多头和空头头寸的比率(百分比 比率变化 显示所选时间段内的多头比率及其百分比变化 总交易量 显示货币的总交易量(多头和空头),以手为单位 多头 交易量显示货币所有多头头寸的交易量 空头 交易量显示所有货币空头头寸的交易量 净多头 显示净多头交易量,即所有多头头寸减去所有空头头寸(以手为单位)。 净多头百分比 显示货币净多头交易量的变化 请阅读我们的基本教程 -> "如何使用外汇交易量进行交易 " 获取更多信息,如常见问题、交易技巧和教程视频,请访问我们的 外汇交易量公共信息频道 请 安装并运行 SI Connect 以建立与我们数据中心的持续连接 背景信息 我们都知道,外汇是一个分散的市场。这就是为什么我们必须打破常规思维,开发一个独
XQ Indicator MetaTrader 5
Marzena Maria Szmit
3.5 (2)
Step into the realm of Forex trading with confidence and precision using XQ, a cutting-edge Forex indicator designed to elevate your trading game to unprecedented heights. Whether you're a seasoned trader or just stepping into the world of currency exchange, XQ Forex Indicator empowers you with the insights and signals needed to make informed trading decisions. The signal conditions are a combination of three indicators, and XQ Forex Indicator only display  medium and long-term trends . The ind
该仪表盘显示所选符号的最新可用谐波形态,因此您可以节省时间并提高效率 /  MT4 版本 。 免费指标:  Basic Harmonic Pattern 指标列 Symbol:   显示所选符号 Trend:     看涨或看跌 Pattern:    形态类型(Gartley、蝴蝶、蝙蝠、螃蟹、鲨鱼、Cypher 或 ABCD) Entry:     入口价格 SL: 止损价 TP1: 第一止盈价 TP2: 第二次获利价格 TP3: 第三次获利价格 Current price:    当前价格 Age (in bars):   最后绘制的模式的年龄 主要输入 Symbols :   从 "28 种主要货币对 "或 "选定符号 "中选择。 Selected Symbols :   希望监控的符号,用逗号分隔("EURUSD,GBPUSD,XAUUSD")。如果您的经纪商为货币对设置了后缀或前缀,您必须在以下两个参数中添加(货币对前缀或货币对后缀)。 Max Iteration:   调整模式的最大迭代次数(如果该值越小,则模式越少,性能越快;如果该值越大,则模式越多,性能
TrendMaestro5
Stefano Frisetti
note: this indicator is for METATRADER4, if you want the version for METATRADER5 this is the link:  https://www.mql5.com/it/market/product/108106 TRENDMAESTRO ver 2.4 TRENDMAESTRO recognizes a new TREND in the bud, he never makes mistakes. The certainty of identifying a new TREND is priceless. DESCRIPTION TRENDMAESTRO identifies a new TREND in the bud, this indicator examines the volatility, volumes and momentum to identify the moment in which there is an explosion of one or more of these data a
Gartley Hunter Multi
Siarhei Vashchylka
5 (8)
Gartley Hunter Multi - An indicator for searching for harmonic patterns simultaneously on dozens of trading instruments and on all possible timeframes. Manual (Be sure to read before purchasing) | Version for MT4 Advantages 1. Patterns: Gartley, Butterfly, Shark, Crab. Bat, Alternate Bat, Deep Crab, Cypher 2. Simultaneous search for patterns on dozens of trading instruments and on all possible timeframes 3. Search for patterns of all possible sizes. From the smallest to the largest 4. A
RelicusRoad Pro MT5
Relicus LLC
5 (23)
现在$ 147(更新后增加到$ 499) - 无限帐户(PC或Mac) RelicusRoad 用户手册 + 培训视频 + 访问 Private Discord Group + VIP 身份 一种看待市场的新方式 RelicusRoad 是世界上最强大的外汇、期货、加密货币、股票和指数交易指标,为交易者提供保持盈利所需的所有信息和工具。我们提供技术分析和交易计划,帮助每一位交易者取得成功,从初学者到高级。它是一个关键的交易指标,可以提供足够的信息来预测未来的市场。我们相信一个完整的解决方案,而不是图表上几个没有意义的不同指标。这是一个多合一指标,显示无与伦比且非常准确的信号、箭头 + 价格行为信息。 RelicusRoad 基于强大的人工智能,提供缺失的信息和工具来教育您并使您成为交易专家,成为成功的交易者。 几乎所有技术指标都滞后,这意味着它们只能报告已经发生的事情。因此,他们只确认您过去可以看到的价格已经在哪里。我们相信领先指标可以预测未来价格,而无需重新绘制,也不要过度依赖可能改变并导致重新绘制的滞后指标。如果您根据滞后指标进行交易并建立头寸,您就知道您已
PZ Support Resistance MT5
PZ TRADING SLU
4.17 (6)
厌倦了绘制支撑线和阻力线? 支撑阻力 是一个多时间指标,可以自动检测并绘制图表中的支撑线和阻力线,并具有非常有趣的变化:随着时间的推移测试价格水平及其重要性的提高,线变得越来越粗。 [ 安装指南 | 更新指南 | 故障排除 | 常见问题 | 所有产品 ] 一夜之间增强您的技术分析 无需浏览图表即可检测重要的价格水平 一目了然地识别所有价格水平的相对优势 每次交易最多可节省半小时的绘图线 指标显示所有价格水平的期限 指示器不重涂 过去和现在的价格水平因接近程度而崩溃,并根据当前的市场行为进行了调整。在动作发生的地方绘制了线条,而不一定在峰值处绘制了线条。 价格水平随着时间的推移而被拒绝,变得越来越暗 定期清除不重要的价格水平以避免噪音 可自定义的时间范围选择和崩溃因子 它实现了电子邮件/声音/推送警报的突破 输入参数 指标设置:指标将从当前时间段读取价格,但您可以选择另一个。例如,您可以在H4图表中显示D1支撑线和阻力线。您还可以使用 价格水平密度 参数选择在图表上显示多少价格水平。 颜色设置:根据重要性输入所需的支撑线和阻力线颜色。 标签设置:(可选)可以在指示器
Introduction to X3 Chart Pattern Scanner X3 Cherart Pattern Scanner is the non-repainting and non-lagging indicator detecting X3 chart patterns including Harmonic pattern, Elliott Wave pattern, X3 patterns, and Japanese Candlestick patterns. Historical patterns match with signal patterns. Hence, you can readily develop the solid trading strategy in your chart. More importantly, this superb pattern scanner can detect the optimal pattern of its kind. In addition, you can switch on and off individu
Volume by Price MT5
Brian Collard
3.6 (5)
The Volumebyprice.com Indicator for MetaTrader 5 features Volume Profile and Market Profile TPO (Time Price Opportunity). Volume and TPO histogram bar and line charts. Volume Footprint charts. TPO letter and block marker collapsed and split structure charts. Static, dynamic and flexible range segmentation and compositing methods with relative and absolute visualizations. Session hours filtering and segment concatenation with Market Watch and custom user specifications. Graphical layering, posit
Volatility Trend System - a trading system that gives signals for entries. The volatility system gives linear and point signals in the direction of the trend, as well as signals to exit it, without redrawing and delays. The trend indicator monitors the direction of the medium-term trend, shows the direction and its change. The signal indicator is based on changes in volatility and shows market entries. The indicator is equipped with several types of alerts. Can be applied to various trading in
Auto Order Block with break of structure based on ICT and Smart Money Concepts (SMC) Futures Break of Structure ( BoS )             Order block ( OB )            Higher time frame Order block / Point of Interest ( POI )    shown on current chart           Fair value Gap ( FVG ) / Imbalance   -  MTF      ( Multi Time Frame )    HH/LL/HL/LH  -  MTF      ( Multi Time Frame )  Choch  MTF      ( Multi Time Frame )  Volume Imbalance     ,  MTF          vIMB Gap’s Power of 3 Equal High
Order Block Hunter MT5
Noha Mohamed Fathy Younes Badr
5 (1)
Order block hunter indicator is the best indicator for  hunt the order blocks that area where there has been a large concentration of limit orders waiting to be executed Order blocks are identified on a chart by observing previous price action and looking for areas where the price experienced significant movement or sudden changes in direction .This indicator does that for you by using very complicated codes and helps you to take the best areas To buy and sell because it make marks at the best a
Blahtech Supply Demand MT5
Blahtech Limited
4.54 (13)
Was: $299  Now: $99   Supply Demand uses previous price action to identify potential imbalances between buyers and sellers. The key is to identify the better odds zones, not just the untouched ones. Blahtech Supply Demand indicator delivers functionality previously unavailable on any trading platform. This 4-in-1 indicator not only highlights the higher probability zones using a multi-criteria strength engine, but also combines it with multi-timeframe trend analysis, previously confirmed swings
Gold TMAF MTF - 这是一个最佳股票技术指标。该指标算法分析资产的价格走势,并反映波动性和潜在进入区域。 最佳指标信号: - 卖出 = TMA2 的红色上边界高于 TMA1 的红色上边界 + 上方的红色分形指标 + 同方向的黄色 SR 信号箭头。 - 买入 = TMA2 的蓝色下边界低于 TMA1 的蓝色下边界 + 下方的蓝色分形指标 + 同方向的水蓝色 SR 信号箭头。 该指标的优点 1. 指标产生的信号精确度高。 2. 确认的箭头信号不会重绘,分形信号可以重绘半个周期。 3. 您可以在任何经纪商的 MetaTrader 5 交易平台上进行交易。 4. 您可以交易任何资产(货币、金属、加密货币、股票、指数等)。 5. 最好在 M30-H1 时间框架(中期交易)上进行交易。 6. 在指标设置中可更改个别参数(TF、颜色等),以便每位交易者都能轻松定制适合自己的指标。 7. 该指标既可作为交易系统的主要补充,也可作为独立的交易系统使用。 注意:交易的入市准确性和盈利能力仅取决于交易者的技能。任何指标都只是交易者的助手,而非行动指南。
TPA True Price Action indicator reveals the true price action of the market makers through 100% non-repainting signals strictly at the close of a candle! TPA shows entries and re-entries, every time the bulls are definitely stronger than the bears and vice versa. Not to confuse with red/green candles. The shift of power gets confirmed at the earliest stage and is ONE exit strategy of several. There are available now two free parts of the TPA User Guide for our customers. The first "The Basics"
介绍     Quantum Breakout PRO   ,突破性的 MQL5 指标,正在改变您交易突破区域的方式!由拥有超过13年交易经验的资深交易员团队开发,     量子突破 PRO     旨在通过其创新和动态的突破区域策略将您的交易之旅推向新的高度。 量子突破指标将为您提供带有 5 个利润目标区域的突破区域的信号箭头,以及基于突破框的止损建议。 它既适合新手交易者,也适合专业交易者。 量子 EA 通道:       点击这里 重要的!购买后请私信我领取安装手册。 建议: 时间范围:M15 货币对:GBPJPY、EURJPY、USDJPY、NZDUSD、XAUUSD 账户类型:ECN、Raw 或 Razor,点差极低 经纪商时间:GMT +3 经纪商:IC Markets、Pepperstone with Raw 和 Razor 的点差最低 规格: 不重漆! 最多 5 个建议利润目标区域 建议止损水平 可定制的盒子。您可以设置自己的 Box Time Start 和 Box Time End。 接触 如果您有任何疑问或需要帮
Legacy of Gann for MT5
Pavel Zamoshnikov
5 (6)
The indicator very accurately determines the levels of the possible end of the trend and profit fixing. The method of determining levels is based on the ideas of W.D.Gann, using an algorithm developed by his follower Kirill Borovsky. Extremely high reliability of reaching levels (according to K. Borovsky  - 80-90%) Indispensable for any trading strategy – every trader needs to determine the exit point from the market! Precisely determines targets on any timeframes and any instruments (forex, met
AW Trend Predictor MT5
AW Trading Software Limited
4.78 (58)
一个系统中趋势和故障水平的组合。先进的指标算法过滤市场噪音,确定趋势、进入点以及可能的退出水平。指标信号记录在统计模块中,您可以选择最合适的工具,显示信号历史的有效性。该指标计算获利和止损标记。 手册和说明 ->   这里 / MT4 版本 ->   这里 如何使用指标进行交易: 使用趋势预测器进行交易只需三个简单的步骤: 第 1 步 - 开仓 收到买入信号,成功率超过 70% 第 2 步 - 确定止损 通过相反的信号选择中继线 第 3 步 - 定义止盈策略 策略一:达到 TP1 时平仓 策略 2:达到 TP1 时平仓 50%,达到 TP2 时平仓剩余 50% 策略三:在趋势反转时平仓 好处: 从不重绘结果,信号严格位于蜡烛收盘时 它可以在顾问中使用 获利和止损标记 对交易策略或独立策略的重要补充 市场噪音过滤算法 适用于任何工具 统计模块: 为了更好地选择配对,请使用内置的统计计算。 计算交易 - 给出统计数据的信号总数 成功评级 - 达到 TP1 的信号百分比,或反转那些正获利的信号时的百分比 TakeProfit1 Hit - 达到 TP1 的信号百分比 TakeProfit2
Matrix Arrow Indicator MT5
Juvenille Emperor Limited
5 (14)
矩阵箭头指标 MT5   是一种独特的 10 合 1 趋势,遵循   100% 非重绘多时间框架指标 ,可用于所有符号/工具: 外汇 、 商品 、 加密货币 、 指数 、 股票 。 Matrix Arrow Indicator MT5 将在其早期阶段确定当前趋势,从多达 10 个标准指标中收集信息和数据,它们是: 平均定向运动指数 (ADX) 商品渠道指数 (CCI) 经典 Heiken Ashi 蜡烛 移动平均线 移动平均收敛散度 (MACD) 相对活力指数 (RVI) 相对强弱指数 (RSI) 抛物线SAR 随机振荡器 威廉姆斯的百分比范围 当所有指标给出有效的买入或卖出信号时,相应的箭头将打印在图表上,在下一根蜡烛/柱线开盘时,指示强劲的上升趋势/下降趋势。用户可以选择使用哪些指标,并可以单独调整每个指标的参数。 Matrix Arrow Indicator MT5 仅从选定的指标中收集信息,并仅根据其数据打印箭头。   Matrix Arrow Indicator MT5   还可以为所有新信号发送终端、推送通知或电子邮件警报。无论您是黄牛、日内交易者还是波段交易者, Mat
Owl Smart Levels MT5
Sergey Ermolov
4.31 (39)
MT4版本  |   FAQ Owl Smart Levels Indicator 是一個完整的交易系統,包含 Bill Williams 的高級分形、構建正確的市場波浪結構的 Valable ZigZag 以及標記準確入場水平的斐波那契水平等流行的市場分析工具 進入市場和地方獲利。 策略的详细说明 指示灯使用说明 顾问-贸易猫头鹰助手助理 私人用户聊天 ->购买后写信给我,我会将您添加到私人聊天中,您可以在那里下载所有奖金 力量在於簡單! Owl Smart Levels 交易系統非常易於使用,因此適合專業人士和剛開始研究市場並為自己選擇交易策略的人。 策略和指標中沒有隱藏的秘密公式和計算方法,所有策略指標都是公開的。 Owl Smart Levels 允許您快速查看進入交易的信號,突出顯示下訂單的水平並向您發送有關已出現信號的通知。 優點很明顯: 清楚地顯示主要和更高時間框架的趨勢方向。 指示儀器信號的出現。 標記開單、止損設置和固定利潤的水平。 沒有多餘的,只有必要的結構! ZigZag 表示全球趨勢的方向,因此也表示貿易方向。 市場反轉點的短線清楚地表明在什麼水平上構建斐波
TrendLiness MT5
Ugochukwu Mobi
If you want to find good trading opportunities, then you must trade near the Trend Line. This allows you to have a tighter         stop loss   on your trades — which improves your       risk to reward . But that’s not all… Because if you combine Trend Line with Support and Resistance, that’s where you find the best trading opportunities. Now you might wonder: “So when do I enter a trade?” Well, you can use reversal     candlestick patterns   (like the   Hammer, Bullish Engulfing, etc.) as your e
Gold ATR MTF 5
Sergei Linskii
Gold ATR MTF - 這是一個很好的股票技術指標。 ATR(平均真實波動範圍)指標的演算法分析資產價格的變動,並透過在指定時間範圍 (D1) 的開盤價的指定百分比 (%) 中繪製相應水平來反映波動性。 符號價格變動方向和箭頭訊號的指標(紅色和/或藍色 D1 H4)是舒適且有利可圖的日內交易和/或倒賣的額外且重要的幫助。 對於外匯符號,每日利潤可以從 20 點起;對於黃金符號,每日利潤可以從 50 點起。 指標特點: 這是一個超級指標,具有 Magic、趨勢方向檢測器和兩個趨勢箭頭塊,可實現舒適且有利可圖的交易。 圖表上顯示用於切換方塊的紅色按鈕。 Magic 在指標設定中進行設置,以便您可以將指標安裝在顯示不同區塊的兩個圖表上。黃金 ATR MTF 可以放置在具有不同箭頭緩衝區(FP 和 SA)的兩個圖表上。 為此,您需要在設定中選擇不同的Magic,例如,一個Magic=999,另一個Magic=666。 然後您可以使用圖表上的紅色按鈕選擇箭頭緩衝區。在GOLD ATR MTF 中,只有當價格強勁波動時,水平(ATR) 才能小幅擴大,只有當價格強勁波動時,才能重新繪製趨勢方
作者的更多信息
MegaSpikes Classic EA Mt5
Kwaku Bondzie Ghartey
5 (1)
Introducing MEGASPIKES CLASSIC_EA   Embark on a new era of trading excellence with MEGASPIKES CLASSIC_EA, a revolutionary Expert Advisor meticulously crafted to harness the power of artificial intelligence and neural networks in navigating the intricate landscapes of Boom and Crash markets. This cutting-edge trading bot is not just an advisor; it's your gateway to unparalleled precision, adaptability, and profitability. Key Advancements: Tailored for Boom , Crash , DEX indices and Rangebreak N
Alpha Prime EA
Kwaku Bondzie Ghartey
Alpha Prime EA: A New Era in Trading Technology Introducing Alpha Prime EA, the ultimate trading expert advisor designed for traders who demand the highest level of performance and precision in their trading activities. Built on advanced algorithms and futuristic technology, Alpha Prime EA is your tool for conquering the volatile world of Forex trading. Contact developer here after purchase (to recieve the ALPHA_PRIME_INDICATOR ) : email: kwakughartey@gmail.com Telegram:  https://t.me/Machofx Ba
BoomCrash CheatCode EA Mt5
Kwaku Bondzie Ghartey
5 (3)
INTRODUCTION Unlock the door to a new era of trading with cheatcode, your ultimate solution for achieving trading success. Say goodbye to the constraints of human limitations and embrace the future of automated trading. Our cutting-edge trading robot is designed to empower both novice and seasoned traders, providing an exceptional tool for optimizing your trading strategies. As you are aware, some months ago, I developed the outstanding Mega spikes Detector, which is part of my best spikes ser
MegaSpikes Version 2 Boom Crash
Kwaku Bondzie Ghartey
4 (2)
Note: this is a free indicator, for  premium indicator,check out  https://www.mql5.com/en/market/product/120957 https://www.mql5.com/en/market/product/120957 https://www.mql5.com/en/market/product/120957 MEGASPIKES BOOM AND CRASH v 2.0 NB:   source codes of this indicator are available: PM me:     https://t.me/Machofx The indicator is developed form a Studied combination of MA - Moving Average SAR - Parabolic Support and Resistance CCI - Commodity Channel Index MegaSpikes 1.0 Download th
FREE
MegaSpikes Boom and Crash
Kwaku Bondzie Ghartey
4.68 (28)
Note: this is a free indicator, for  premium indicator,check out  https://www.mql5.com/en/market/product/120957 https://www.mql5.com/en/market/product/120957 https://www.mql5.com/en/market/product/120957 MEGASPIKES BOOM AND CRASH v1.32 NB:   source codes of this indicator are available: PM me:   https://t.me/Machofx PLEASE JOIN THE CHANNEL BELOW TO HAVE ACCESS TO ALL PREVIOUS VERSIONS  check out Spikes robot BoomCrash Cheatcode EA : https://www.mql5.com/en/market/product/103365 https:/
FREE
筛选:
34900
10
34900 2024.08.21 08:44 
 

用户没有留下任何评级信息

回复评论
版本 1.1 2024.08.13
Problem with Arrows not showing resolved