Bank Moving Average MT4
这是一个标准的移动平均线指标。
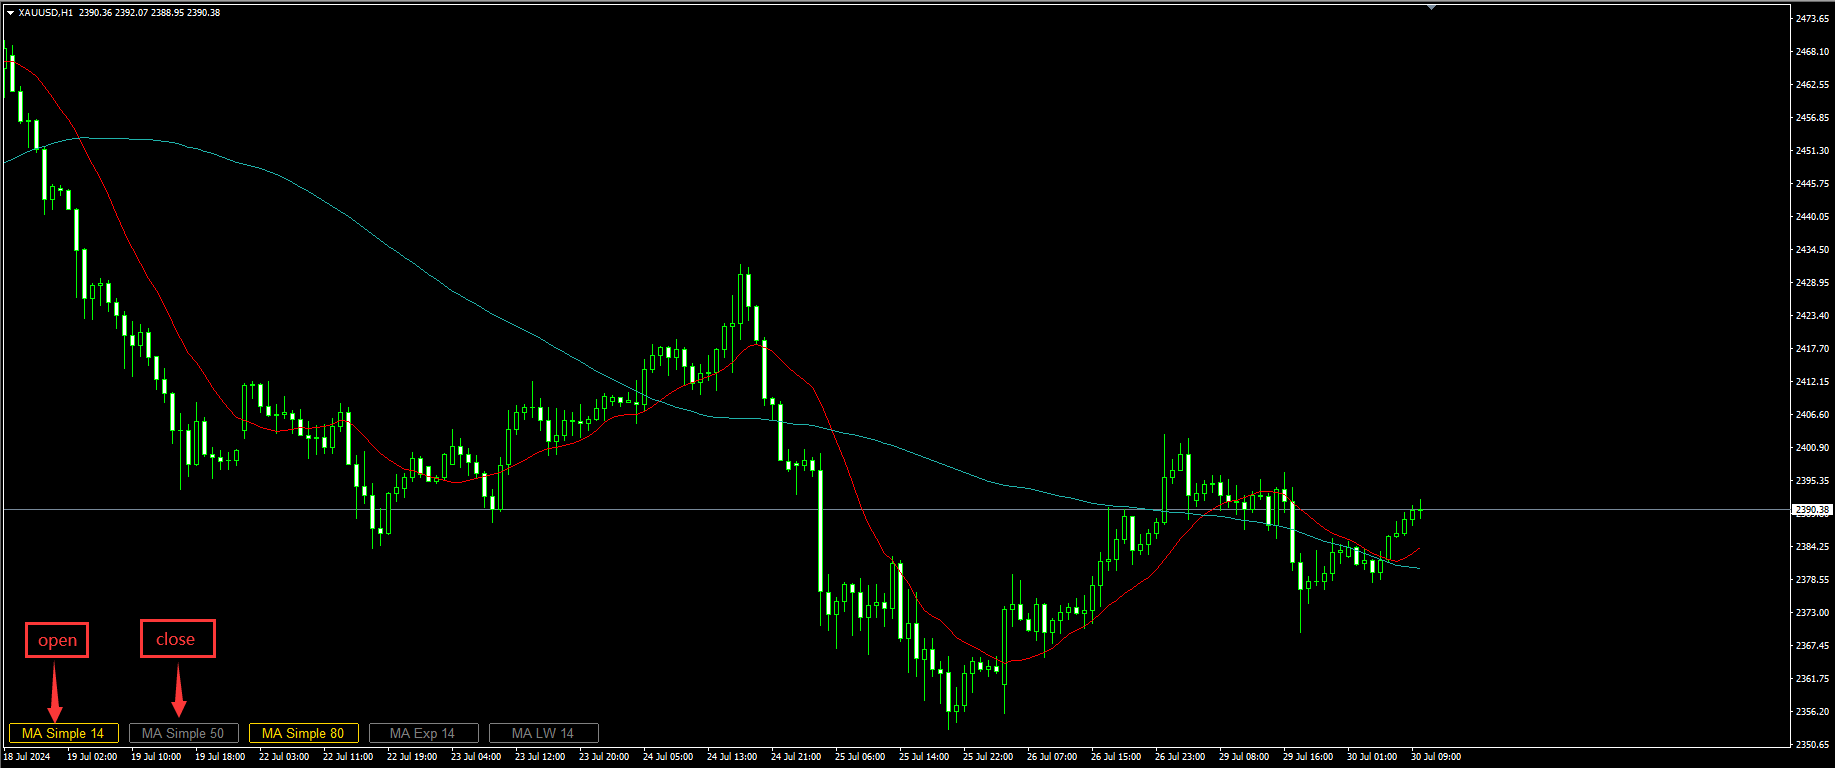
我为它在左下角增加了一个快捷的控制面板,在同时开启多个不同参数的该指标时,控制面板可以快捷开关不同参数的指标,以便于同时结合多个指标观察。
参数说明:

Indicator ID: 指标的唯一ID。当启动多个实例的时候该ID必须唯一不能重复。
Control Panel Pos X: 指标控制面板的X位置。
Control Panel Pos Y: 指标控制面板的Y位置。
Control Panel Dislpay Name: 指标控制面板显示的文字内容。

Period: 计算移动平均线的平均周期。
Shift: 指标线按图表时间偏移量。
Method: 计算移动平均线的方法。
AppliedPrice: 计算移动平均线所使用的价格。