Draconis Expert
- 专家
- Mr Ruengrit Loondecha
- 版本: 1.1
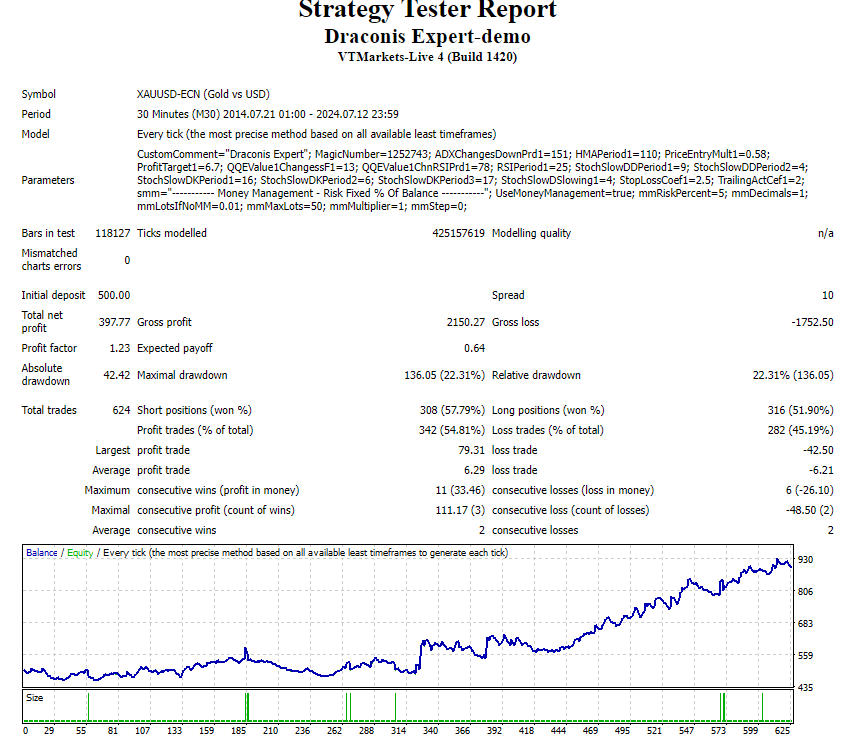
- Draconis Expert
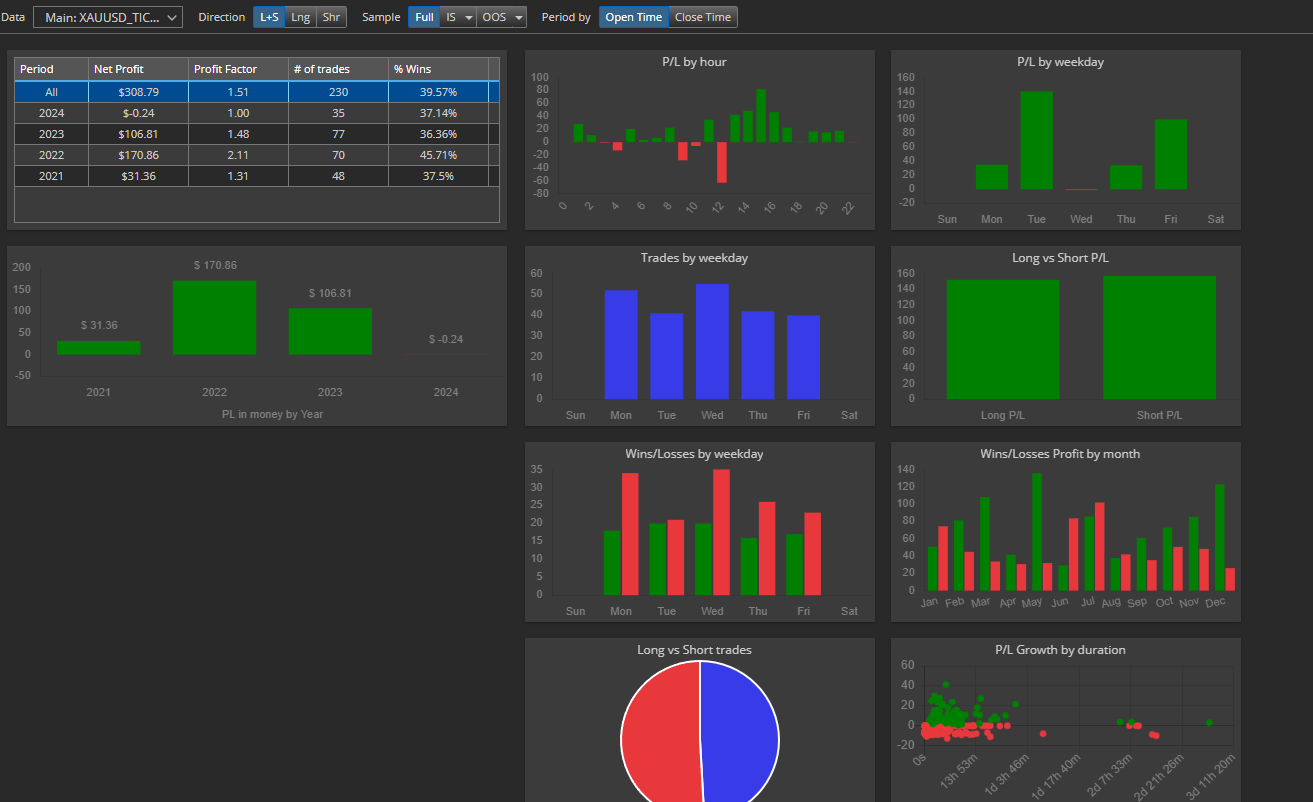
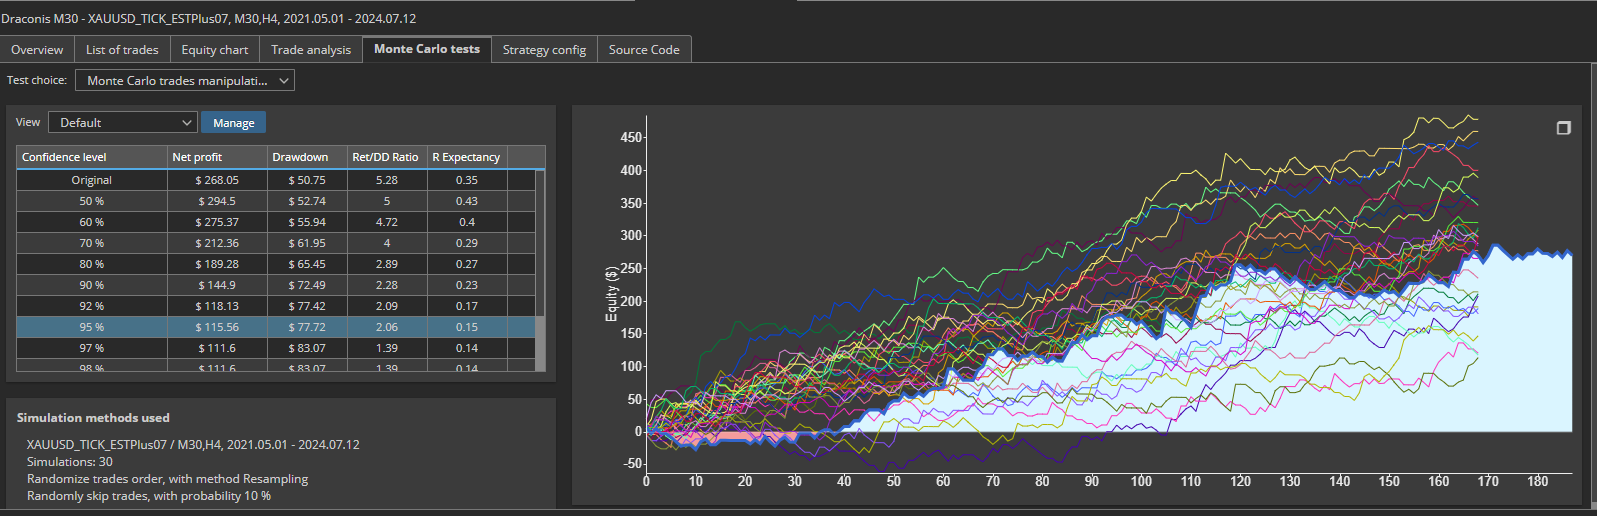
- Working best with GOLD - M30
- Require minimal 500$ for 0.01 (AutoLot feature inside)
- Optimize update monthly. stay in Comment
- Live trade @ https://t.me/lullfrx
Indicators and Concepts
-
Quantitative Qualitative Estimation (QQE):
- QQE is an advanced version of the Relative Strength Index (RSI) that includes a volatility filter. It consists of a fast and a slow line, which help in identifying trends and potential reversals. The QQE indicator smooths out the price action and provides more reliable signals by reducing market noise.
-
Stochastic Oscillator (Stoch):
- The Stochastic Oscillator measures the closing price relative to the high-low range over a specific period. It ranges from 0 to 100, with readings above 80 indicating overbought conditions and below 20 indicating oversold conditions. It's used to identify potential reversal points and market momentum.
-
Relative Strength Index (RSI):
- RSI is a momentum oscillator that measures the speed and change of price movements. It ranges from 0 to 100, with readings above 70 indicating overbought conditions and below 30 indicating oversold conditions. RSI helps identify potential overbought/oversold conditions and trend strength.
-
Hull Moving Average (HMA):
- HMA is a smoother and faster-moving average that reduces lag compared to traditional moving averages. It's designed to capture market trends more accurately, providing clearer signals for entering and exiting trades.
-
Average Directional Index (ADX):
- ADX measures the strength of a trend. A high ADX value indicates a strong trend, while a low value suggests a weak or range-bound market. ADX is often used in conjunction with other indicators to confirm trend strength.
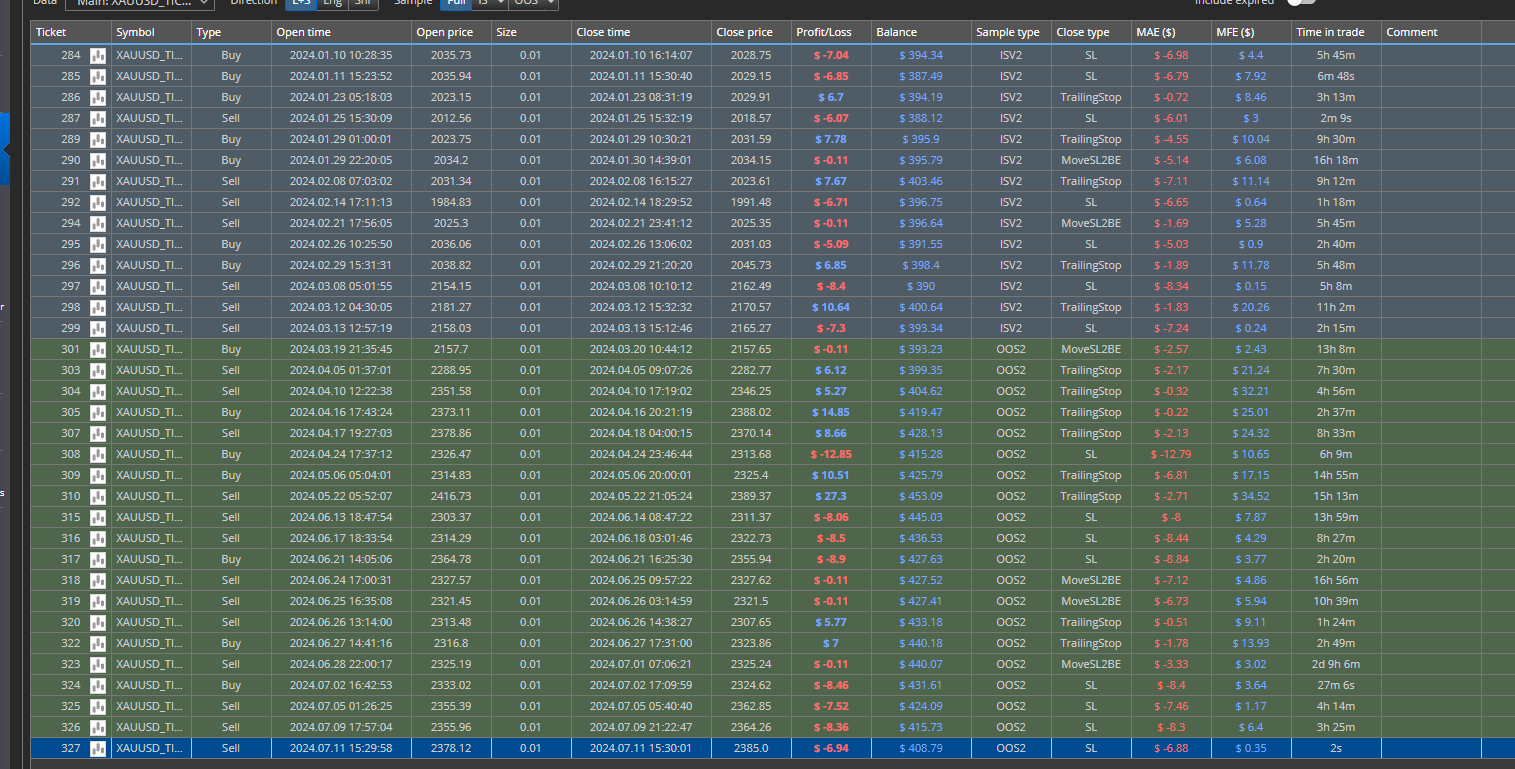
Trade Style: STOP Order
-
STOP Order:
- A STOP order is an order to buy or sell a security once its price reaches a specified level. This strategy is used to enter a trade at a predetermined price point, often in anticipation of a breakout or continuation of a trend.
-
Stop Loss (SL) by ATR:
- The stop-loss level is set using the Average True Range (ATR) to account for market volatility. This approach adjusts the SL based on the recent price range, helping to manage risk by setting a stop at a reasonable distance from the entry point.
-
Take Profit (TP) by Percentage:
- The take profit level is set as a fixed percentage of the entry price. This method provides a clear profit target and helps manage expectations for the trade's potential return.
-
Trailing Stop by Heiken Ashi:
- Heiken Ashi candles are used to smooth price action and identify trends. A trailing stop based on Heiken Ashi helps lock in profits by adjusting the stop loss as the market moves favorably, following the trend's direction.
-
Move to Break Even (MOVE2BE) by Parabolic SAR:
- The Parabolic SAR (Stop and Reverse) is used to set the point at which the stop-loss level moves to break even. As the trade progresses in the trader's favor, the Parabolic SAR provides a dynamic trailing stop, protecting profits and ensuring the trade does not result in a loss.