Astrilith Expert
- 专家
- Mr Ruengrit Loondecha
- 版本: 1.1
- 激活: 5
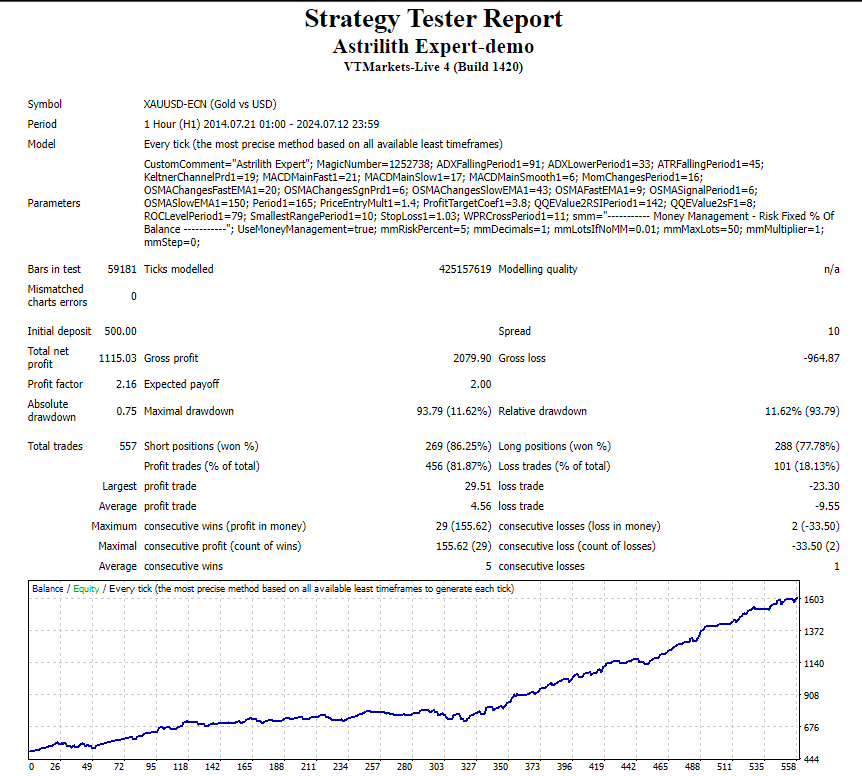
- Astrilith Expert
- Working best with GOLD - H1
- Require minimal 100$ for 0.01 (AutoLot feature inside)
- Optimize update monthly. stay in Comment
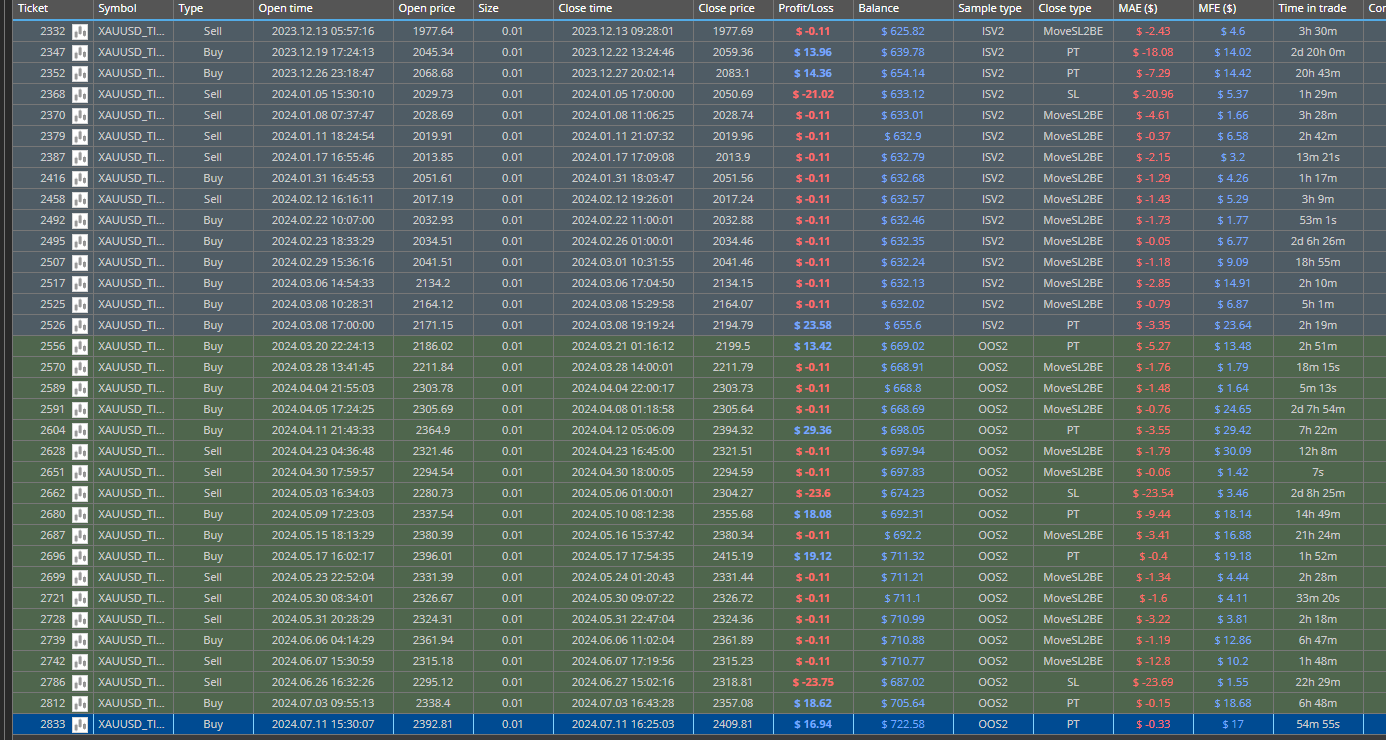
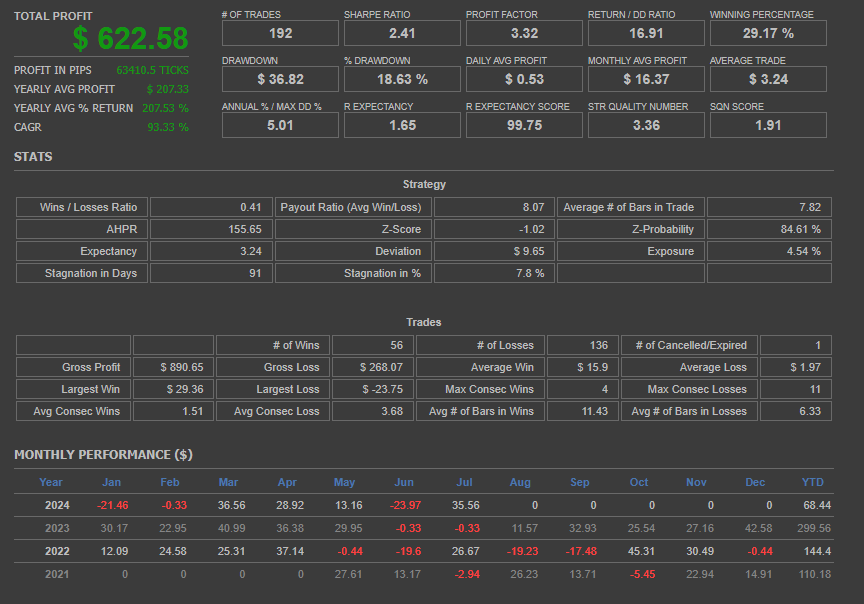
- Live trade @ https://t.me/lullfrx
Indicators and Concepts
-
Momentum:
- Momentum measures the rate of change in prices over a specific period. It helps identify the strength of a trend and potential reversal points. High momentum indicates a strong trend, while low momentum suggests a weakening trend.
-
Average True Range (ATR):
- ATR measures market volatility by calculating the average range between the high and low prices over a specified period. It helps set stop-loss levels and assess the potential risk of a trade.
-
Moving Average Convergence Divergence (MACD):
- MACD is a trend-following momentum indicator that shows the relationship between two moving averages of a security's price. It consists of the MACD line, the signal line, and the histogram. MACD can help identify trend direction, strength, and potential reversals.
-
Average Directional Index (ADX):
- ADX measures the strength of a trend, regardless of its direction. A high ADX value indicates a strong trend, while a low ADX value suggests a weak trend or a ranging market. ADX is often used in conjunction with other indicators to confirm trend strength.
-
Oscillator of Moving Average (OSMA):
- OSMA is the difference between the MACD line and its signal line. It indicates the momentum of the MACD indicator, helping to identify the strength and direction of the trend.
Trading Strategies
-
Trailing Stop with MTKeltner:
- The Keltner Channel, often referred to as MTKeltner, is a volatility-based envelope set above and below an exponential moving average. A trailing stop using the Keltner Channel can help lock in profits as the market moves in your favor by adjusting the stop-loss level based on price movements and volatility.
-
Pending Stop Order with Highest and Lowest Price:
- A pending stop order can be set at the highest or lowest price point over a specific period. This strategy aims to enter the market at a breakout point, either by buying above the highest high or selling below the lowest low, capturing potential price momentum.
-
Profit Target using Coefficient * ATR (20):
- The profit target can be set as a multiple of the ATR (20-period), where the coefficient (Coef) determines the target distance. This approach uses market volatility to estimate the potential price movement, providing a dynamic profit target.
-
Stop Loss by Percentage:
- A stop-loss can be placed at a fixed percentage from the entry price. This method limits potential losses by exiting the trade if the market moves against the position by a predetermined percentage.