
很遗憾,"ZoomChat2"不可用
您可以检查Sergii Krasnyi的其他产品:

We present you an indicator that not only improves the visual aspect of the chart, but also gives it a lively, dynamic character. Our indicator is a combination of one or more Moving Average (MA) indicators, which constantly change their color, creating an interesting and colorful look.
This product is a graphical solution, so it is difficult to describe what it does in text, it is easier to see by downloading it, besides the product is free. This indicator is suitable for bloggers who want t
FREE

TickChartOscillator is an indicator that displays a symbol's tick chart in an oscillator subwindow. It offers flexible customization options, including: · The ability to hide the price line in the oscillator. · The option to specify a different symbol for tick chart display. If the "Symbol" parameter is left blank, the tick chart will be shown for the current symbol where the indicator is applied. This tool is perfect for traders who want to view tick dynamics in an oscillator format and u
FREE
This indicator simplifies the process of creating chart templates by allowing you to save your current chart settings to a template with just one click of a button. The indicator adds a button directly to the chart that automatically saves the template with a given name and prefix, making it easy to organize and use templates.
The main functions of the indicator are:
Creating a template of the current chart with a single click on the button. Possibility to specify a prefix for the template
FREE
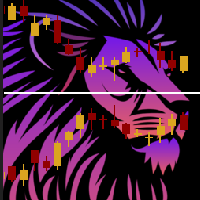
ChartOverlay indicator has two main functions 1. mirroring - i.e. for example, it will make USDEUR from EURUSD 2. displaying the price chart of the selected financial instrument (with selected period) in the subwindow of the main chart. This tool allows traders to easily analyze the relationship between different currency pairs and assets, offering unique customization and visualization features.
Key Features: Price Chart Display: The indicator displays the price chart of the selected instrum
FREE

This indicator continuously, smoothly changes the color of candlestick edges and bodies, as well as the color of volumes in real time like a lamp. The indicator is easy to use. The palette of colors is diverse. This product is a graphical solution, so it is difficult to describe what it does by text, it is easier to see by downloading it, besides the product is free. The indicator is suitable for bloggers who want to create a beautiful picture of a chart for video editing or traders who want to
FREE
The ZoomChart indicator displays data from other timeframes on the current chart in the subwindow, acting as a magnifying glass or, conversely, shrinking the chart to display larger timeframes.
The ZoomChar indicator automatically tracks the current outermost bar on the chart and moves with the chart as it shifts.
The indicator can display data from another financial instrument, not limited to the main chart instrument.
The robot carries the function of “mirroring” - The ability to conver
FREE
This indicator is designed for convenient and quick creation of screenshots of charts in the trading terminal. It greatly simplifies the process of saving charts to a certain directory, providing a convenient interface with a button on the chart, which is activated by a single click.
The main functions of the indicator are:
Automatic creation of a chart screenshot when the button is pressed. Possibility to select a directory for saving screenshots. Customizable prefix to distinguish screens
FREE
The ZoomChart indicator works with two charts - the current chart on which it is launched and the next one. The indicator translates the second chart to the time where the first one is now. Thus, the second chart depicts the same situation on the first chart (where the indicator is launched), but on a different time-frame. In other words, this indicator serves as a magnifying glass or, on the contrary, reduces the chart to display the situation on a larger time-frame.
The ZoomChar indicator a
FREE

SpreadChartOscillator is an indicator that displays the spread line of a symbol in the subwindow of the oscillator. In the parameters it is possible to specify another symbol from which the spread line will be broadcast. If the "Symbol" parameter is left empty, the spread line will be displayed from the current symbol on which the indicator is set. This tool is ideal for traders who want to see the spread dynamics in the oscillator format and use it to protect themselves from entering the market
FREE