SolarTrade Suite Jupiter Market Indicator
- 指标
- Adam Gerasimov
- 版本: 1.0
- 激活: 5
SolarTrade Suite 金融指标:木星市场指标 - 您在金融市场世界中的可靠指南!
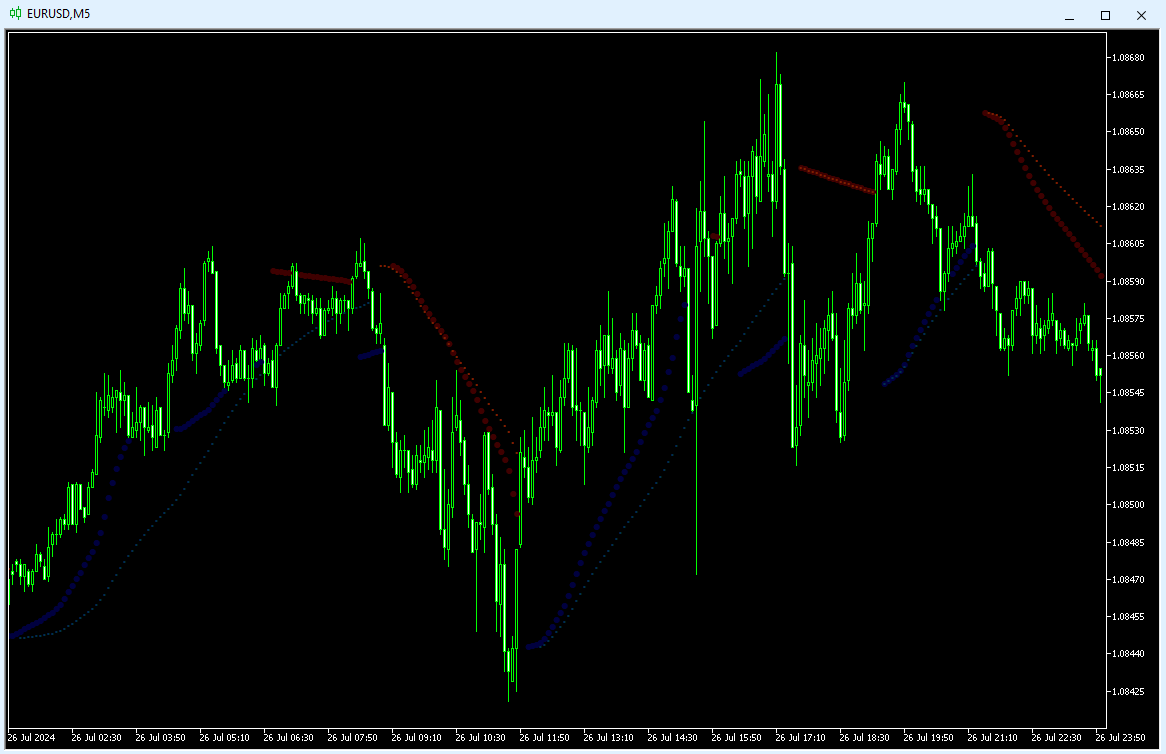
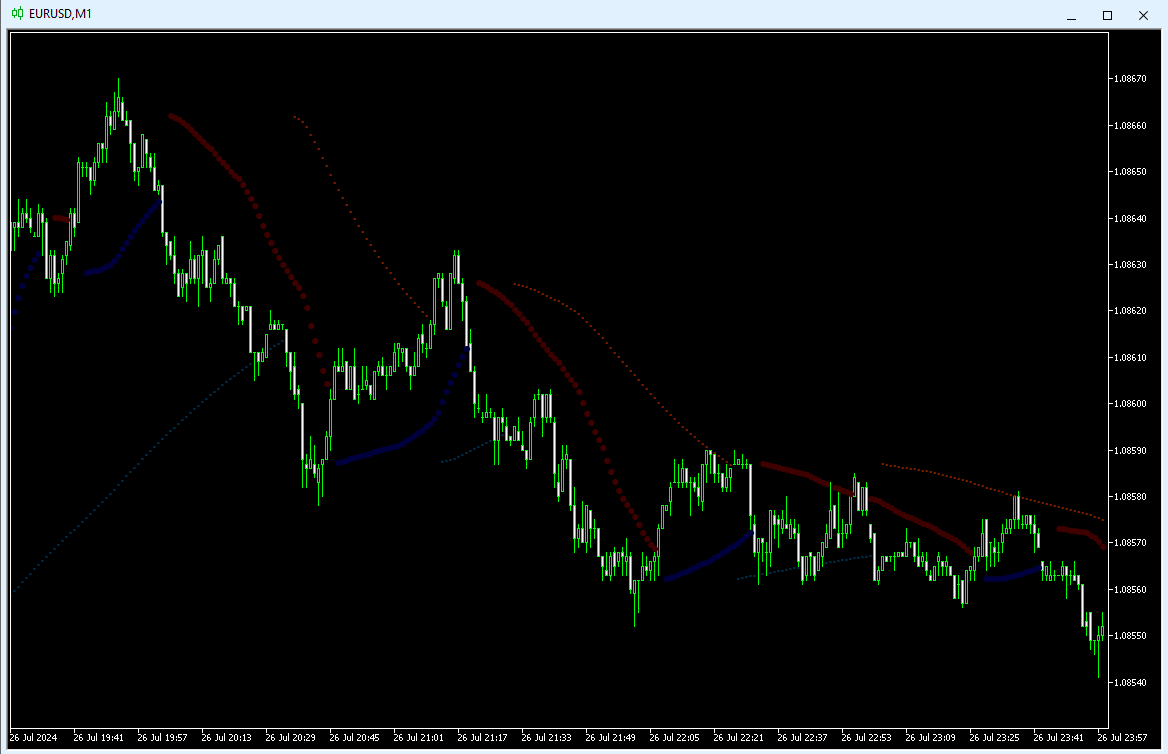
这是一个趋势指标,使用特殊的创新和高级算法来计算其值,并且具有令人赏心悦目的设计。
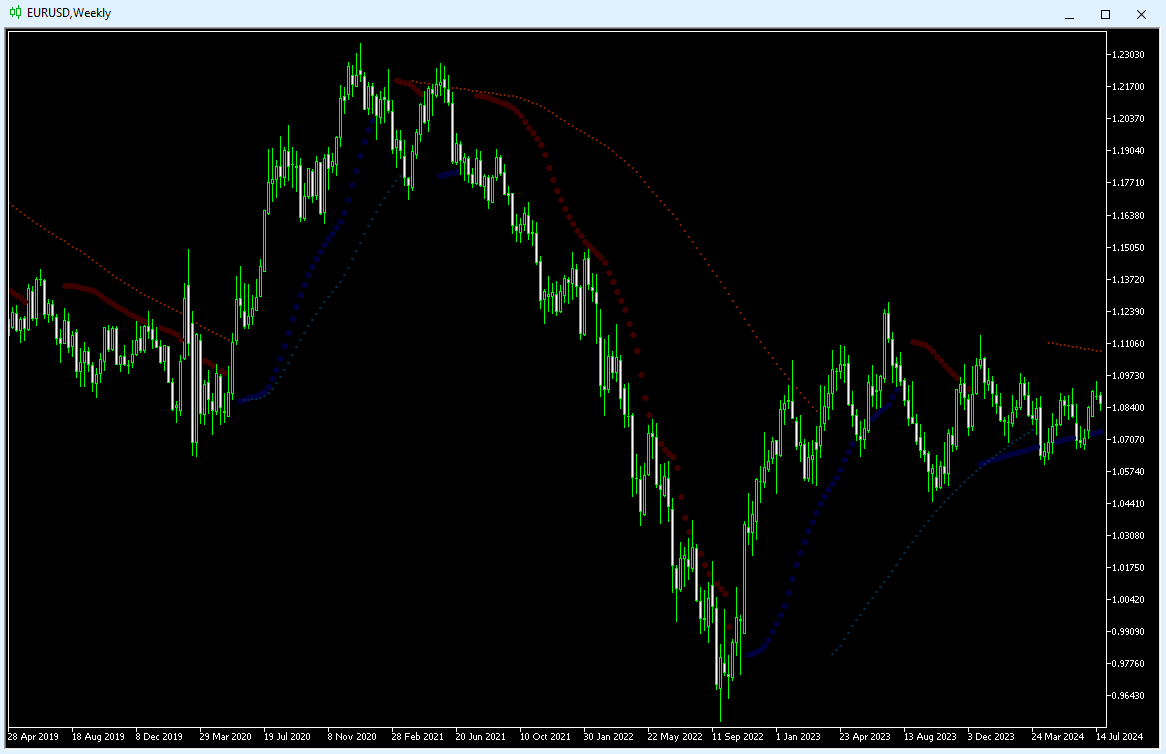
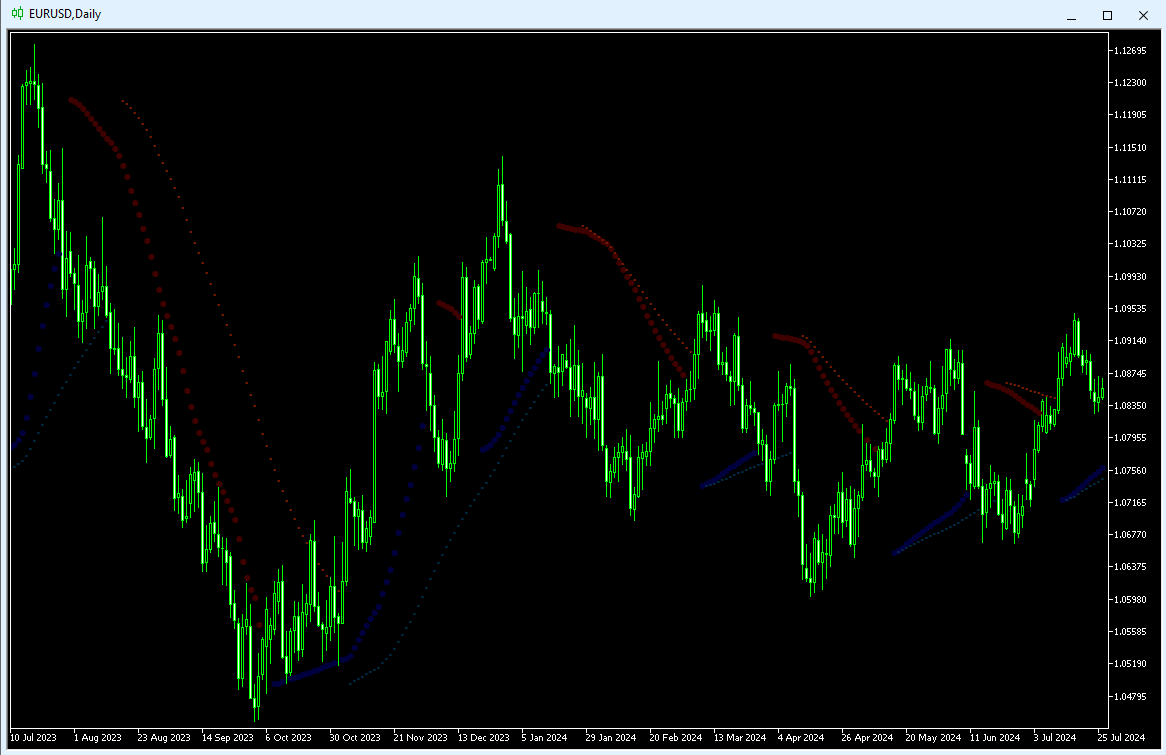
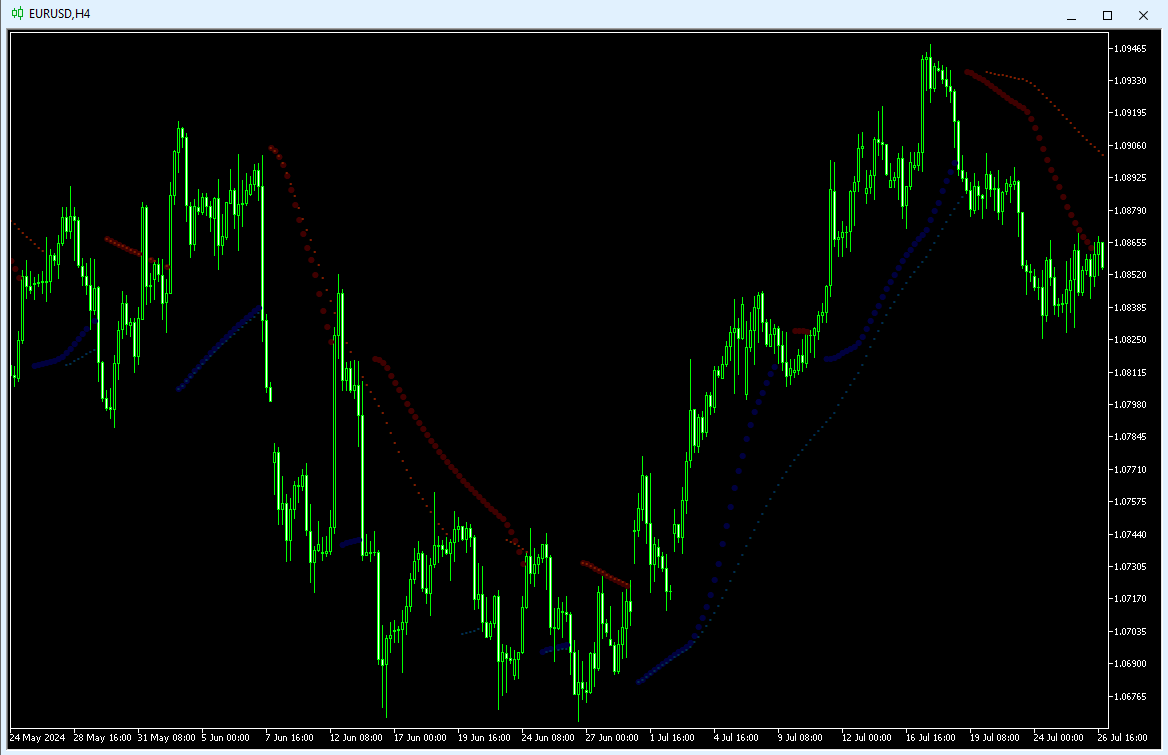
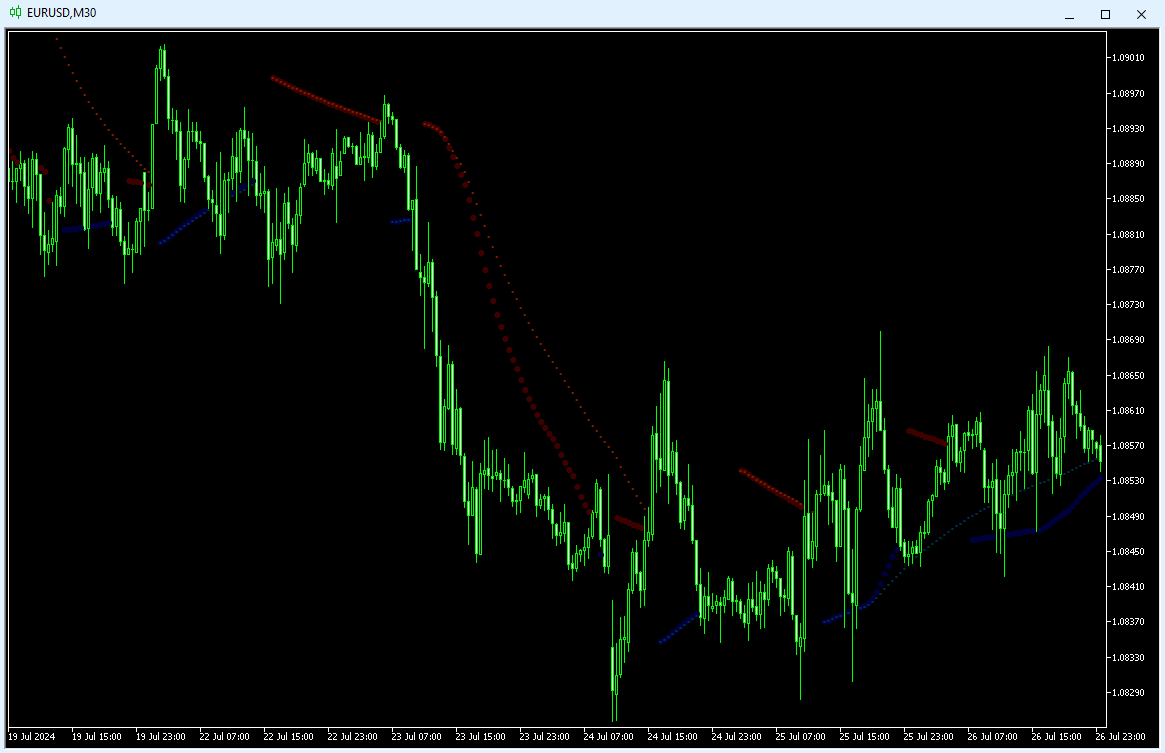
很容易理解此指标的读数:蓝色 - 买入,红色 - 卖出。
在说明底部查看我们来自 SolarTrade Suite 系列的其他产品。
您想自信地驾驭投资和金融市场的世界吗? SolarTrade Suite 金融指标:木星市场指标是一款创新软件,旨在帮助您做出明智的投资决策并增加您的利润。
SolarTrade Suite 金融指标:木星市场指标的优势:
- 准确预测:我们的指标使用先进的算法和分析方法来准确预测市场走势。
接收有关买卖资产最佳时机的信号。
- 用户友好界面:直观的界面将使您能够轻松掌握该程序并在安装后立即开始享受其好处。
您可以从设置中更改点的大小和颜色、灵敏度和速度,所有其他设置都是自动完成的。
- 专家支持:我们的专业团队随时准备为您解答任何问题并提供有关使用该程序的建议。
为什么选择 SolarTrade Suite 财务指标:木星市场指标?
- 可靠性和准确性:该程序已被证明是分析金融市场的可靠和准确的工具。
- 资本增长:使用 SolarTrade Suite 财务指标:木星市场指标,您将能够做出更准确的决策,从而增加您的利润。
立即试用 SolarTrade Suite 财务指标:木星市场指标,对您的投资决策充满信心!
SolarTrade Suite 程序系列:
- SolarTrade Suite Mars Market Indicator
- SolarTrade Suite Venus Market Indicator
- SolarTrade Suite Neptune Market Indicator
- SolarTrade Suite Uranus Market Indicator
- SolarTrade Suite: Saturn Market Indicator.
- SolarTrade Suite Pluto Market Indicator
- SolarTrade Suite: Mercury Market Indicator.
- SolarTrade Suite: Earth Market Indicator.