Chart Patterns All in One
- 指标
- Davit Beridze
- 版本: 2.2
- 更新: 16 八月 2024
- 激活: 5
`All in One Chart Patterns`
图表形态在交易者之间是一个有争议的话题;有些人认为它们是可靠的信号,而另一些人则不这样认为。我们的“Chart Patterns All-in-One”指标显示了各种图表形态,让您可以自行测试这些理论。这些形态的盈利能力并不反映指标的有效性,而是对形态本身的评估。“Chart Patterns All-in-One”指标是可视化这些形态的绝佳工具,让您能够对它们在您的交易策略中的有效性得出自己的结论。
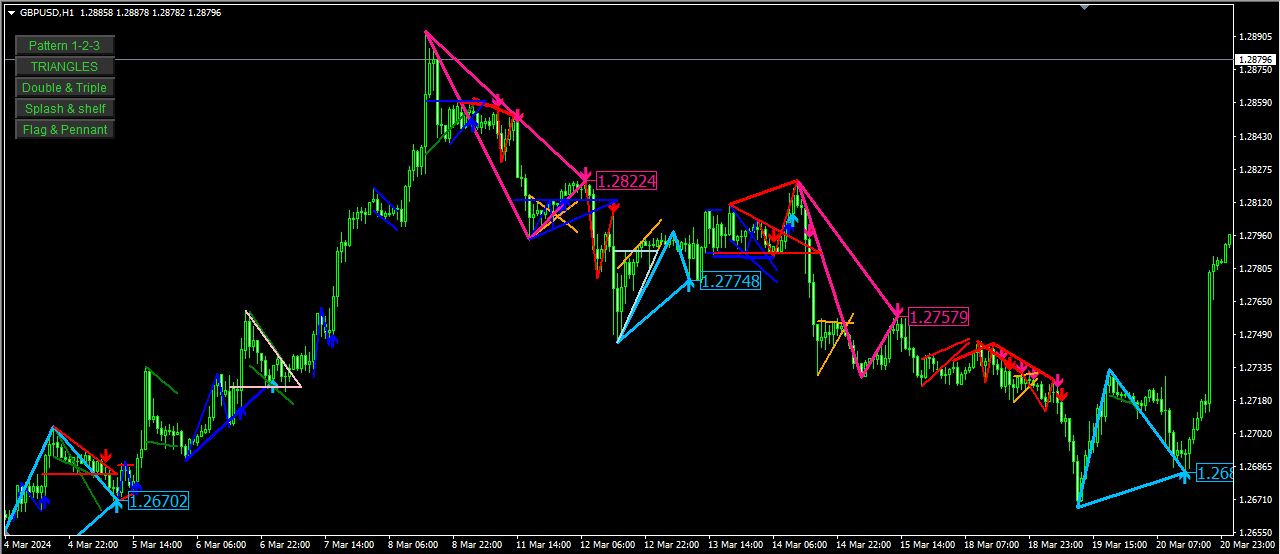
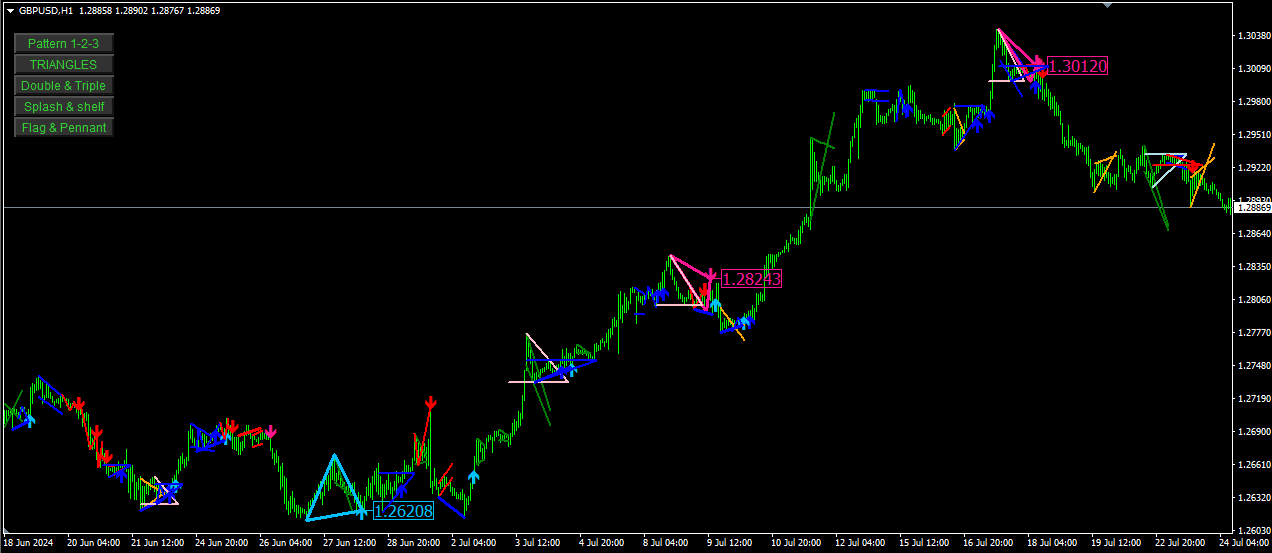
该指标将多个图表模式组合成一个统一的工具,用于MetaTrader 4 (MT4)。它提供了直接从图表上开启或关闭每个模式的功能,使分析更加高效和可定制。以下是该指标和包含的模式的详细描述:
#### 包含的模式:
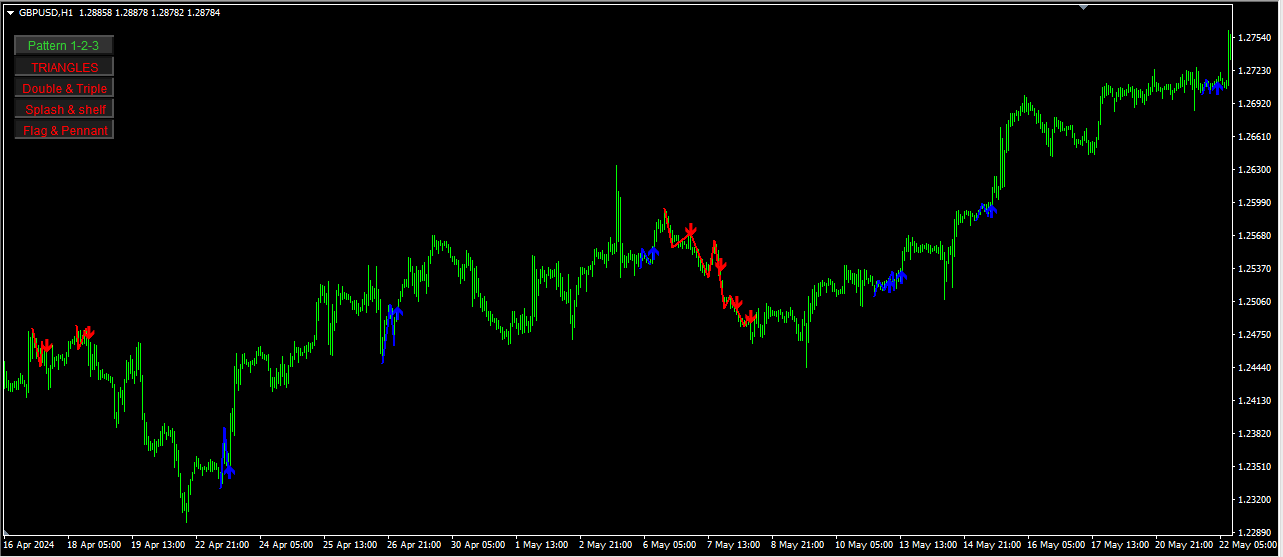
1. **模式 1-2-3**
- **描述**:该模式用于识别市场中的潜在反转点。它寻找三个点(高点或低点)的序列,标志着趋势的变化。
- **信号**:
- 买入信号:当有两个连续的低点,第二个低点高于第一个低点,随后是一个低于前一个高点的高点时形成。
- 卖出信号:当有两个连续的高点,第二个高点低于第一个高点,随后是一个高于前一个低点的低点时形成。
- **可视化**:绘制连接图表上模式点的线,并在完成点处放置箭头。
2. **双顶和双底**
- **描述**:该模式有助于识别潜在的反转点,即价格形成两个连续的高点(双顶)或低点(双底),它们大致相等,表明可能的反转。
- **信号**:
- 双顶:看跌反转信号。
- 双底:看涨反转信号。
- **可视化**:绘制连接顶点或底部的线,并在反转点处放置箭头。
3. **三重顶和三重底**
- **描述**:类似于双顶和双底,但有三个连续的高点或低点。该模式被认为比双顶和双底更强。
- **信号**:
- 三重顶:看跌反转信号。
- 三重底:看涨反转信号。
- **可视化**:绘制连接顶点或底部的线,并在反转点处放置箭头。
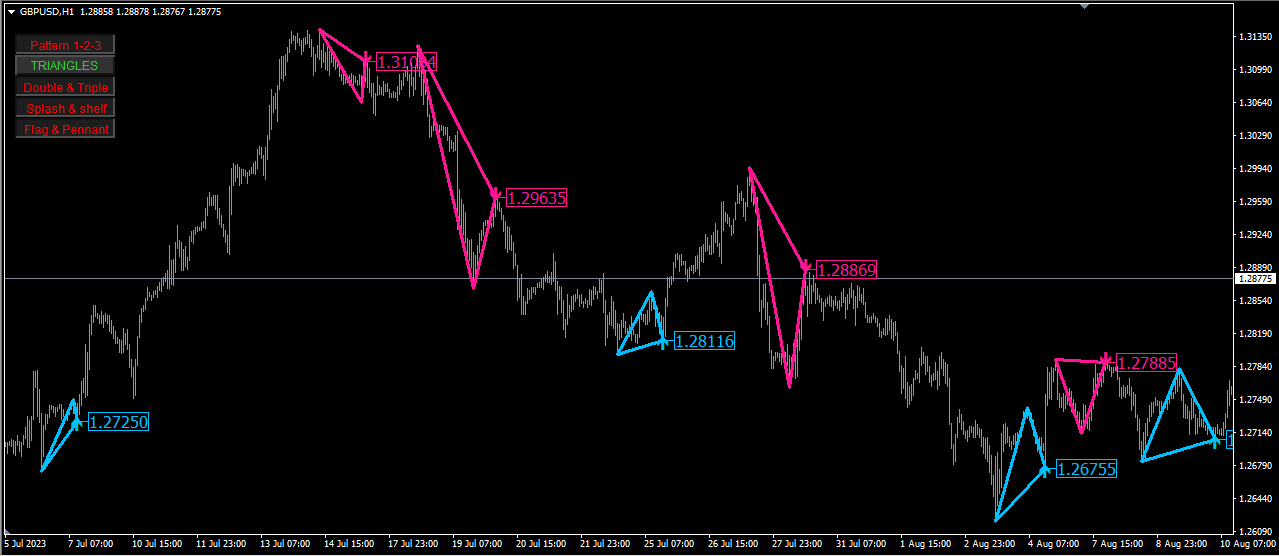
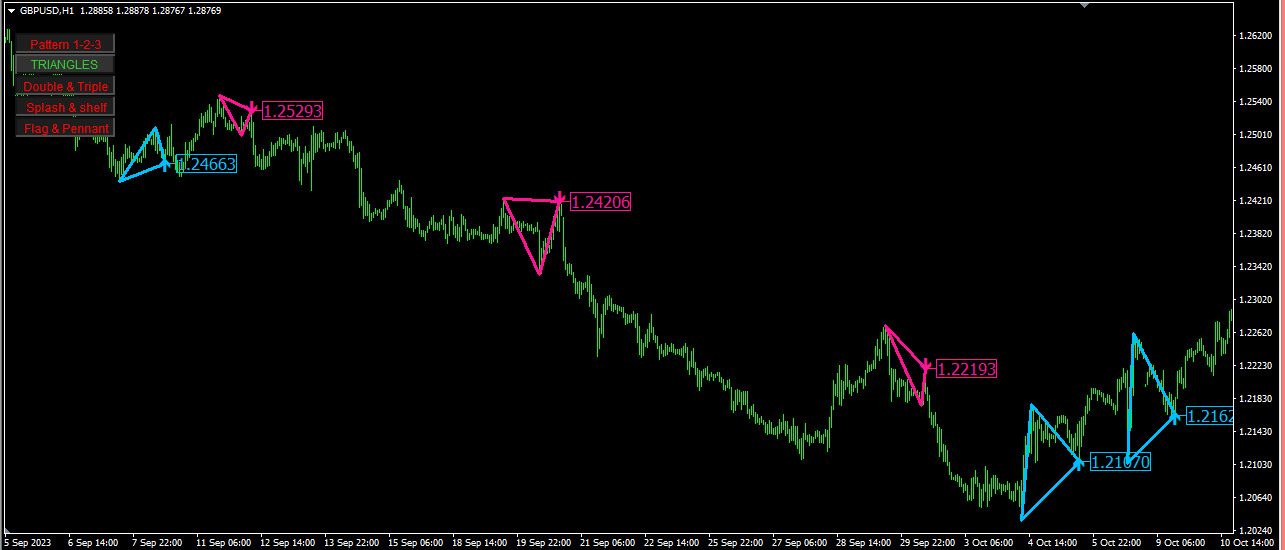
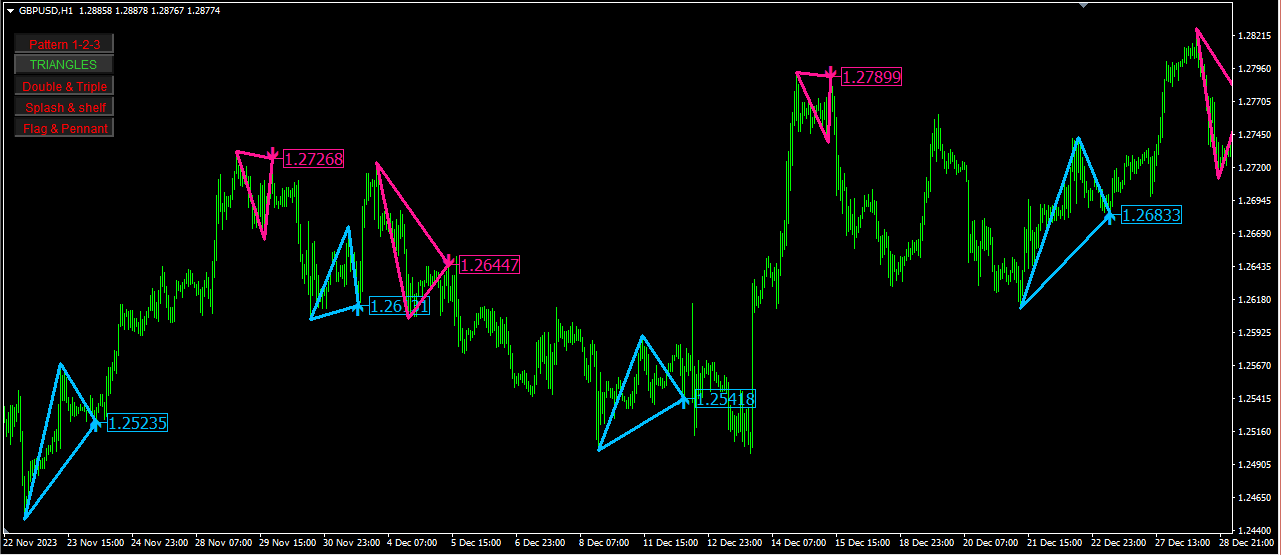
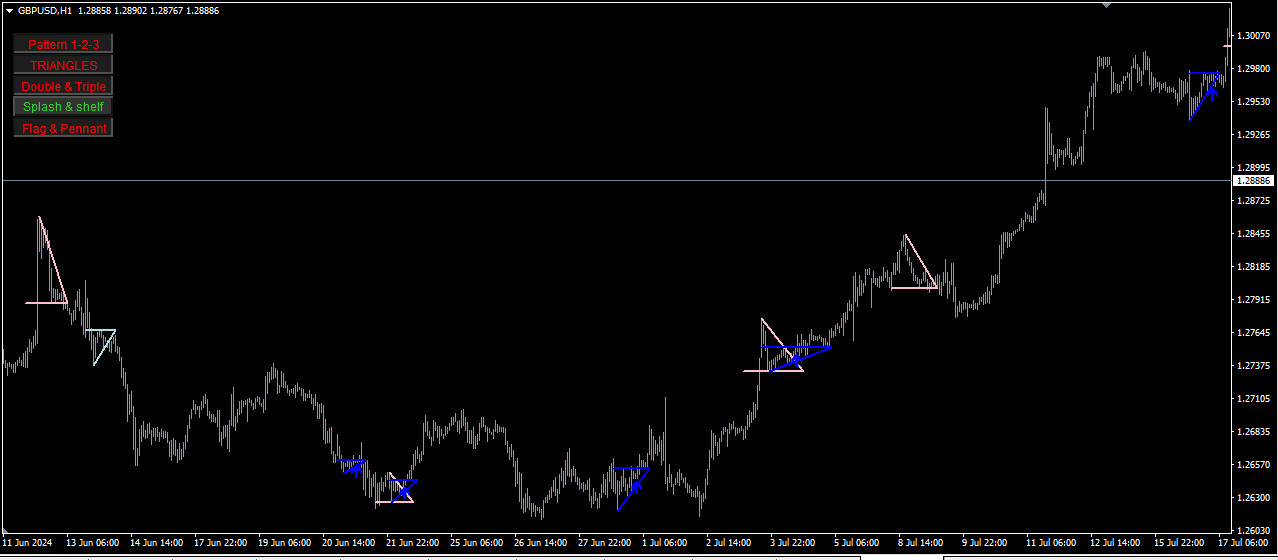
4. **三角形**
- **描述**:三角形是延续模式,表示在价格继续沿着主趋势方向移动之前的整合期。该指标识别上升、下降和对称三角形。由于它基于ZigZag指标,有时三角形会出现在图表上几个柱子之前。这是因为ZigZag指标在峰值出现后稍后绘制其线。然而,这种情况并不常见。
- **信号**:
- 上升三角形:看涨延续信号。
- 下降三角形:看跌延续信号。
- 对称三角形:可能向任一方向突破的延续信号。
- **可视化**:绘制图表上的三角形,并在突破点处放置箭头。
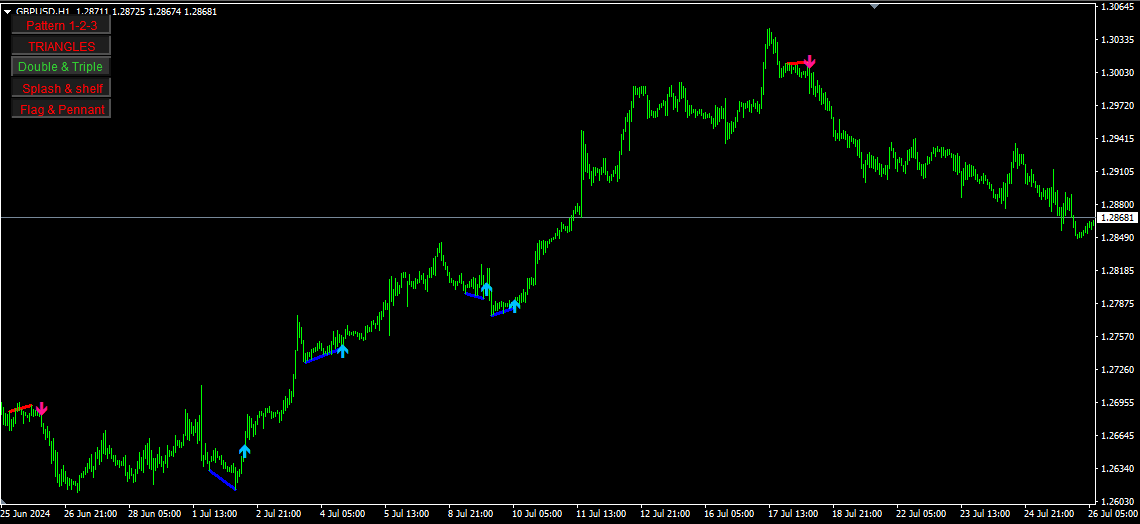
5. **浪花和平台**
- **描述**:该模式识别价格的突然飙升(浪花)以及随后的整合期(平台)。它有助于发现潜在的突破或反转。
- **信号**:
- 浪花:表示价格的急剧变化。
- 平台:表示浪花后的整合期。
- **可视化**:绘制浪花的趋势线和平台的水平线。
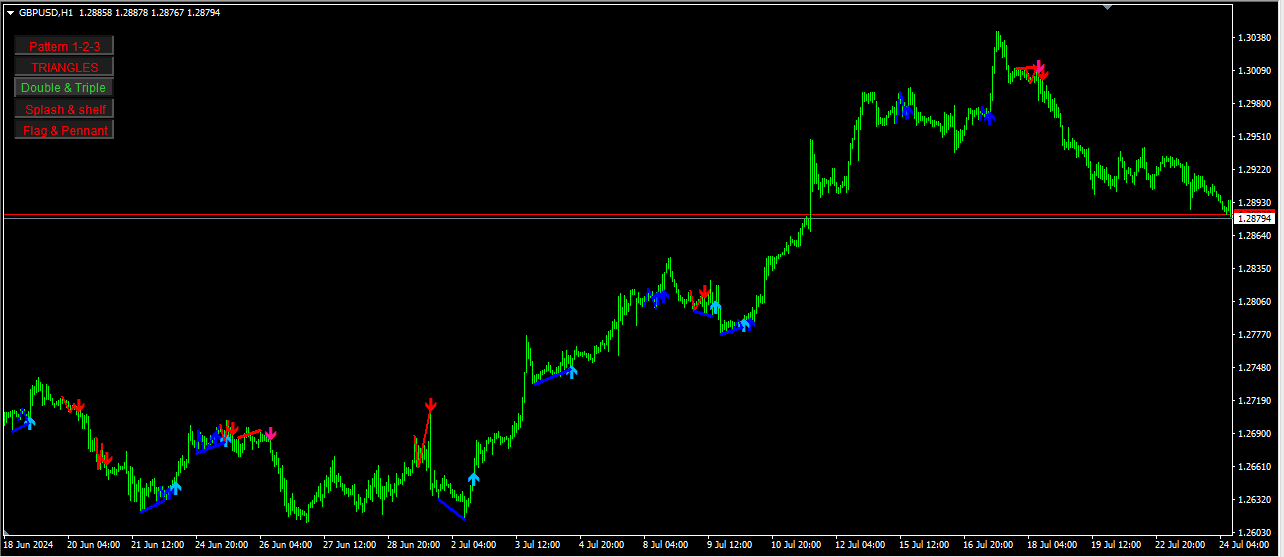
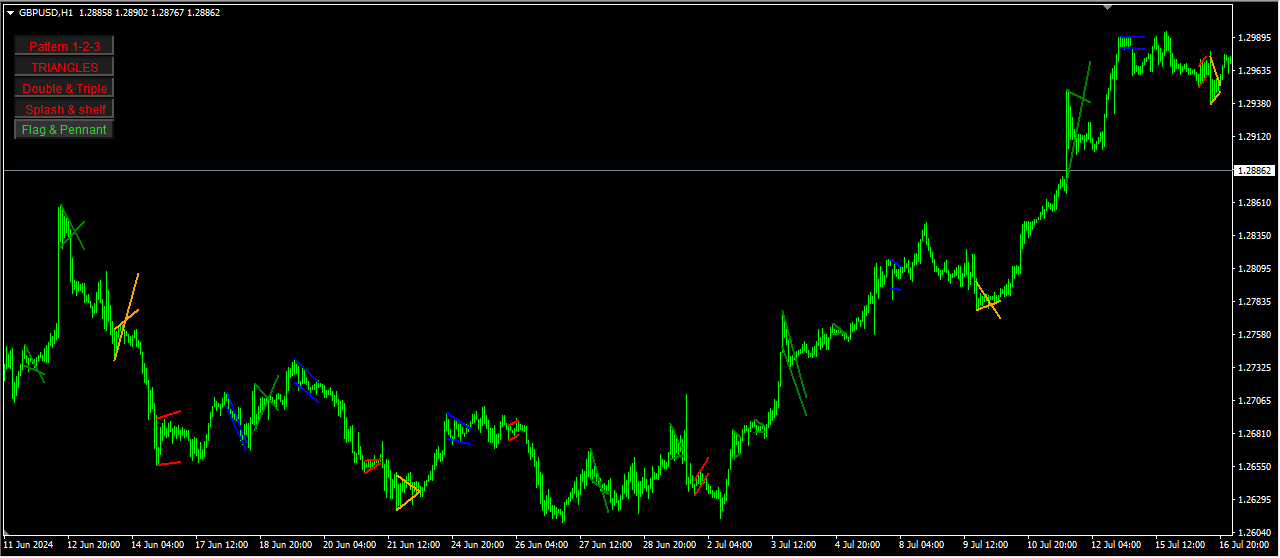
6. **旗形和楔形**
- **描述**:旗形和楔形是短期延续模式,表示主趋势继续之前的短暂停顿。
- **信号**:
- 看涨旗形:看涨延续信号。
- 看跌旗形:看跌延续信号。
- 楔形:形成小对称三角形的延续信号。
- **可视化**:绘制图表上的旗形和楔形,并在突破点处放置箭头。
#### 特点:
- **开启/关闭模式**:指标在图表上提供按钮,可以开启或关闭每个模式。这使得分析更加灵活和高效。
- **可定制的颜色和设置**:用户可以自定义每个模式的颜色、宽度和其他设置。
- **警报和通知**:该指标可以配置为在识别到模式时提供警报、推送通知和电子邮件。
#### 输入参数:
- **一般设置**:包括模式的颜色、宽度和其他显示设置。
- **特定模式设置**:
- `Double_Triple_and_1_2_3`:双顶/双底和1-2-3模式的设置。
- `Pattern_TRIANGLES`:三角形模式的设置。
- `Splash_and_shelf`:浪花和平台模式的设置。
- `Flag_and_Pennant`:旗形和楔形模式的设置。
- **警报设置**:配置警报、通知和电子邮件。
#### 可视化:
- **箭头和线条**:每个模式通过图表上的箭头和线条可视化,使其一目了然。
- **互动按钮**:在图表上提供按钮来切换每个模式的可见性。
这个全能指标是一个强大的工具,适用于在技术分析中使用多个图表模式的交易者。通过将这些模式组合成一个指标,它简化了分析过程,并帮助交易者做出明智的交易决策。
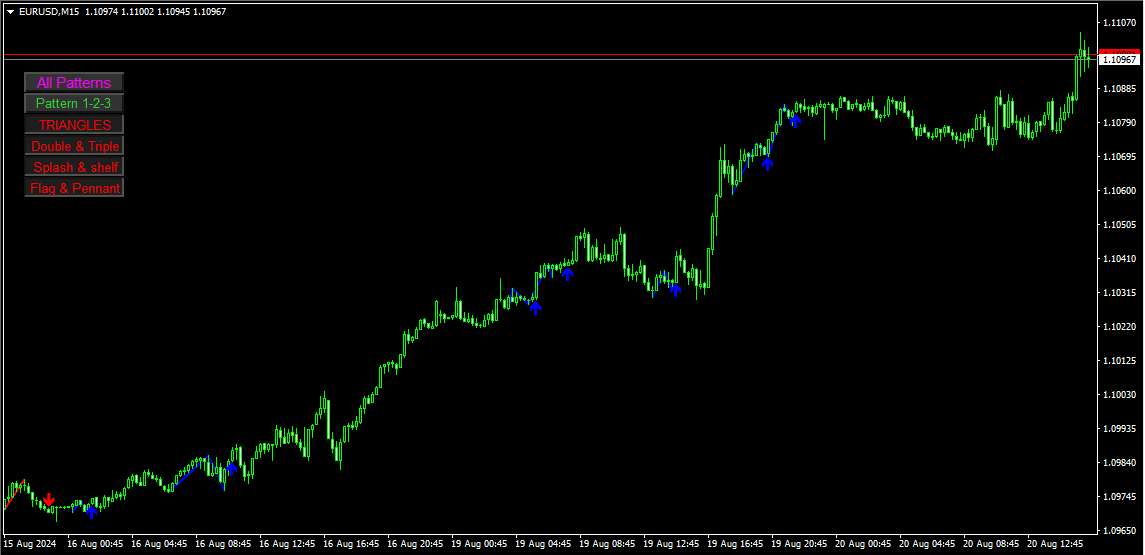


It is a very accurate indicator. I'm waiting for a sign on the 4-hour timeframe and looking for an entry point on the 15-minute timeframe, and both signs are valid.