True Range Strength
- 指标
- Smarterbot Software
- 版本: 240.713
- 激活: 5
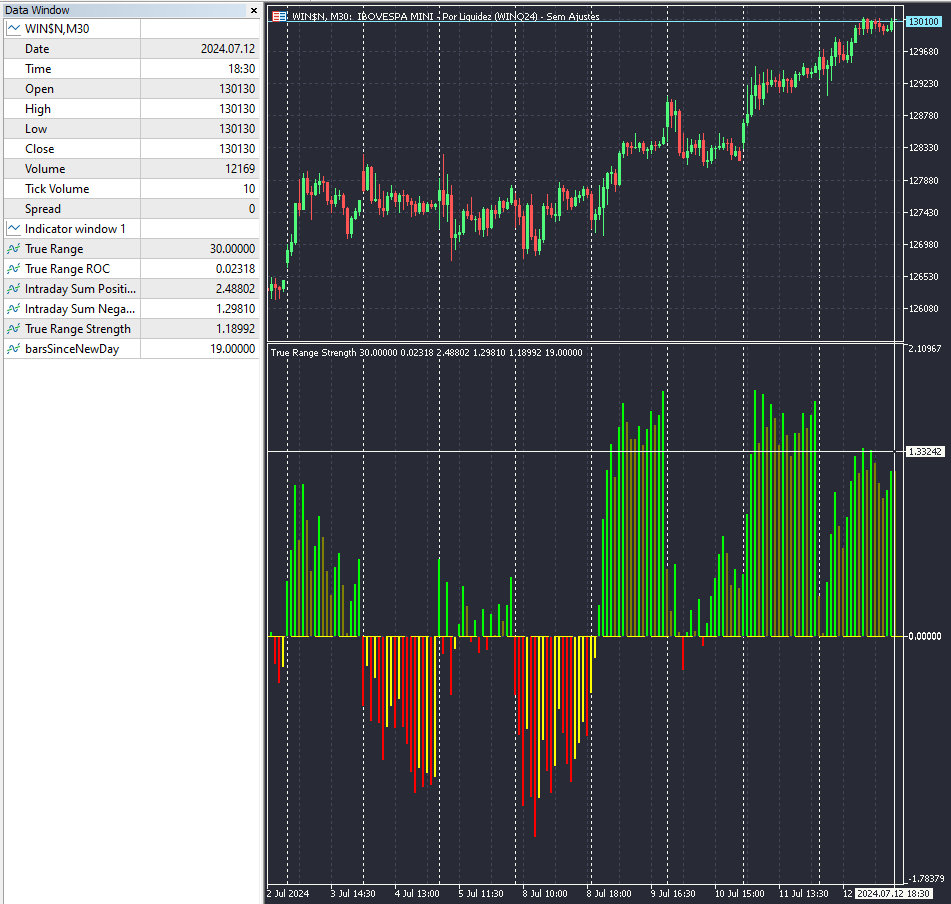
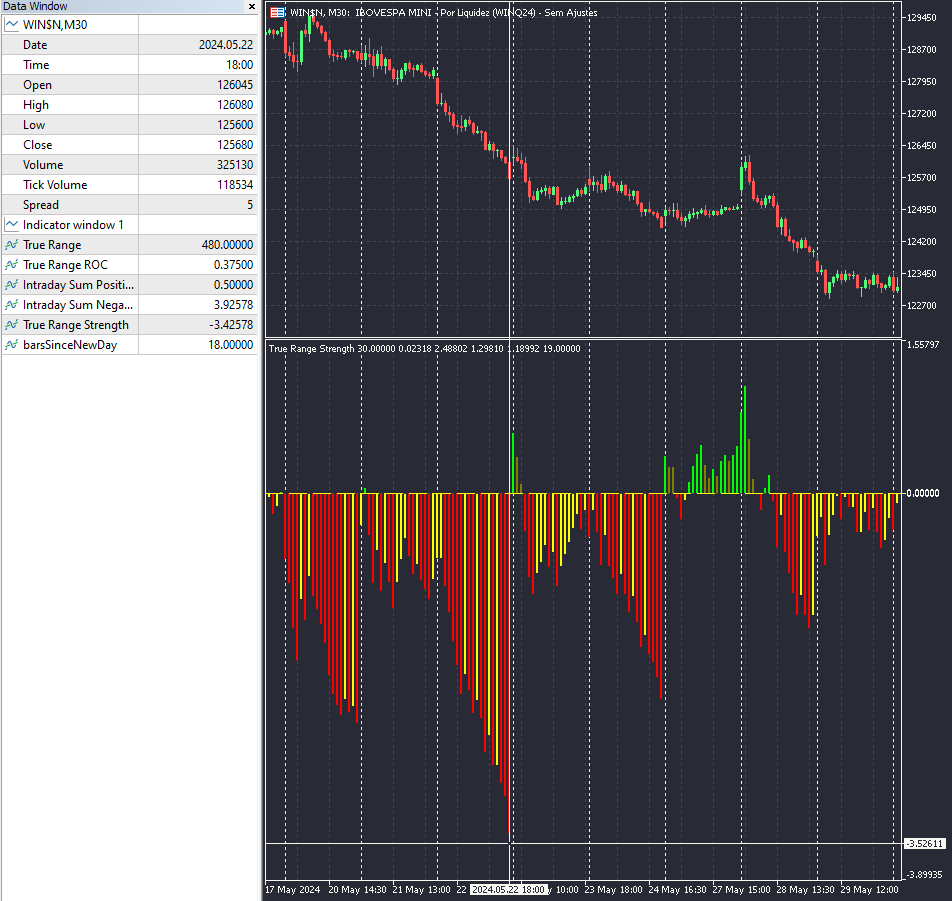
具有高级触发选项的真实范围强度指标
此指标计算并显示与每日价格变化相关的各种指标:
指标
- 真实范围 (TR):
- 最大值 (高点 - 低点, |高点 - 前一收盘价|, |低点 - 前一收盘价|)。真实范围 (TR) 用于衡量每日价格波动的幅度。
- TR 变化率 (TR_ROC):
- TR 相对于每日参考价格的百分比变化。该变化率帮助交易者评估价格相对于基准价格的波动强度。
- 正 TR ROC 的每日总和:
- 积累一天中所有正 TR ROC 值的总和。此指标可以帮助识别价格上升趋势的强度。
- 负 TR ROC 的每日总和:
- 积累一天中所有负 TR ROC 值的总和。此指标可以帮助识别价格下降趋势的强度。
- 正负 TR ROC 的每日总和差异:
- TR ROC 的净累积值。该值显示了价格上涨和下跌的总体力量,并以颜色直方图的形式显示。
使用方法
- 将指标添加到单独的图表窗口中
- 从输入中选择所需的绘图类型、值类型和触发类型
- 使用指标来评估每日波动性和价格趋势
- 颜色直方图提供净累积趋势的快速视觉参考
注意: 此指标在每个交易日开始时重置计算