Spike detector pro
- 指标
- Rocky Clyde Van Coller
- 版本: 1.0
- 激活: 5
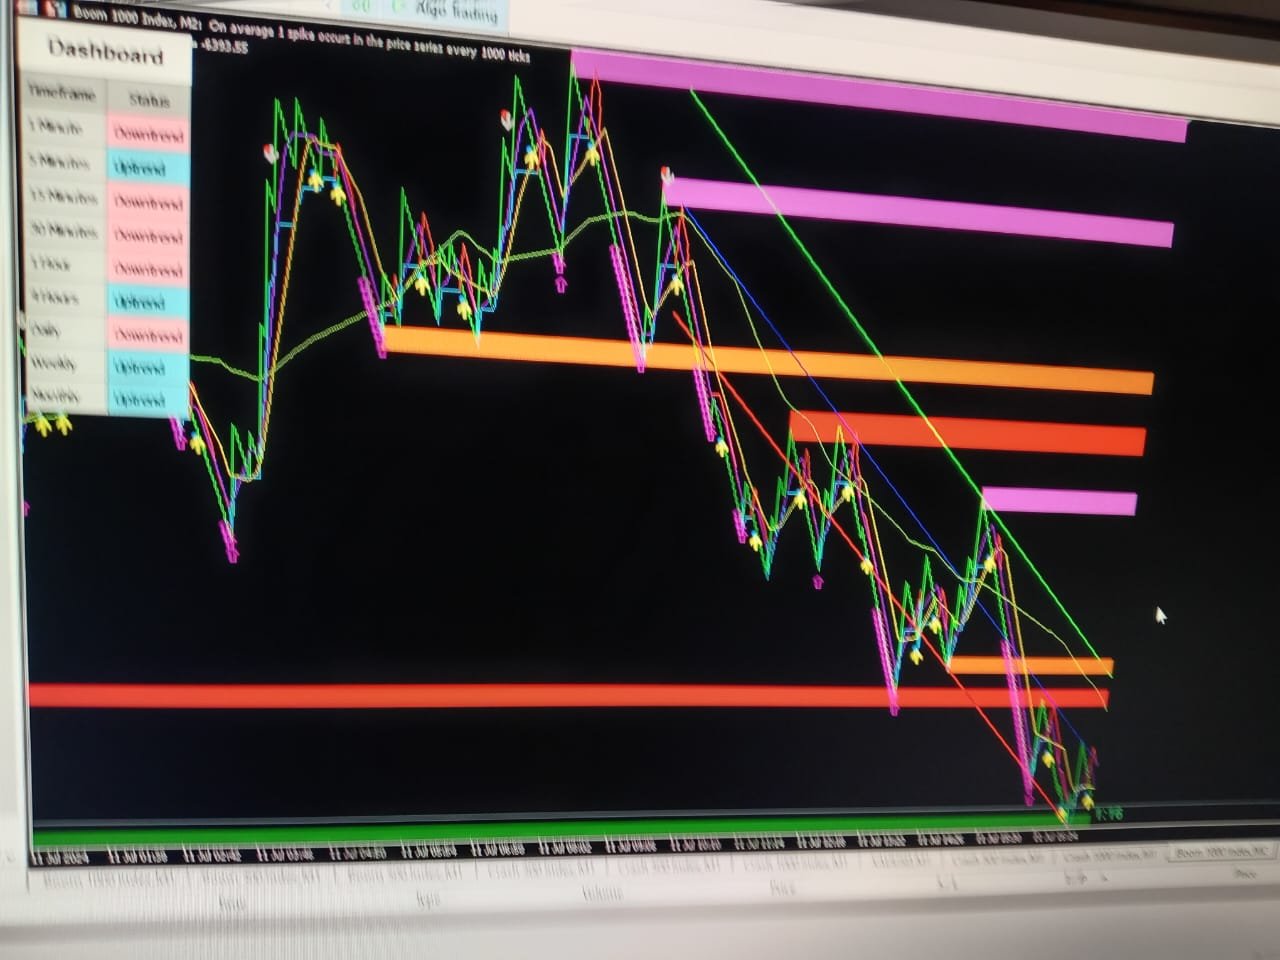
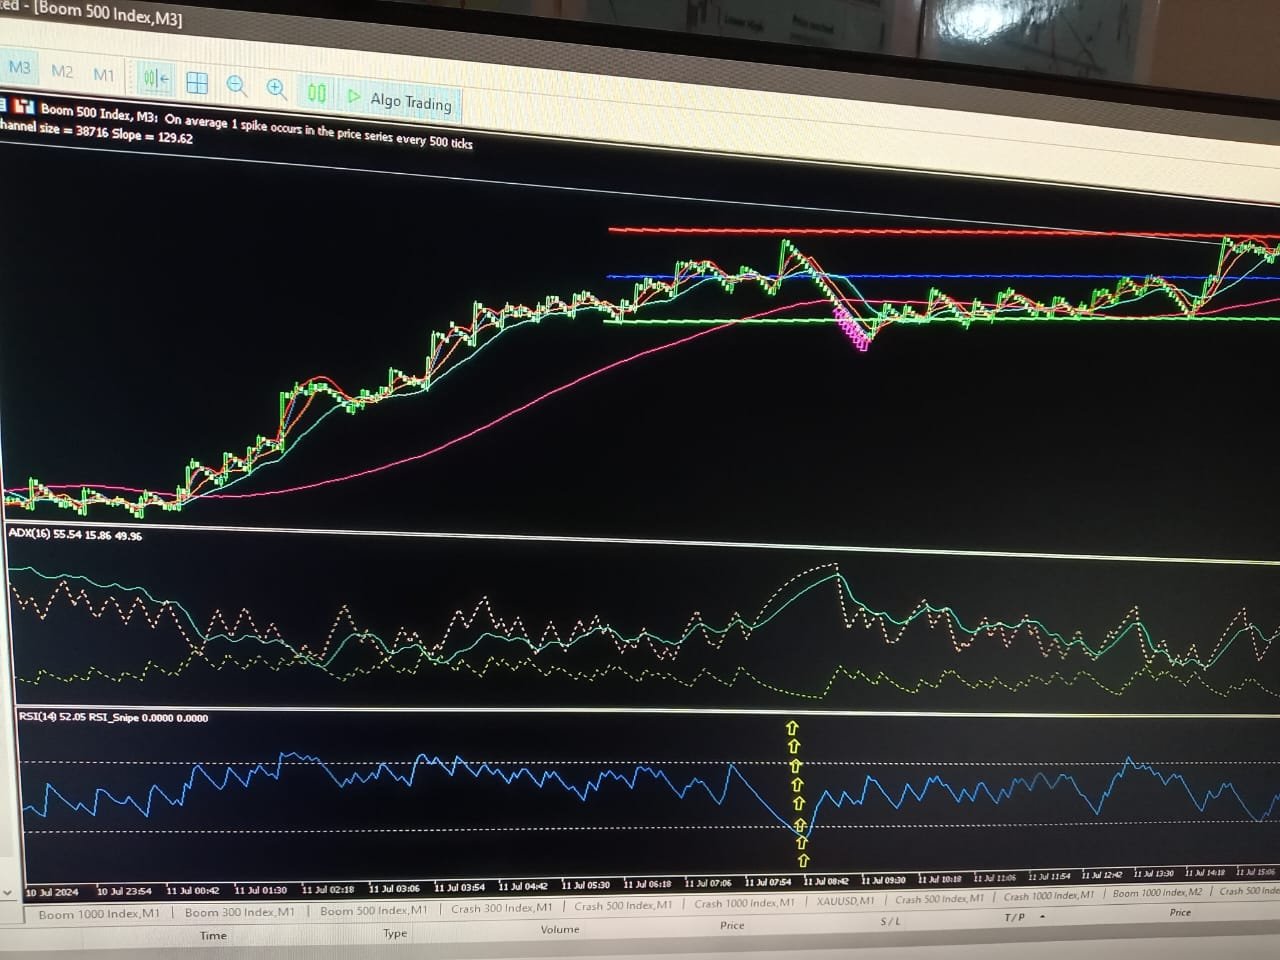
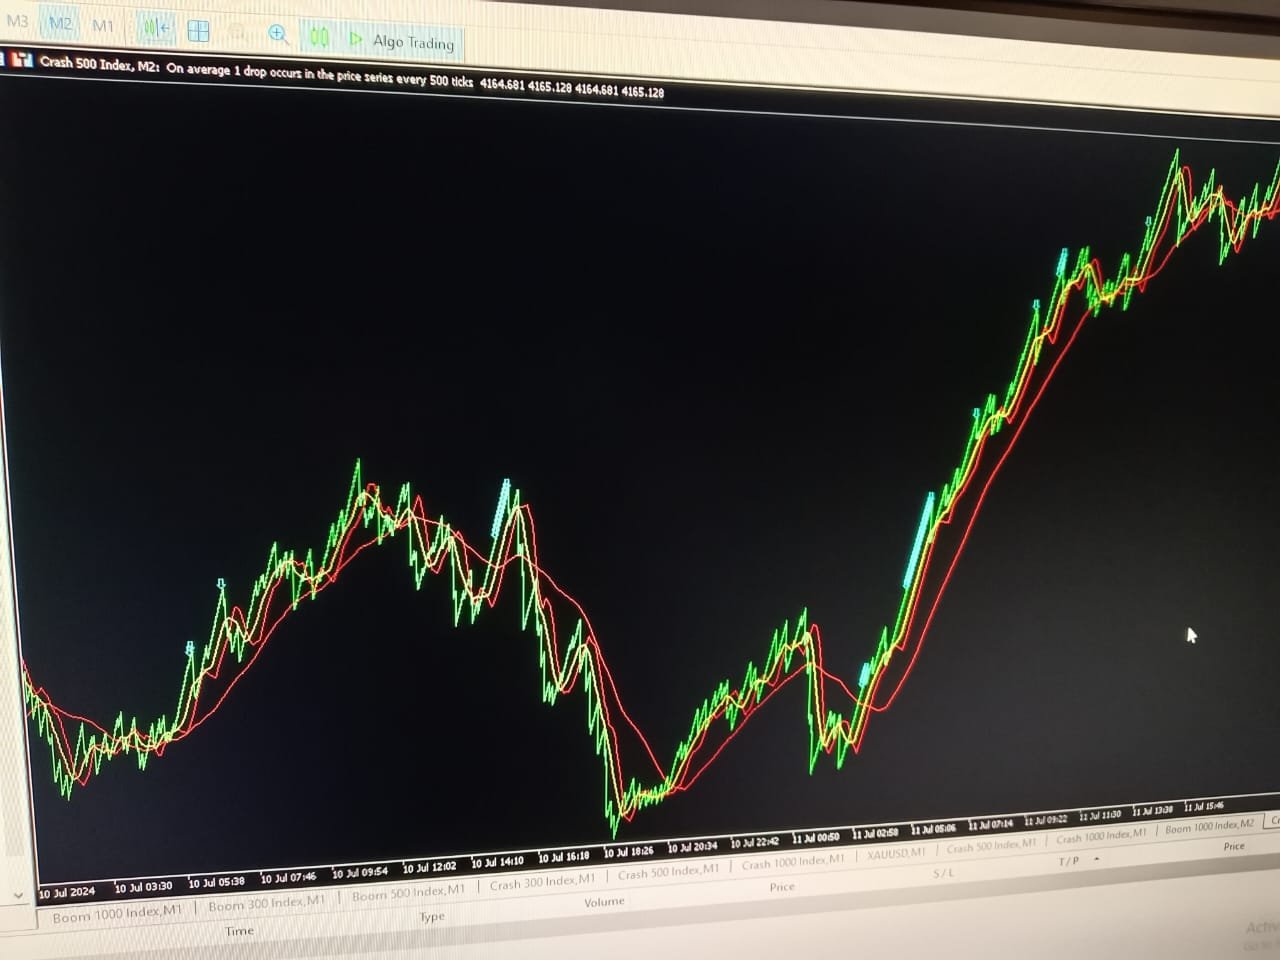
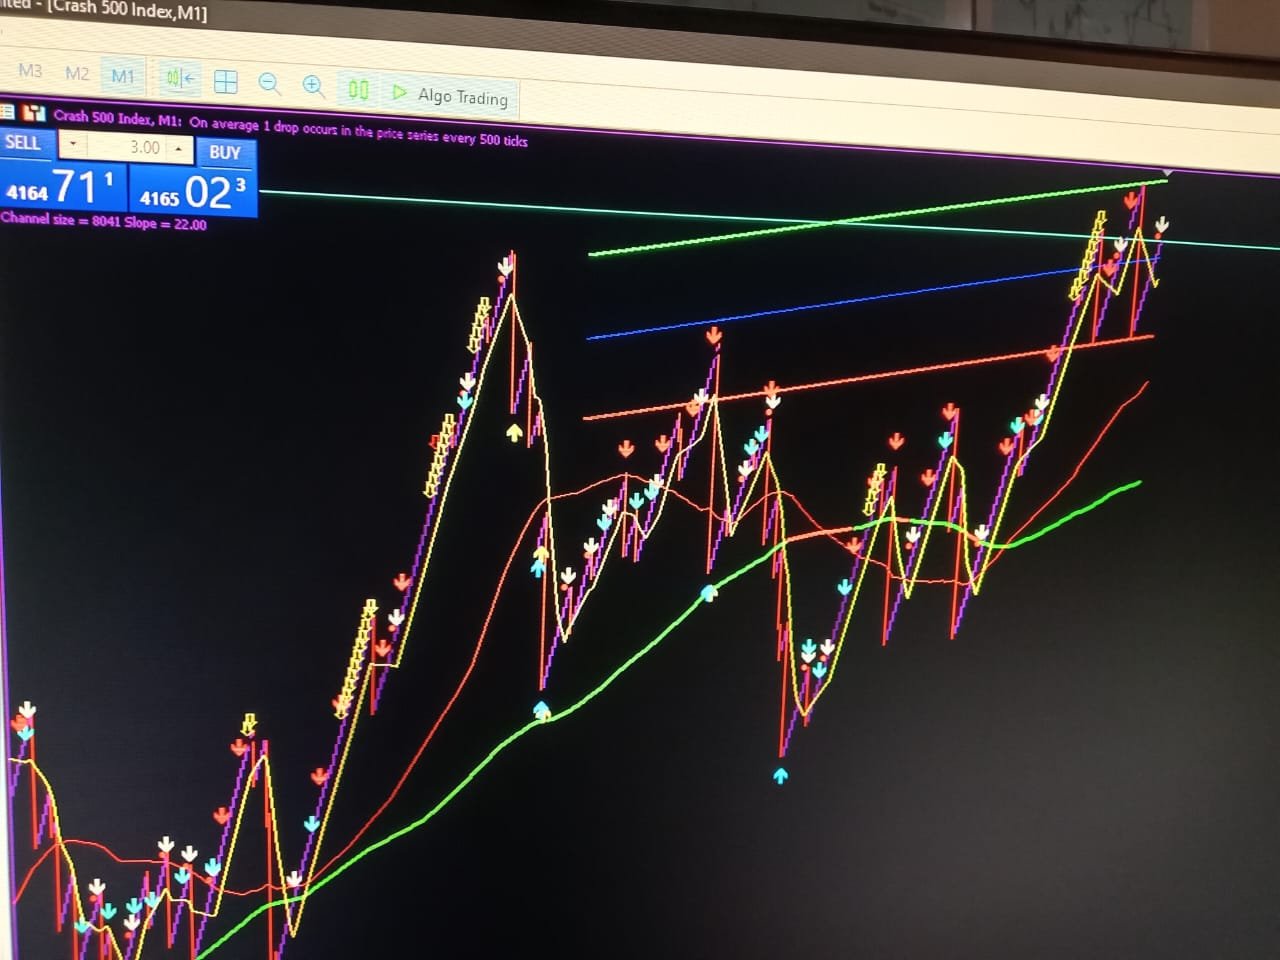
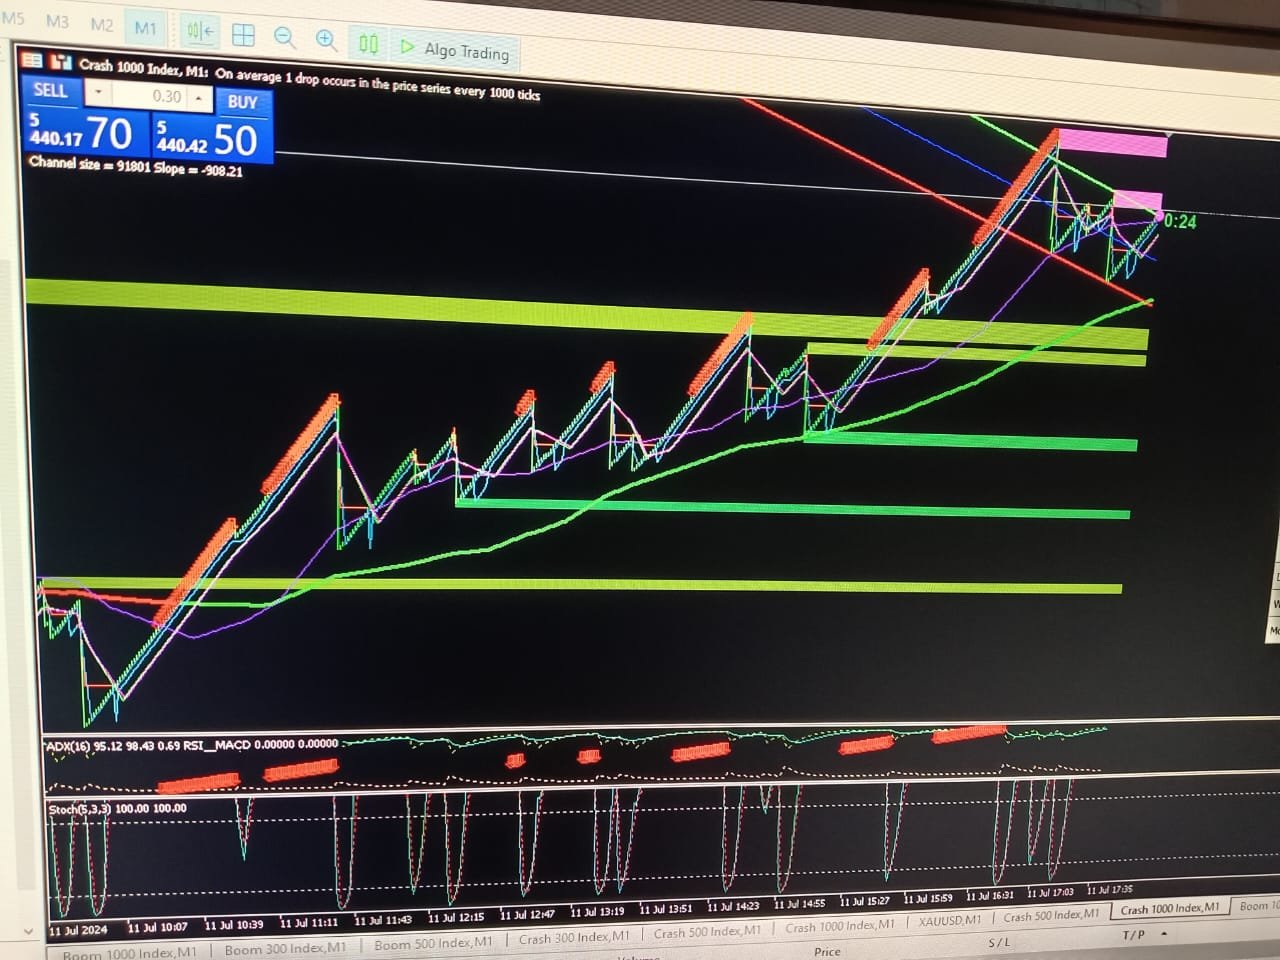
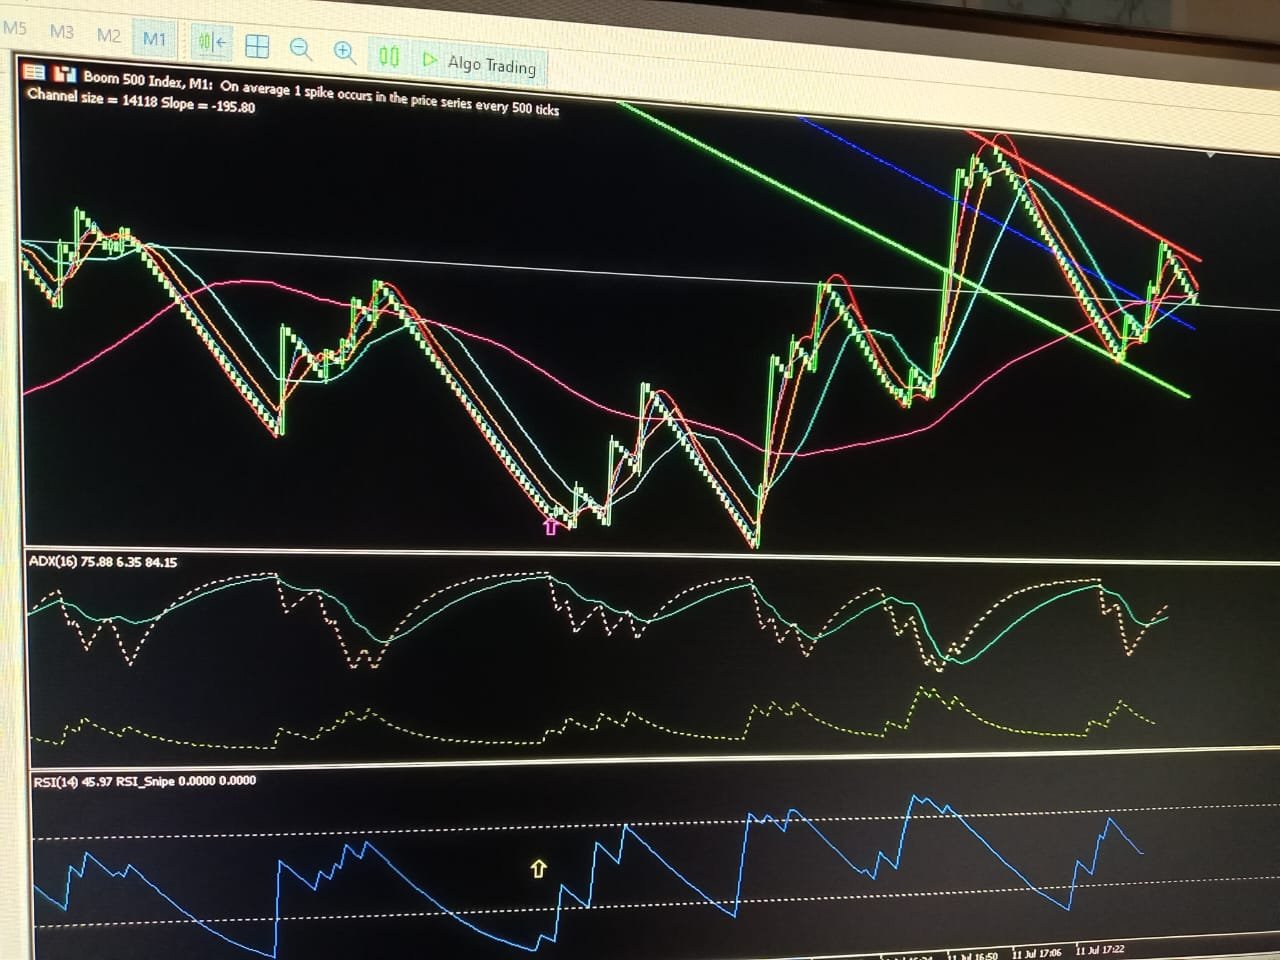
the Spike detector
show multiple indication for entries, for max profits enter on each indication given
u can also add on lots size as entries go to secure max profits before spike occure,
the more entries you enter along the way ,the more profits u have after the initial spike,
after spike hold 3-5 candles before close for max profits .
good on al timeframes
max stop loss is 22candles.