Support and Resistance Malaysian
- 指标
- Pierre Paul Amoussou
- 版本: 1.0
- 激活: 10
Support and Resistance Malaysian是一个自定义指标,旨在在图表上显示支撑和阻力水平。这些水平基于马来西亚支撑和阻力理论,该理论将水平定义为特定的价格水平,而不是区域,这些价格水平是从线图的峰值和谷值中派生出来的。
特点:
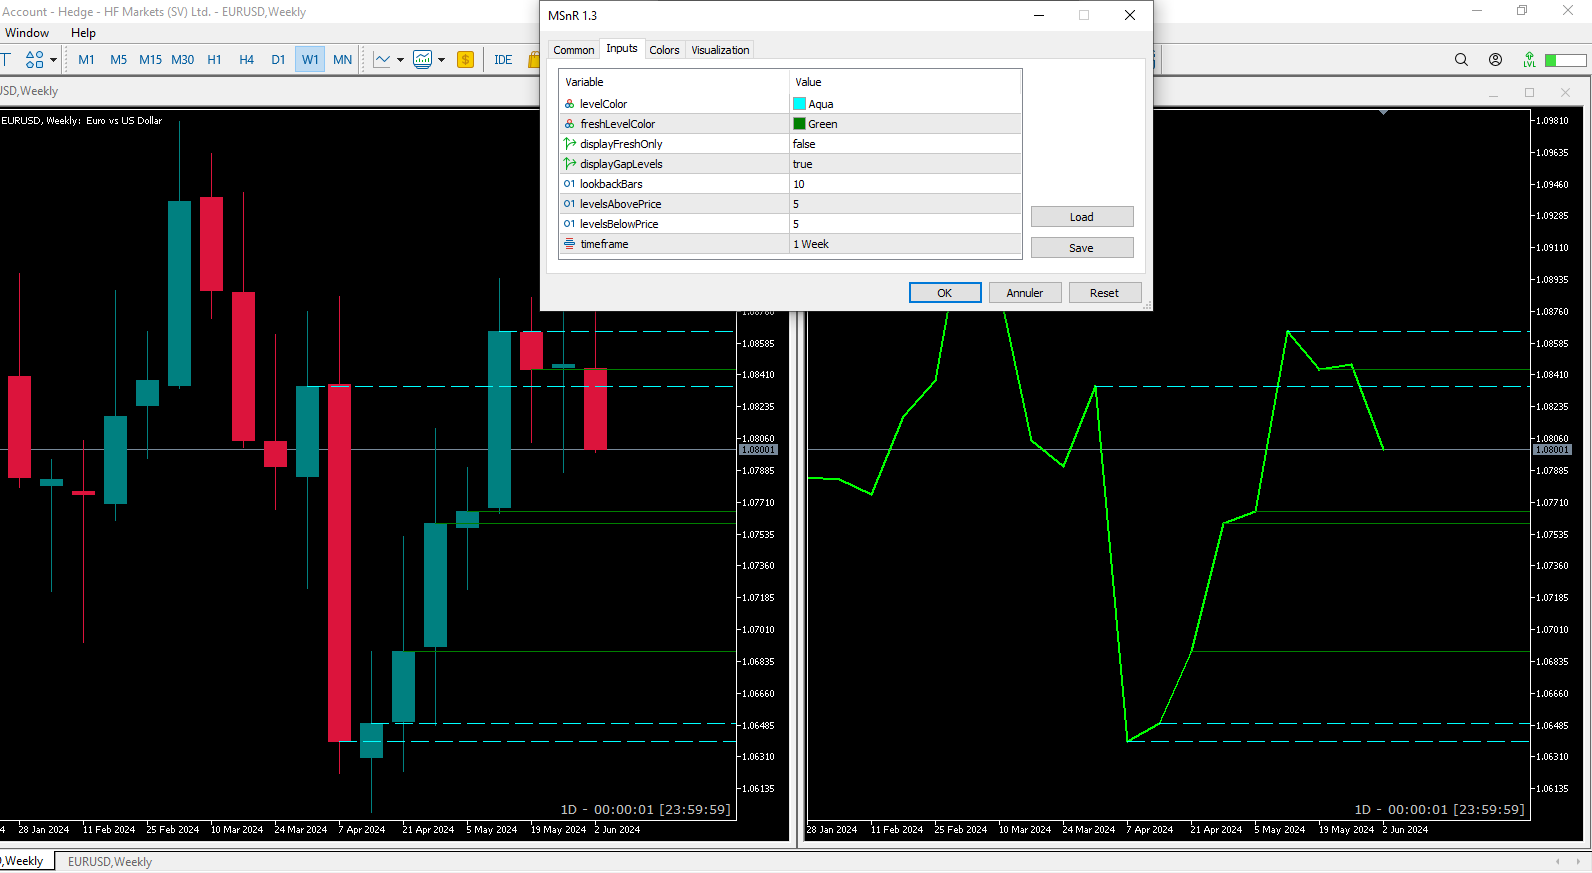
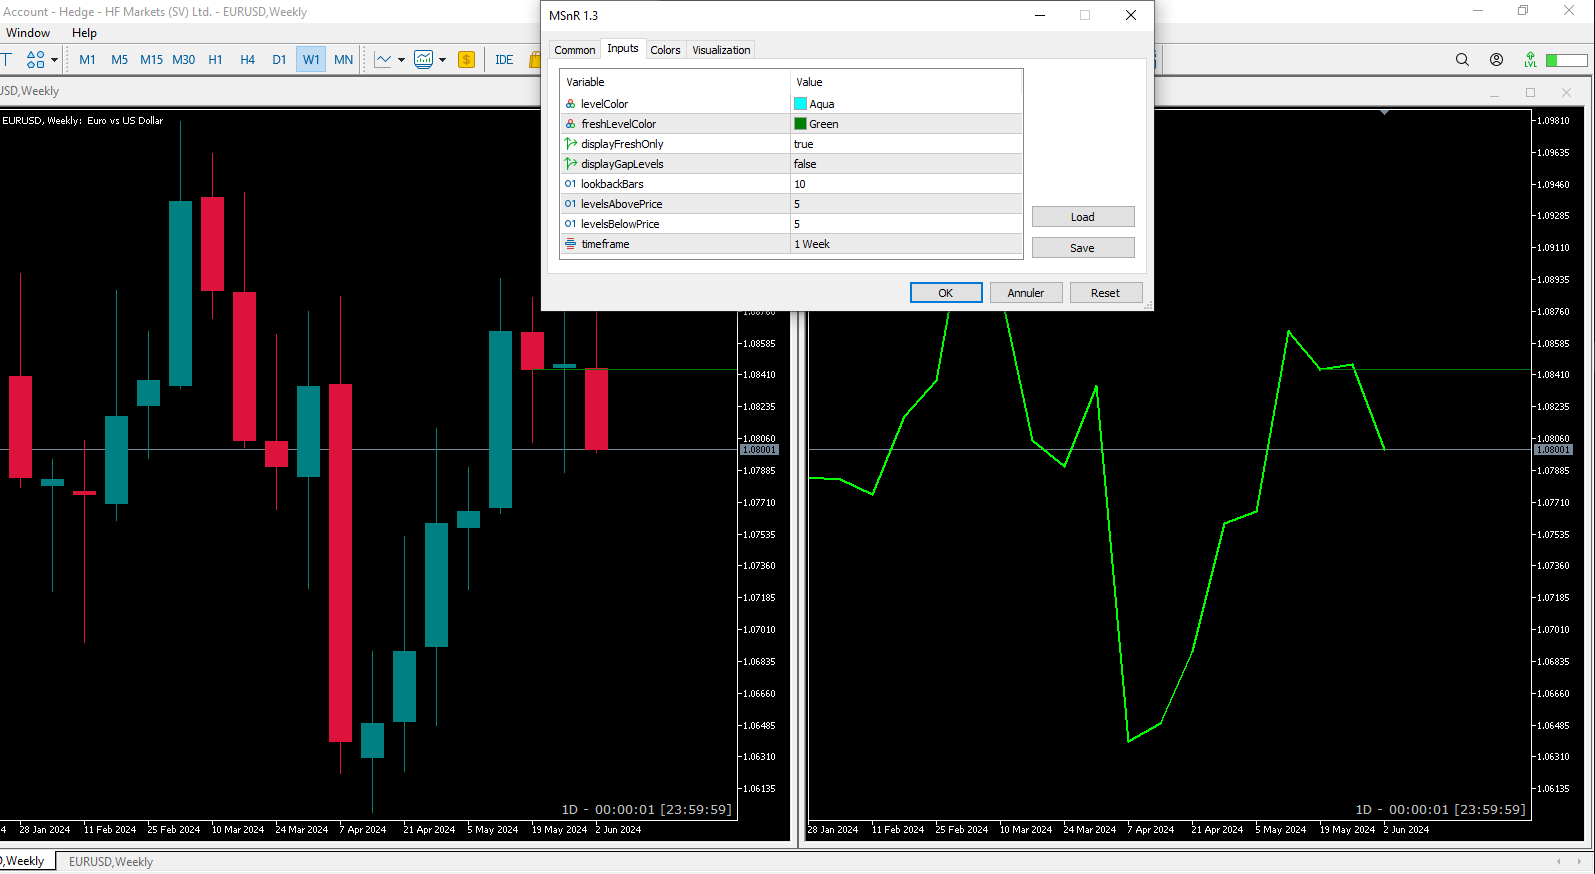
- 三种类型的水平:A-Level,V-Level和间隙水平。
- 水平的新鲜度指示:新鲜水平比非新鲜水平更重要。新鲜水平指尚未被测试或已经被交易。
- 可自定义新鲜水平和非新鲜水平的颜色和样式。
- 仅显示新鲜水平或所有水平的选项。
- 可调整的回溯期和当前价格上下方水平的数量。
- 支持多时间框架。
用途:
交易者可以使用MSnR Lines来识别潜在的支撑和阻力水平以做出交易决策。新鲜水平被认为更为重要,并且可能提供更好的交易机会。此外,交易者还可以根据不同时间框架上的水平来进行多时间框架分析,以提高交易决策的准确性和可靠性。