PI Multiple MAs
- 指标
- Ben Hebblethwaite
- 版本: 1.1
- 更新: 10 七月 2024
- 激活: 5
Pipwise Indicators Multiple MAs
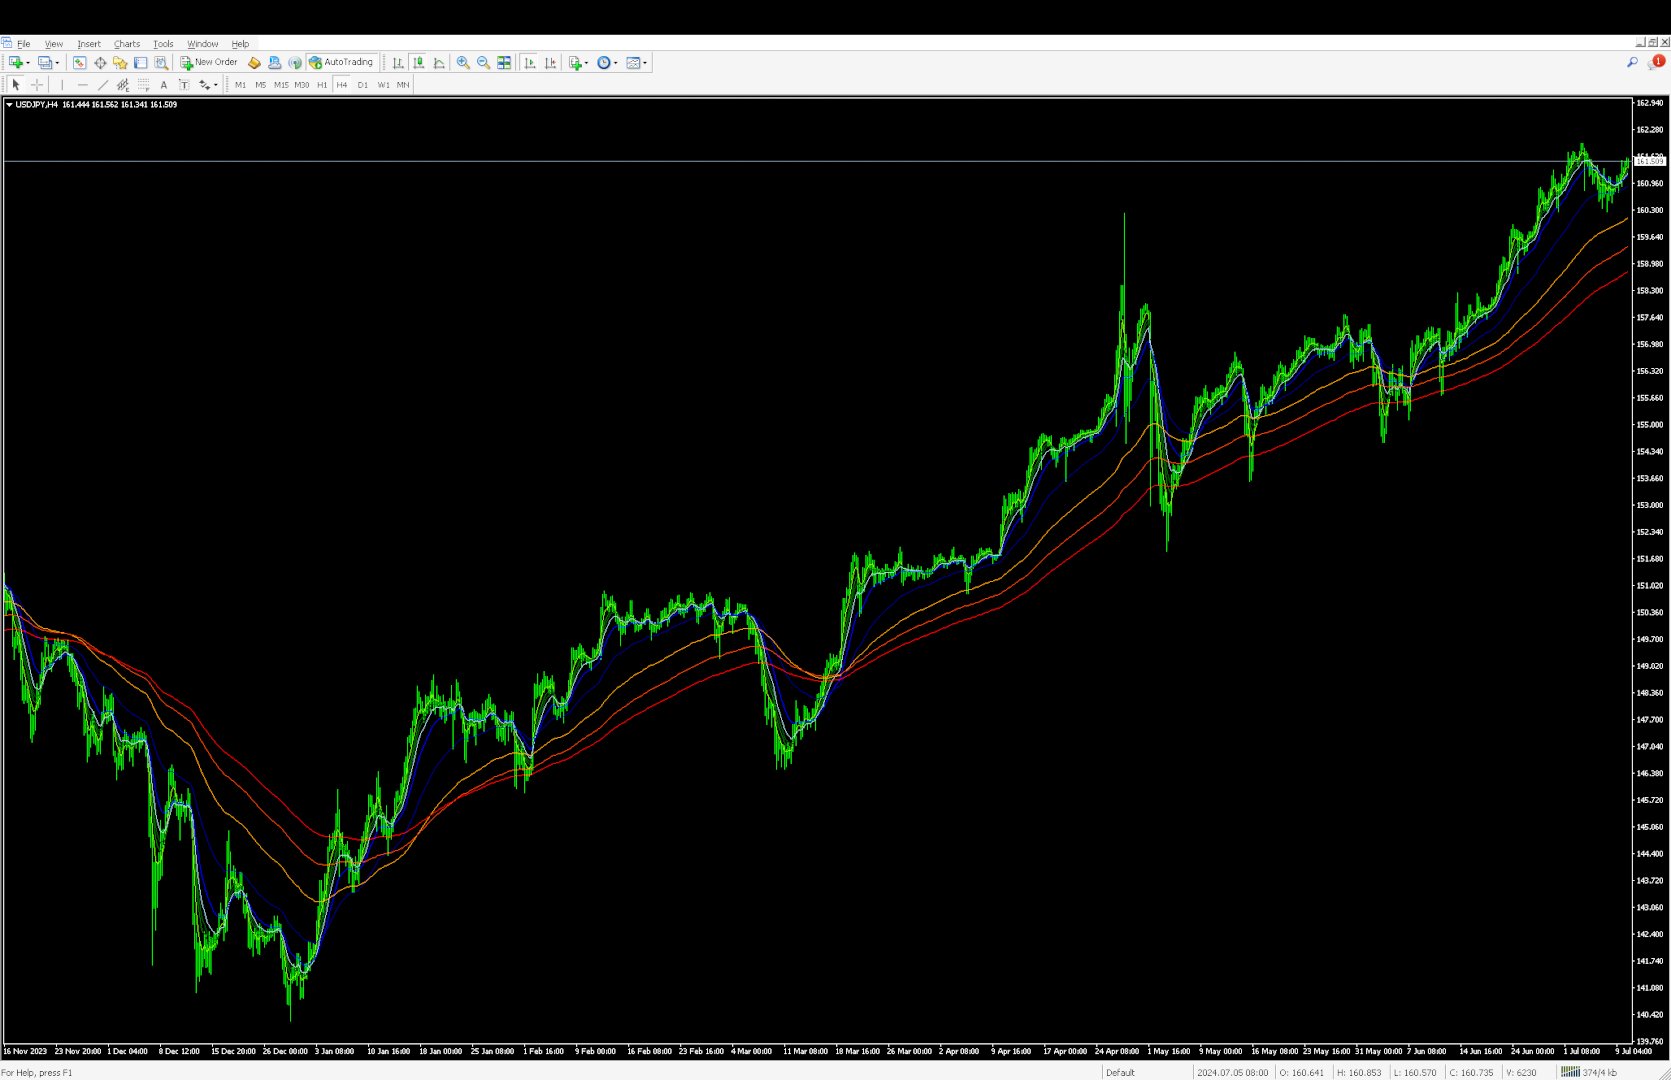
The Pipwise Indicators Moving Averages indicator is a powerful tool for technical analysis in MetaTrader 4 (MT4). It allows traders to visualize and analyze moving averages from multiple periods on a single chart. Here are the key features:
-
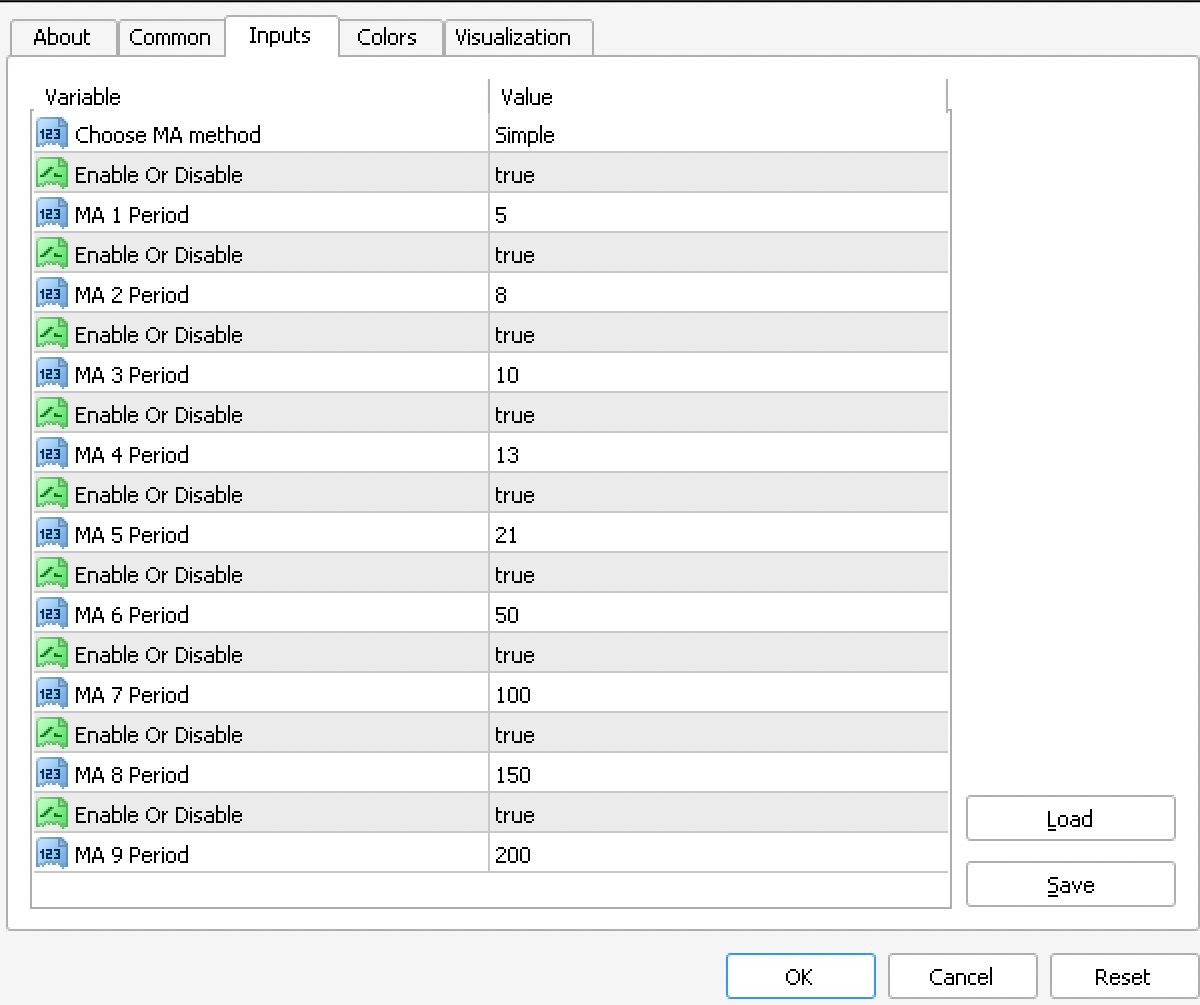
Customizable Moving Averages:
- Traders can choose the number of moving averages to plot (up to 9 MAs).
- Each Moving Average is customiseable.
-
Method Selection:
- The indicator supports various moving average methods, including Simple Moving Average (SMA), Exponential Moving Average (EMA), and others.
- Traders can select the method that best suits their trading strategy.
-
Color Customization:
- Users can change the color of each individual moving average line. This feature allows for easy differentiation and visualization.
- For example, you can assign specific colors to short-term MAs (e.g., green) and long-term MAs (e.g., red).
-
Enable/Disable MAs:
- Traders have the flexibility to enable or disable specific moving averages based on their preferences.
- If a particular MA is not relevant for their analysis, they can toggle it off without removing it from the chart.
-
Visual Clarity:
- The indicator ensures clarity by plotting moving averages from different periods (e.g., 21 , 50, and 200) on the same chart.
- This view helps traders identify trends, support/resistance levels, and potential entry/exit points.
Example Usage:
- To identify trends, observe the slope of moving averages across timeframes. Consistent upward slopes indicate a bullish trend.
- Moving averages can act as support or resistance levels. For instance, if the 50-day MA acts as support, a price drop below it may signal a trend reversal.
- Entry/exit points can be based on crossovers (e.g., entering long when price crosses above the 50-day MA).
Remember that the Pipwise Multiple MAs indicator is a valuable addition to any trader’s toolbox. Feel free to incorporate these features into your Pipwise Indicators! 📈