GO Trend MultiTimeFrame
- 指标
- Martin Alejandro Bamonte
- 版本: 1.0
- 激活: 10
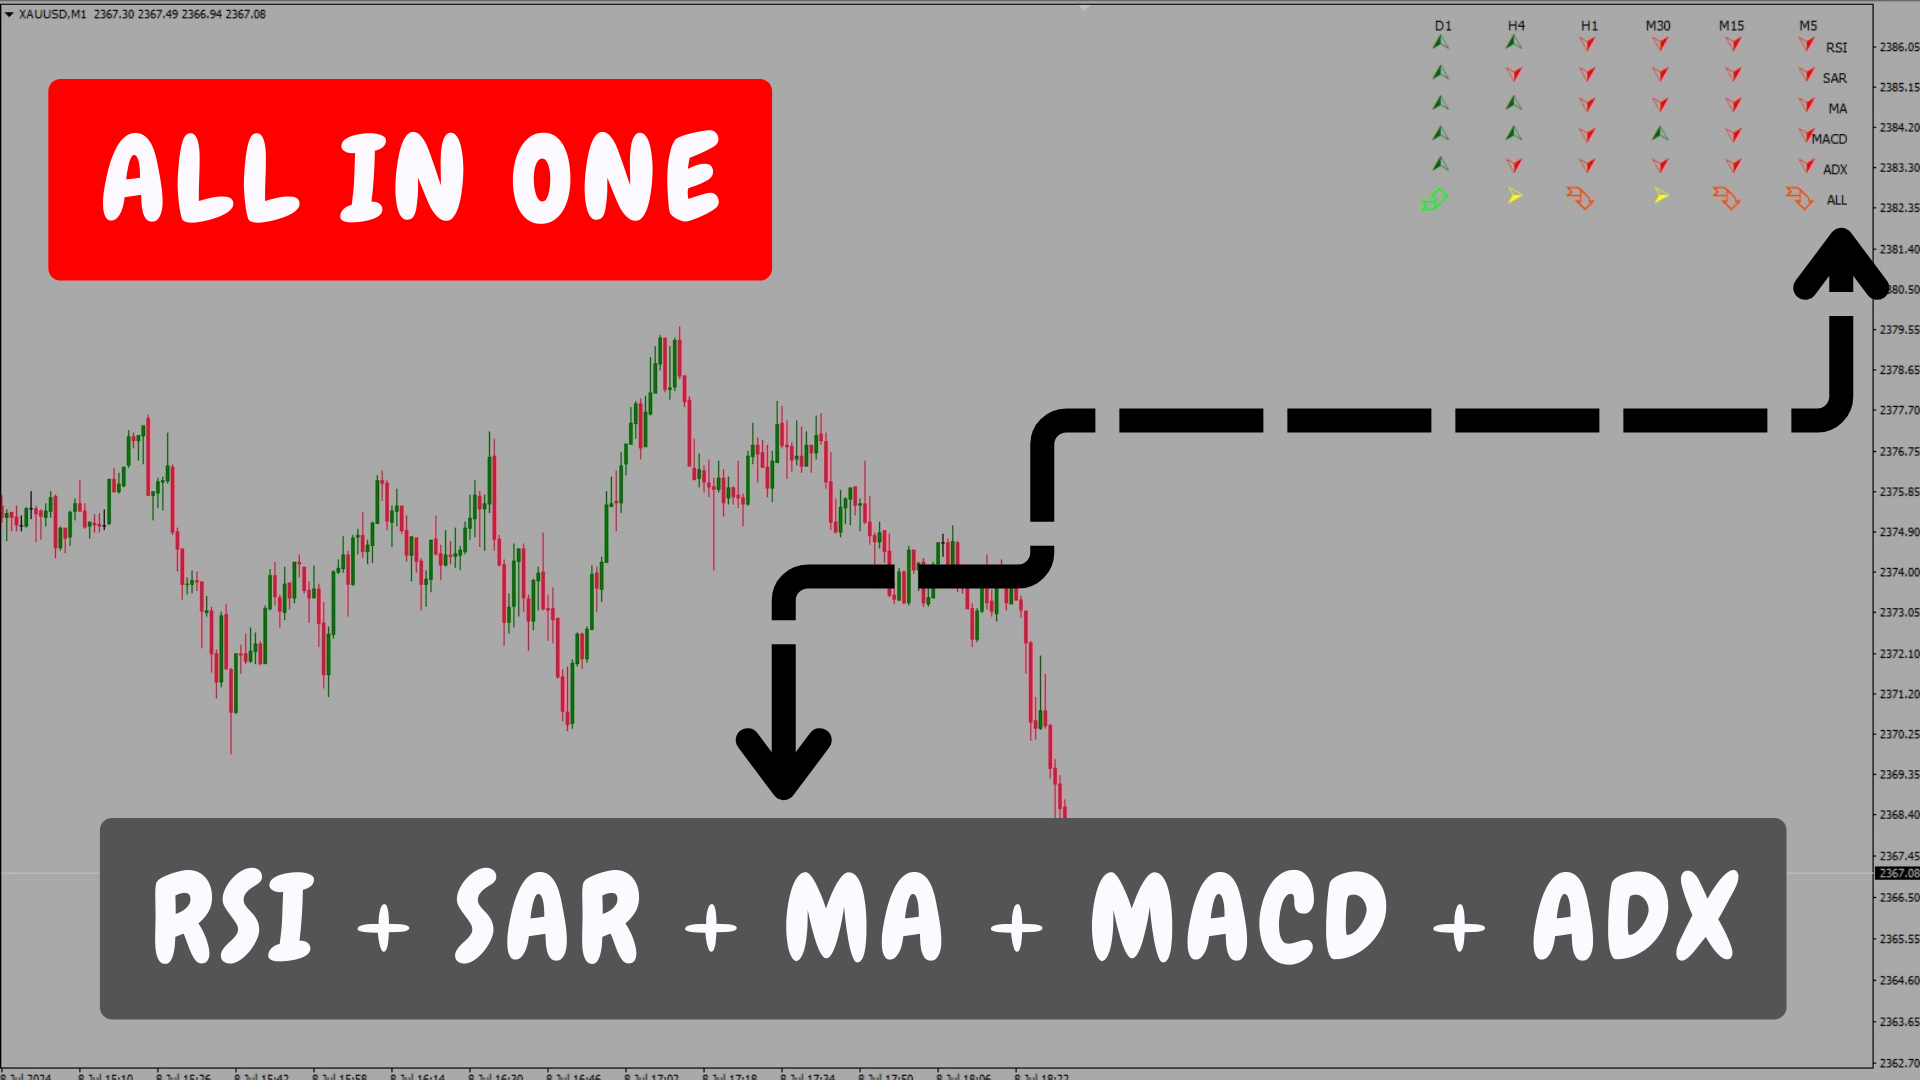
GoTrend 多时间框架指标
"GoTrend Multi-Timeframe" 指标是交易员寻求快速高效地评估不同时间框架内货币对整体和具体趋势的必备工具。
此指标允许交易员一目了然地获得市场方向的清晰全面视图,优化决策过程并提高其交易策略的有效性。
主要特点:
- 多时间框架分析: 此指标提供六个不同时间框架的详尽分析:M5, M15, M30, H1, H4 和 D1,使交易员能够了解每个时间段的趋势。
- 集成技术指标: 此指标使用五个可靠的技术指标:RSI, SAR, MA, MACD 和 ADX,以确定每个时间框架的趋势方向。
- 清晰直观的可视化: 信号显示在主图表的选定角落,使用直观的符号和颜色。这使得交易员能够一目了然地评估市场情况。
- 组合信号: 除了每个指标的单个信号外,"GoTrend Multi-Timeframe" 还提供一个组合信号,总结该货币对的整体市场趋势。
交易优势:
- 快速清晰的趋势概览: 使用此指标,交易员可以快速清晰地看到多个时间框架内的趋势方向,这对于做出知情且及时的决策至关重要。
- 优化进出场点: 不同时间框架内的买卖信号帮助交易员优化进出场点,增加交易成功的可能性。
- 减少市场噪音: 通过关注多个时间框架内的趋势信号,交易员可以过滤掉市场噪音,避免错误进入,从而改善风险管理。
- 易于使用: 指标设置简单,结果显示清晰,即使是初学者交易员也能轻松使用。
使用指标:
- 趋势评估: 在做出交易决策之前,交易员可以检查六个不同时间框架内的趋势。如果大多数时间框架显示买入或卖出信号,这就提供了市场方向的坚实确认。
- 进出场策略: 使用单个信号识别最佳进出场点。例如,多个时间框架内的买入信号可能表明是进入多头头寸的好时机。
- 交易管理: "ALL" 组合信号提供该货币对趋势的总体视图,帮助交易员在正确的趋势方向上保持头寸,或在与总体趋势相同的方向上开设新交易。
指标设置:
- 图表位置: 指标显示在主图表的角落,具有可定制的间距和符号大小设置。
- 可定制颜色: "买入," "卖出" 和 "无信号" 信号的颜色可根据交易员的视觉偏好进行定制。
报警限制:
由于其灵活的设计能够适应所有类型的交易,因此该指标没有也不能有报警。这包括在单个时间框架内交易、跨时间框架交易或使用更高时间框架确定趋势,然后在较低时间框架内寻找进场点。固定报警不适用于"GoTrend Multi-Timeframe" 的多功能和适应性特性。
"GoTrend Multi-Timeframe" 是任何希望简化决策过程并优化交易的交易员的完美助手。通过清晰的可视化和对多个时间框架内趋势的深入分析,此指标提供了必要的信息,以更快地了解货币对的情况,从而做出更准确的交易决策。
输入参数说明:
- scaleX (数值: 60): 定义图表上显示的信号之间的水平距离。此数值调整图标之间的间距,以便清晰有序的可视化。
- scaleY (数值: 25): 定义图表上显示的信号之间的垂直距离。此数值调整图标之间的间距,以避免重叠并确保易于阅读。
- offSetX (数值: 45): 设置从图表左边缘到第一个信号图标的水平距离。允许将信号定位在图表的所需位置。
- offSetY (数值: 20): 设置从图表顶部到第一个信号图标的垂直距离。允许将信号定位在图表的所需位置。
- fontSize (数值: 15): 信号图标的字体大小。此数值决定图标在图表上显示的大小。
- corner (数值: 2): 定义信号将在图表的哪个角落定位。数值可以是:
- 0: 左上角
- 1: 右上角
- 2: 左下角
- 3: 右下角
- symbolCodeBuy (数值: 217): 表示买入信号的符号代码。此代码对应于 "Wingdings" 字体中的特定字符。
- symbolCodeSell (数值: 218): 表示卖出信号的符号代码。此代码对应于 "Wingdings" 字体中的特定字符。
- symbolCodeNoSignal (数值: 216): 表示无信号的符号代码。此代码对应于 "Wingdings" 字体中的特定字符。
- allBuy (数值: 200): 表示组合买入信号的符号代码。此代码对应于 "Wingdings" 字体中的特定字符。
- allSell (数值: 202): 表示组合卖出信号的符号代码。此代码对应于 "Wingdings" 字体中的特定字符。
信号颜色:
- signalBuyColor (强劲买入) - (颜色: DarkGreen): 表示强劲买入信号的符号颜色。
- signalSellColor (强劲卖出) - (颜色: Red): 表示强劲卖出信号的符号颜色。
- noSignalColor (无信号) - (颜色: Goldenrod): 表示无信号的符号颜色。
- allSellColor (颜色: OrangeRed): 表示组合卖出信号的符号颜色。
- allBuyColor (颜色: Lime): 表示组合买入信号的符号颜色。
- textColor (颜色: Black): 描述时间段 (M5, M15, M30, H1, H4, D1) 和指标名称 (RSI, SAR, MA, MACD, ADX, ALL) 的文本颜色。
这些参数允许根据每个交易员喜欢使用的图表颜色自定义外观。