Pattern 5W Scan MT5
Introduction
The Elliott Wave in technical analysis describes price movements in the financial market that are related to changes in trader sentiment and psychology.
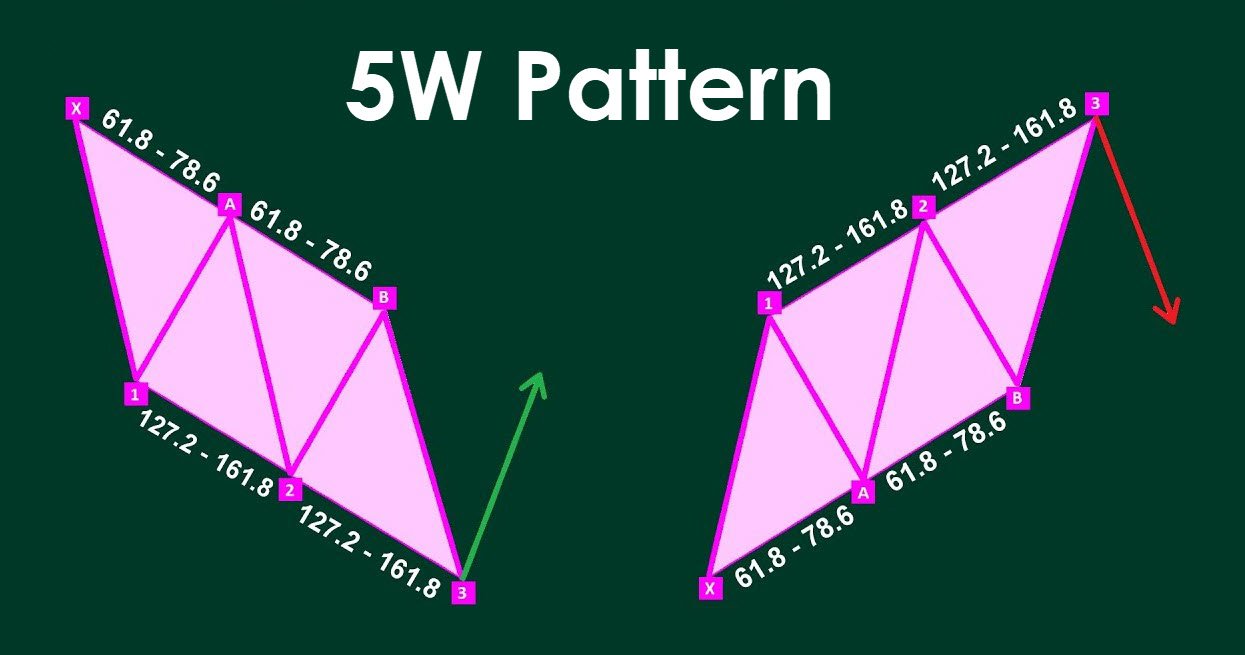
The 5 W Pattern (Known as 3 Drives) is an Elliott Wave pattern that is formed by 5 consecutive symmetrical moves up or down. In its bullish form, the market is making 5 drives to a bottom before an uptrend forms. In a bearish 5-drive, it is peaking before the bears take over.
5W Pattern Scanner
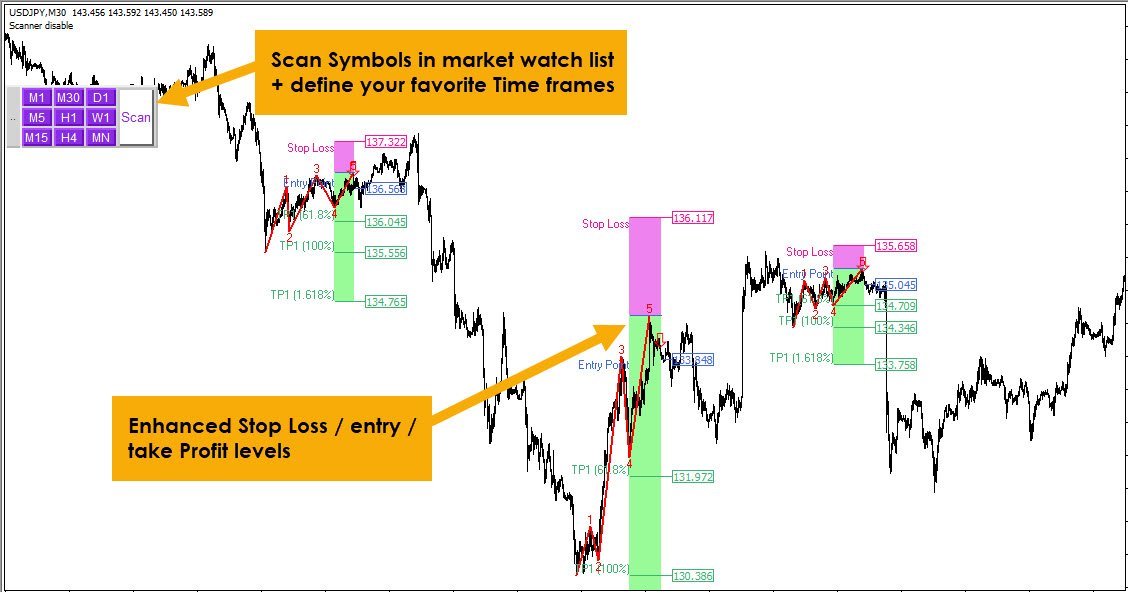
It is easy for a trader to recognize patterns on scanner chart by scanning many charts and time frames in same time without trader's mistake in calculations. This indicator can automatically scan all symbols and time frames to find possible patterns in one chart.
Scan, Fibonacci calculations and pattern recognition are completely done by 5W Pattern Scanner indicator; All you do is "press the scan button". It sends alert and push notification on your mobile.
How To Work
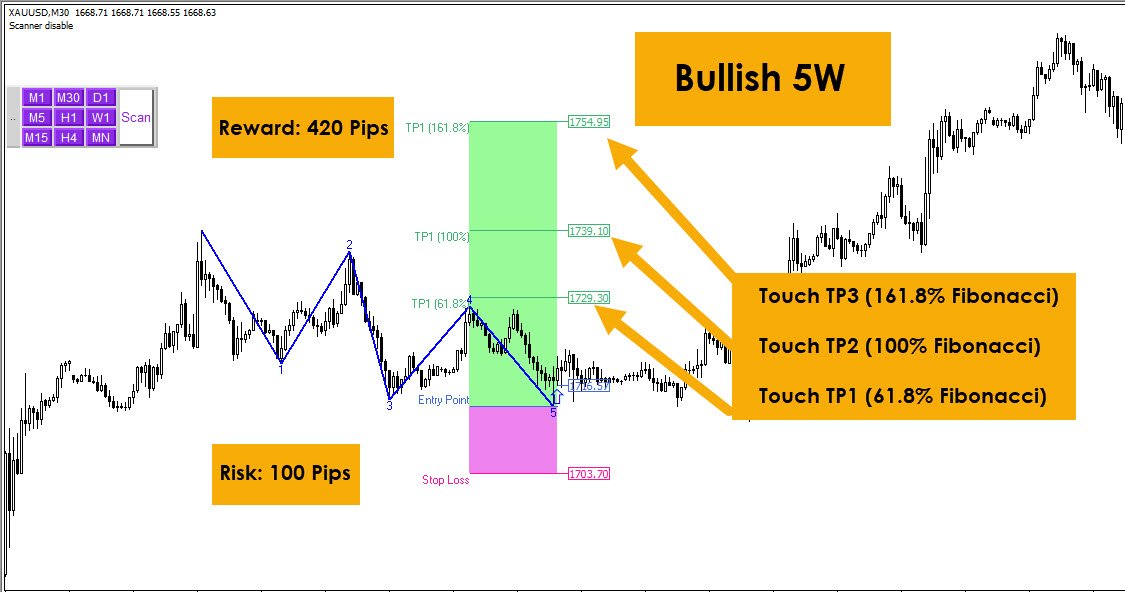
Default setting is best practice and you can just add it on chart and use 5W Pattern Scanner indicator, then you have signals with entry point, stop-loss, and take-profit by clear signal to decide a strong trade.