Bulls And Bears Trend Power
- 指标
- Riche Graig Daketingue Ndombi
- 版本: 1.0
- 激活: 10
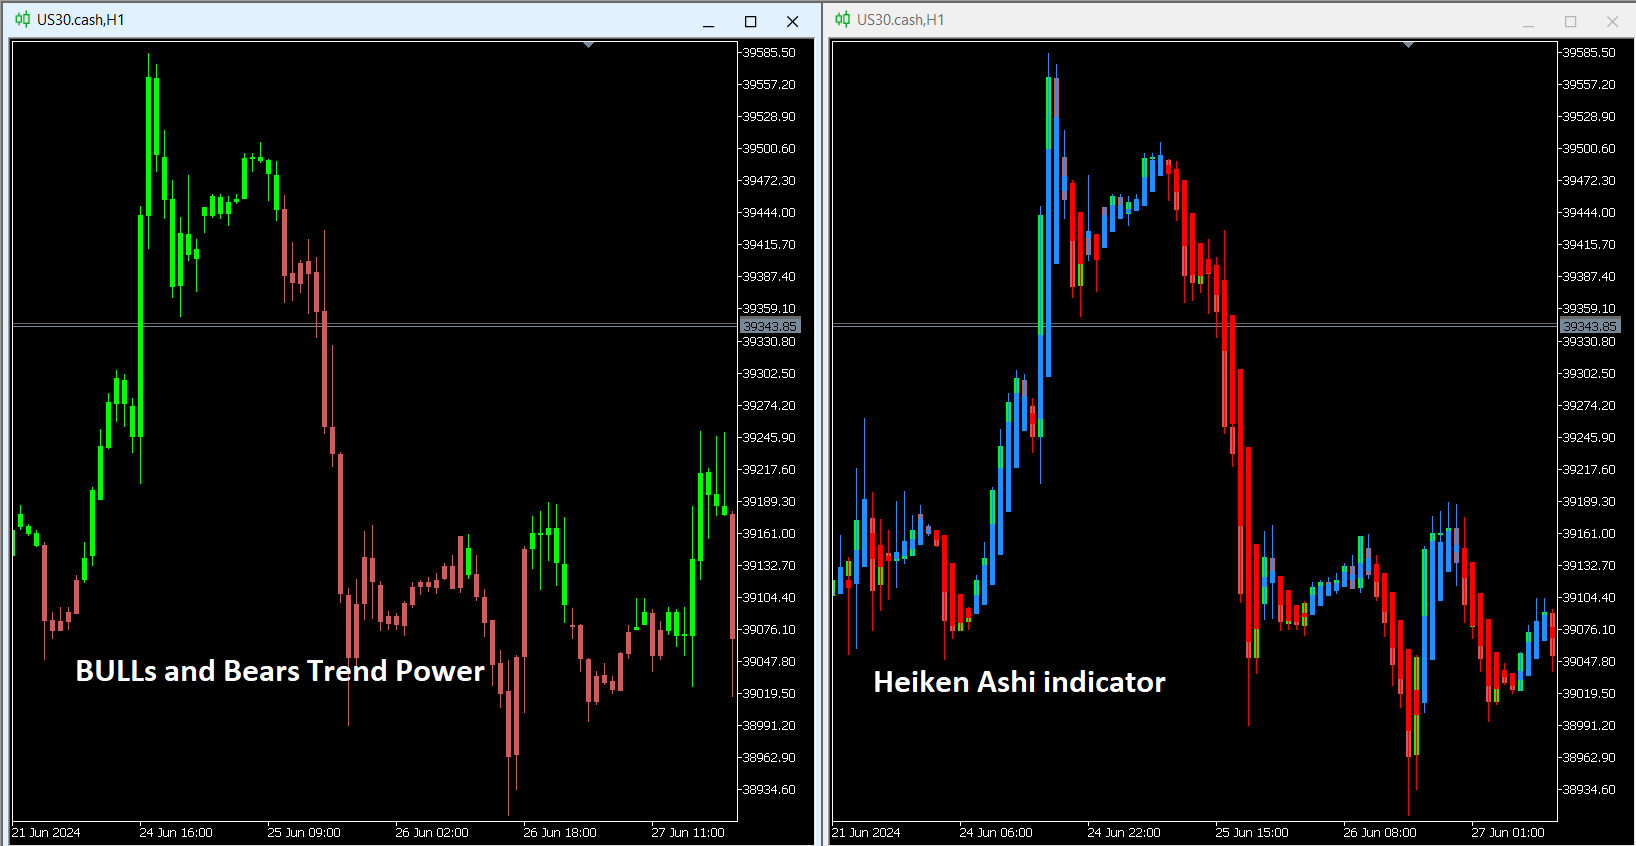
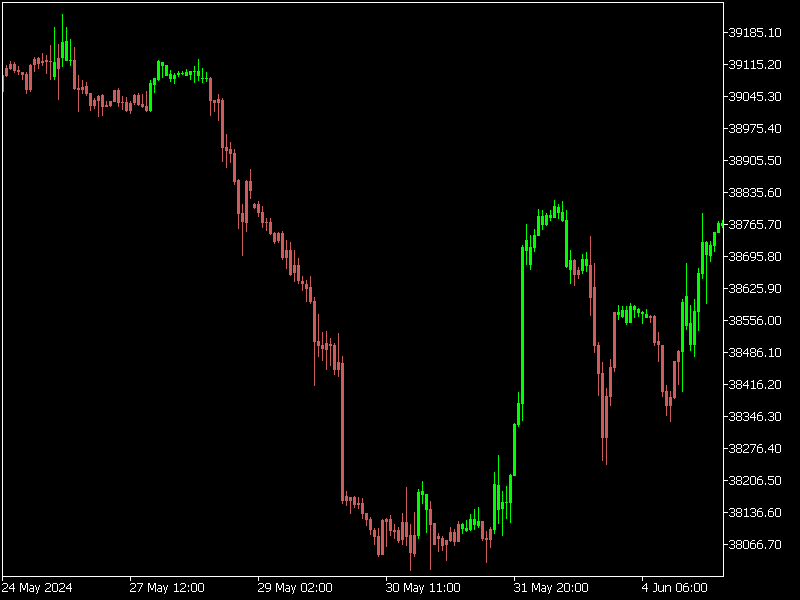
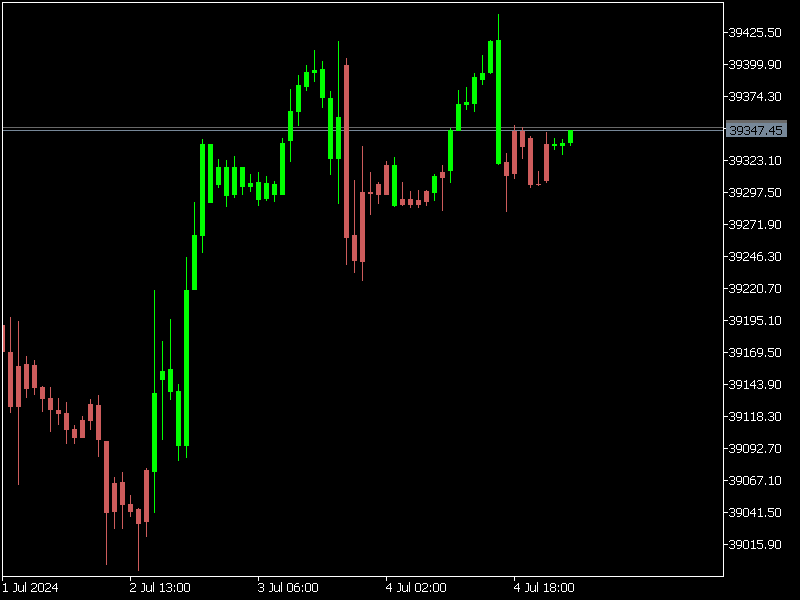
Bulls and Bears trend Power
The Bulls and Bears trend Power is a no repaint versatile technical analysis tool that helps traders identify market trends and see who's in control. It features dynamic trend capture logic that adapts to market conditions for a clear visual representation of trend direction. Traders can customize the colors to suit their preferences.
Features :
- Trend identification
- Compensation of market noise by strength of sellers or buyers
Recommendations :
- Use H1 timeframe and more
- Refresh the chart each time you change timeframe
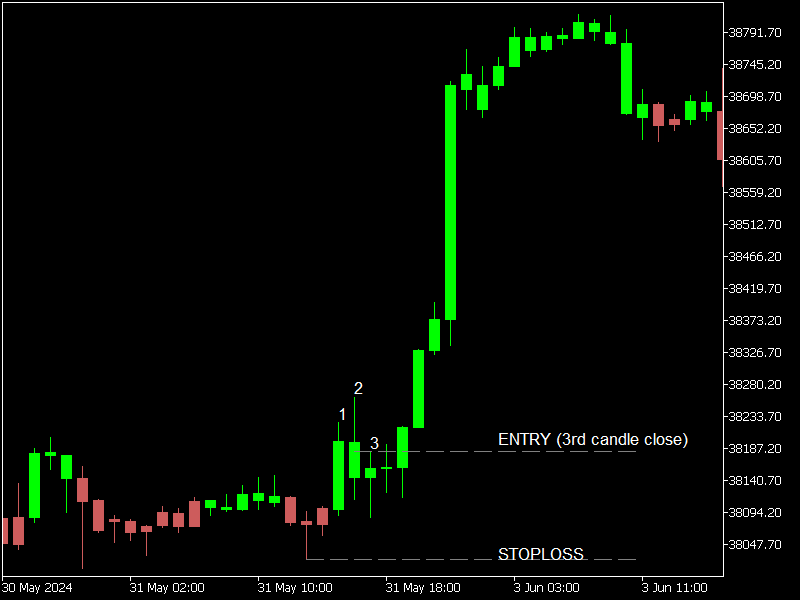
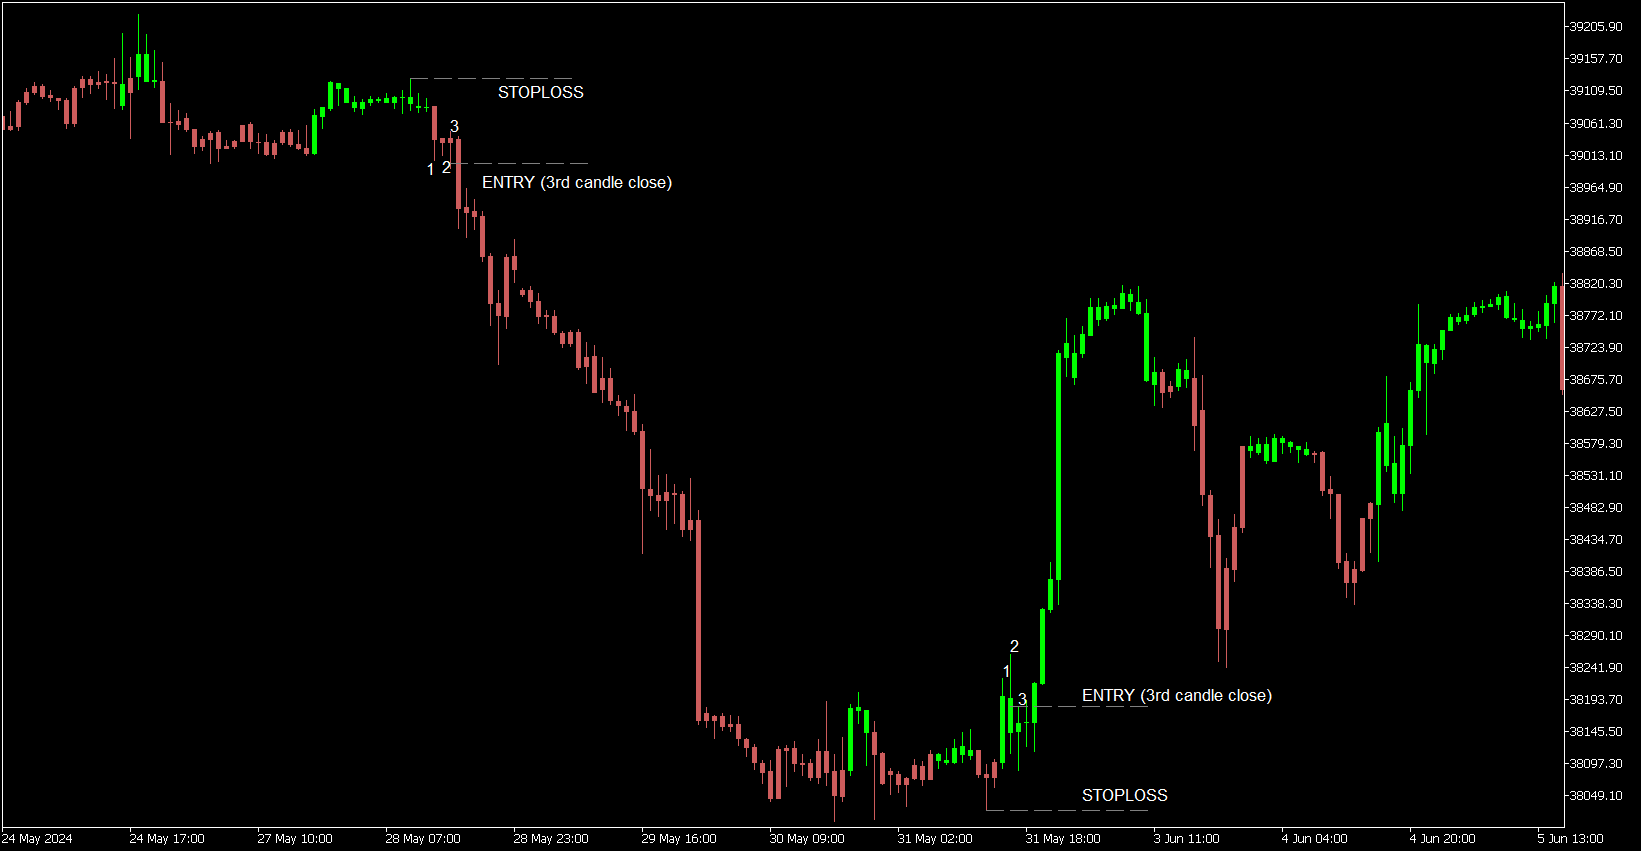
- Wait for the third candle of the same color to close before making a decision.
Translated with DeepL.com (free version)