Multiple Symbols Price Action Scanner MT5
- 指标
- Yu Fan Zhang
- 版本: 1.2
- 更新: 18 七月 2024
- 激活: 5
Price Action Scanner 是一款识别价格行为并给予提醒的指标 . 这款指标可以同时检测最多6个品种 , 不同时间周期的信号 . 通过设置分隔符 , 来添加不同的品种名称 , 不同的时间周期 .
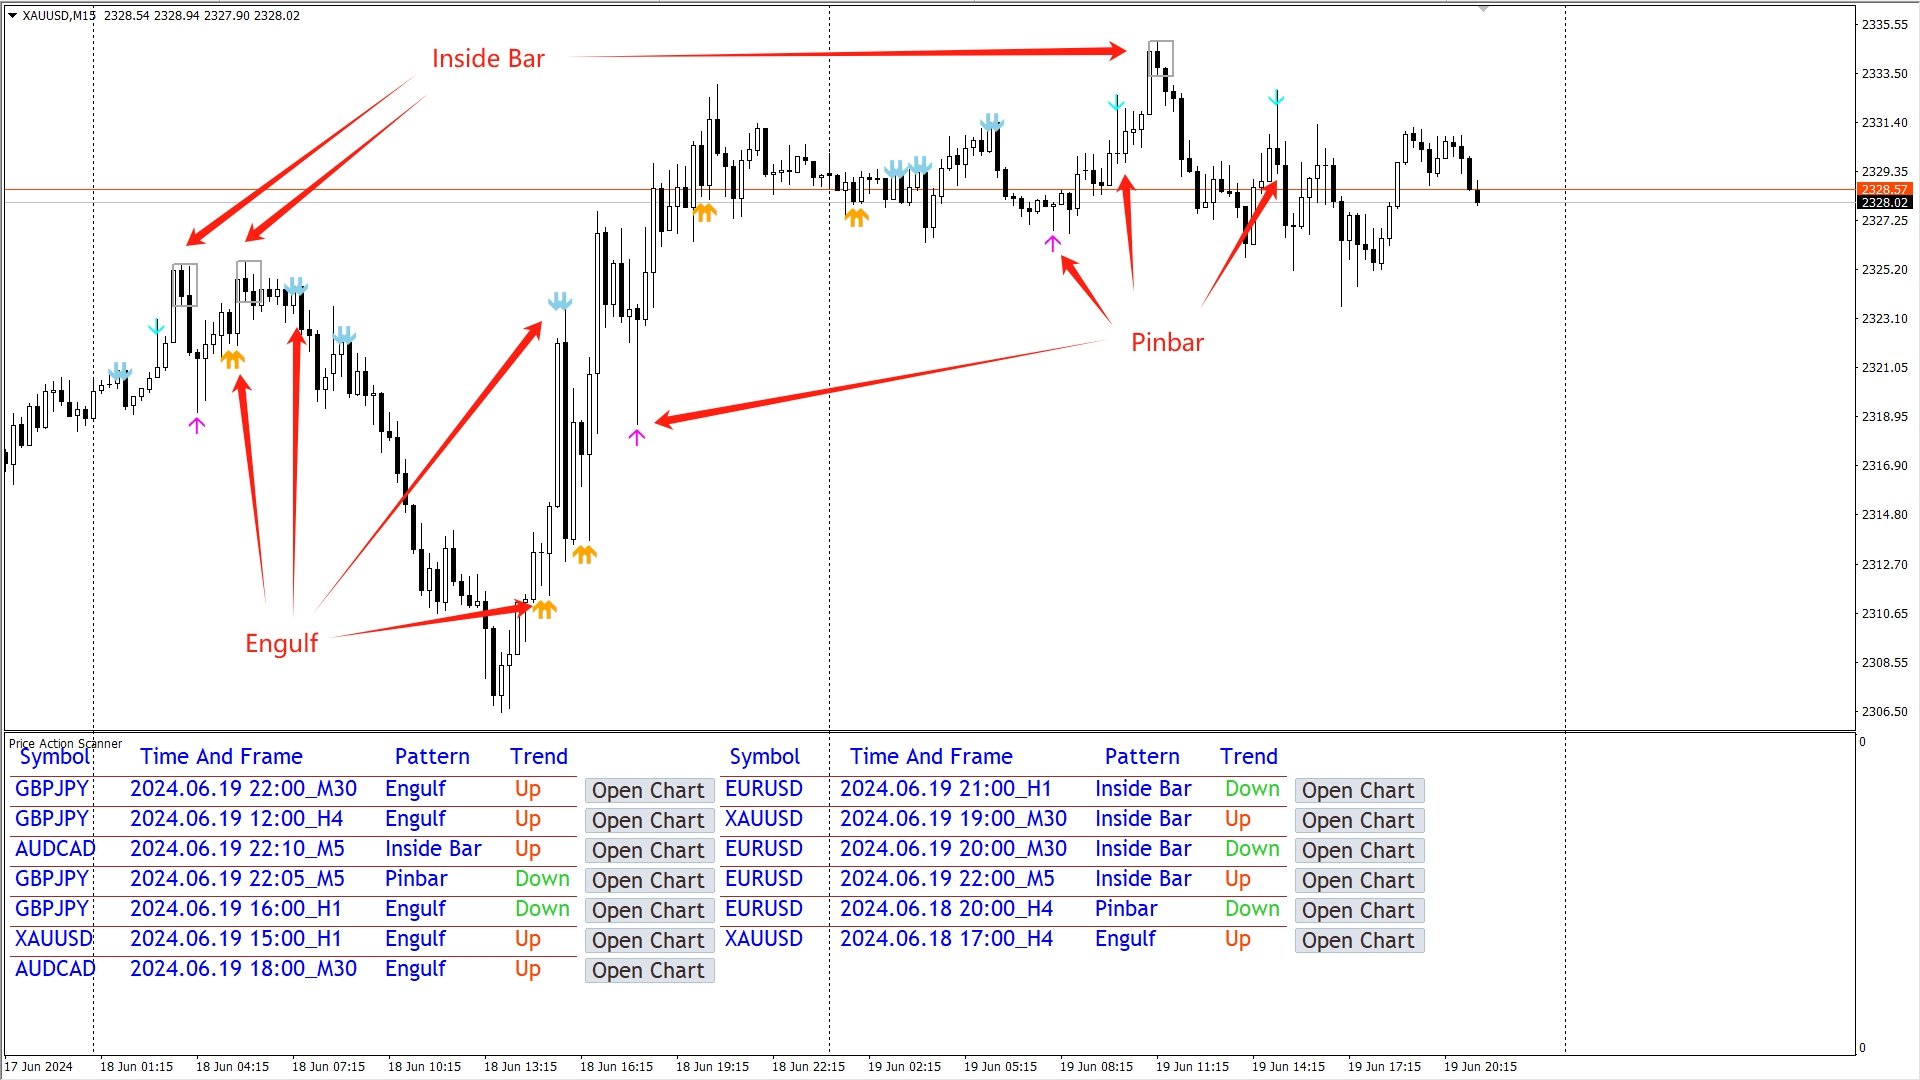
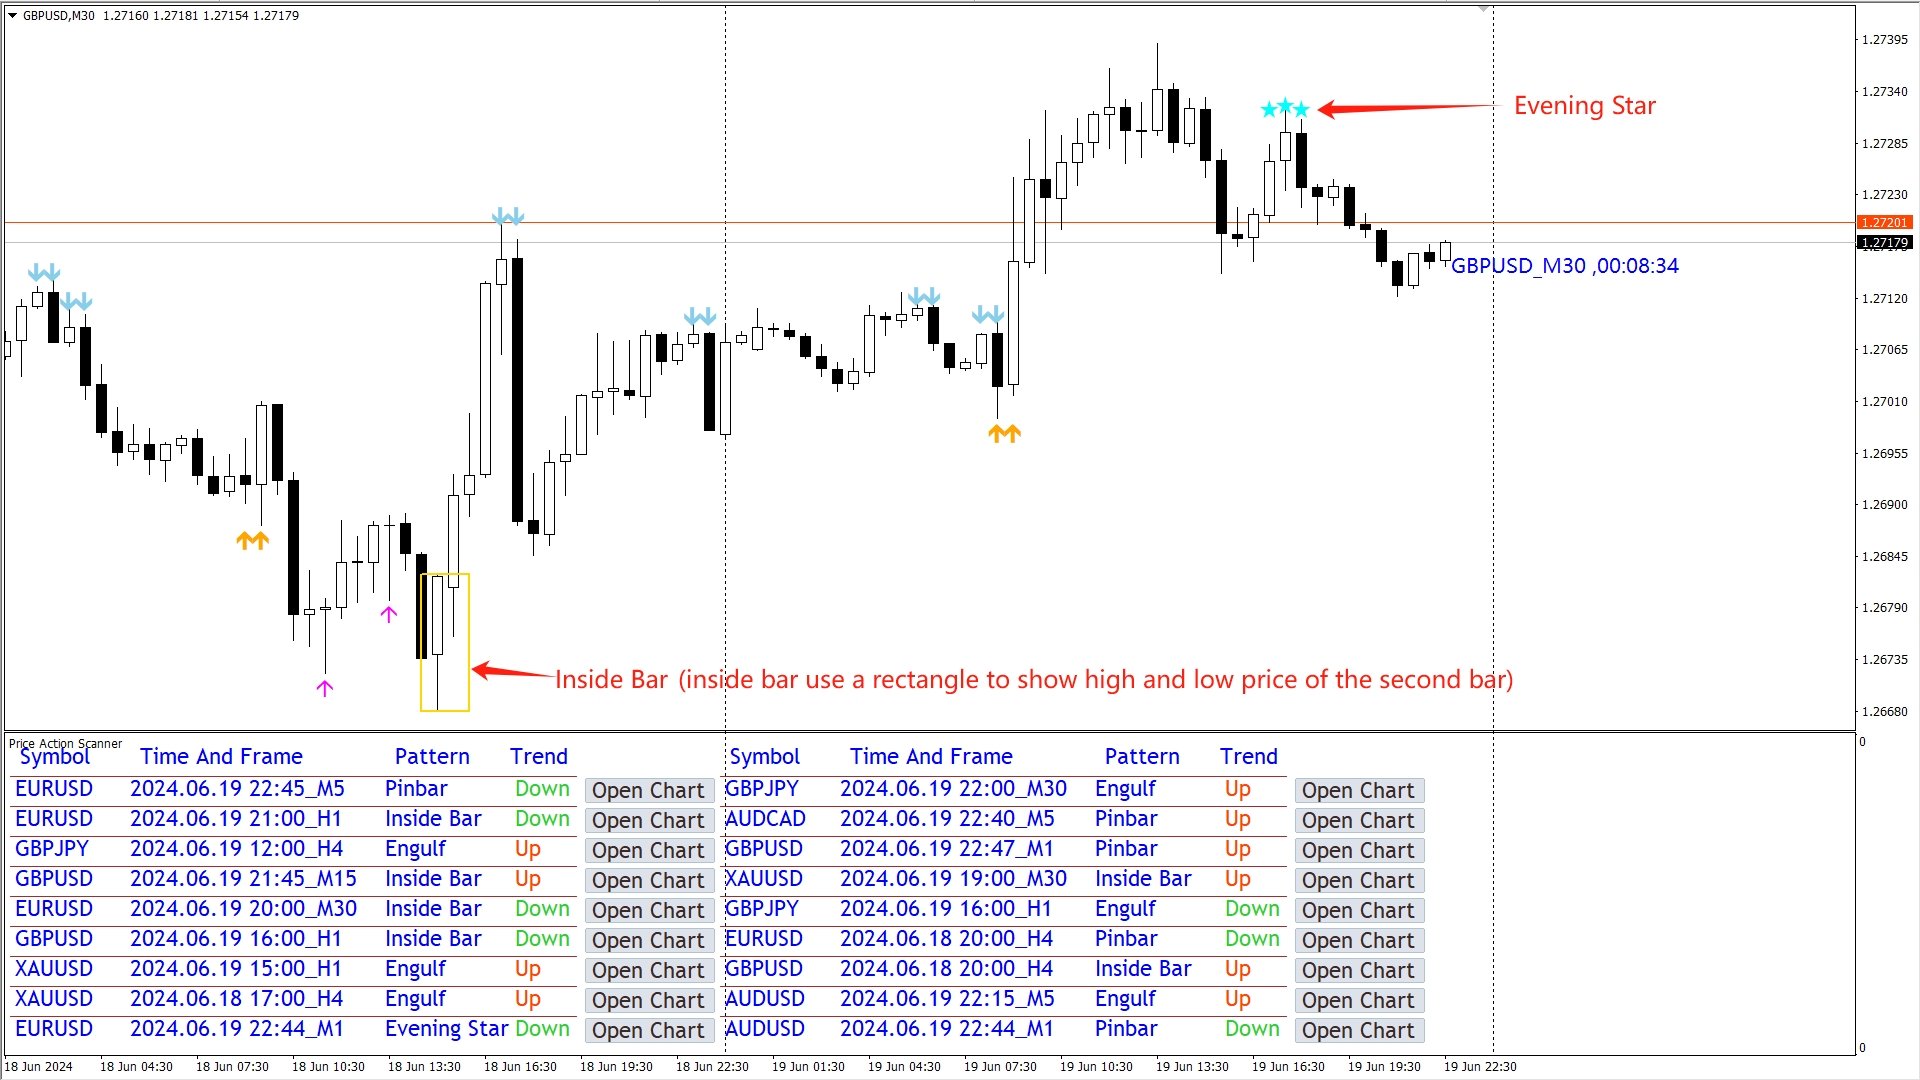
指标可以设定检测多种常见信号种类 , 有 Pinbar , 吞没形态 , 孕线形态 , 启明星 , 黄昏之星 , Fakey , 在单独的副图里面显示出对应的信息 , 并提示出信号的方向 . 你可以点击对应的 Open Chart 按钮 , 显示出这个品种的 chart , 便于更好的观察 . 你也可以设置每种信号的颜色 , 显示的大小 .
信号已经对趋势进行了额外的过滤 , 在上升趋势的末端不提示做多的信号 , 在下降趋势的末端不提示做空的信号 . 在使用时 , 最好是配合着关键位 , 来提高做单的准确率 .
参数设置 :
Separator : 分隔符 , 用来分隔 品种名称 和 timeframe , 只能填入1个字符 , 默认使用逗号
Symbols (less than or equal to 6) : 最多可填入6个品种 , 使用分隔符来分隔每个品种
Timeframes : 填入要检测的时间周期 , 1代表M1,5代表M5,15代表M15,30代表M30,60代表H1,240代表H4,1440代表D1
Send App message : 选择 true , 指标会将信号信息发送到你的手机端MT4软件里 , 需要在PC端的 "工具-选项-通知" 里面勾选 "启用推送通知" , 并填入手机端的 MQID .
由于计算的不同时间周期 , 不同品种的数量有多有少 , 所以指标加载时可能会出现卡顿的情况 , 请耐心等待 . 另外 , 为了更快加载速度 , 图表上只显示最近600根K线的信号 .
此外 , 如果你有更好的建议 , 或者使用中遇到的问题 , 欢迎与我讨论 .