• 概述
  • 评论
  • 评论

Fvg Indicator for MT5

IMPORTANT: The indicator will remain at the price of $34.90 until the release of the update scheduled for July 16, 2024. The New Price will be $49.90 (taxes excluded)

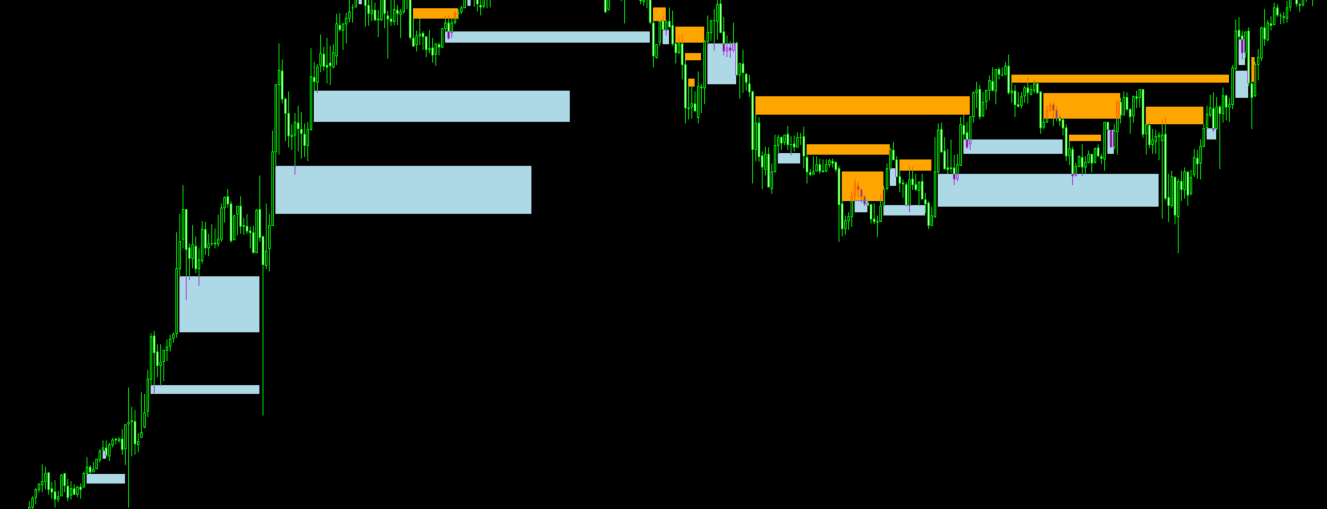
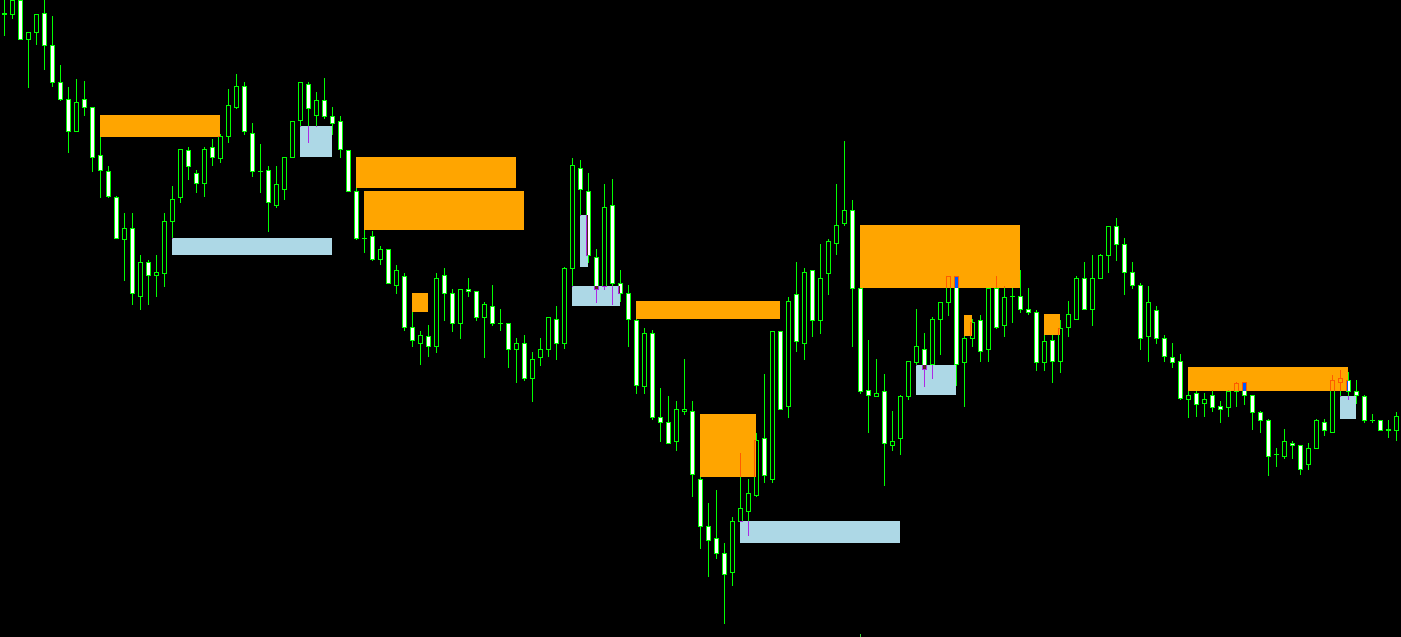
FVG indicator. If you are an SMC trader this indicator will be very useful to you, it automatically identifies the FVGs on the graph distinguishing them into 2 types: bearish FVGs and bullish FVGs (see the photos to understand better). This indicator works on any Timeframe and on any market you want to use it. If you are interested in this indicator and would like to implement it in an EA, do not hesitate to contact me.

For graphic customization you can decide the minimum and maximum length of the FVGs from the input tab


推荐产品
Double HMA MTF for MT5
Pavel Zamoshnikov
3.67 (3)
This is an advanced multi-timeframe version of the popular Hull Moving Average (HMA) Features Two lines of the Hull indicator of different timeframes on the same chart. The HMA line of the higher timeframe defines the trend, and the HMA line of the current timeframe defines the short-term price movements. A graphical panel with HMA indicator data from all timeframes at the same time . If the HMA switched its direction on any timeframe, the panel displays a question or exclamation mark with a tex
Owl Smart Levels MT5
Sergey Ermolov
4.31 (39)
MT4版本  |   FAQ Owl Smart Levels Indicator 是一個完整的交易系統,包含 Bill Williams 的高級分形、構建正確的市場波浪結構的 Valable ZigZag 以及標記準確入場水平的斐波那契水平等流行的市場分析工具 進入市場和地方獲利。 策略的详细说明 指示灯使用说明 顾问-贸易猫头鹰助手助理 私人用户聊天 ->购买后写信给我,我会将您添加到私人聊天中,您可以在那里下载所有奖金 力量在於簡單! Owl Smart Levels 交易系統非常易於使用,因此適合專業人士和剛開始研究市場並為自己選擇交易策略的人。 策略和指標中沒有隱藏的秘密公式和計算方法,所有策略指標都是公開的。 Owl Smart Levels 允許您快速查看進入交易的信號,突出顯示下訂單的水平並向您發送有關已出現信號的通知。 優點很明顯: 清楚地顯示主要和更高時間框架的趨勢方向。 指示儀器信號的出現。 標記開單、止損設置和固定利潤的水平。 沒有多餘的,只有必要的結構! ZigZag 表示全球趨勢的方向,因此也表示貿易方向。 市場反轉點的短線清楚地表明在什麼水平上構建斐波
KT Renko Patterns MT5
KEENBASE SOFTWARE SOLUTIONS
KT Renko Patterns scans the Renko chart brick by brick to find some famous chart patterns that are frequently used by traders across the various financial markets. Compared to the time-based charts, patterns based trading is easier and more evident on Renko charts due to their uncluttered appearance. KT Renko Patterns features multiple Renko patterns, and many of these patterns are extensively explained in the book titled Profitable Trading with Renko Charts by Prashant Shah. A 100% automate
PZ Support Resistance MT5
PZ TRADING SLU
4.17 (6)
厌倦了绘制支撑线和阻力线? 支撑阻力 是一个多时间指标,可以自动检测并绘制图表中的支撑线和阻力线,并具有非常有趣的变化:随着时间的推移测试价格水平及其重要性的提高,线变得越来越粗。 [ 安装指南 | 更新指南 | 故障排除 | 常见问题 | 所有产品 ] 一夜之间增强您的技术分析 无需浏览图表即可检测重要的价格水平 一目了然地识别所有价格水平的相对优势 每次交易最多可节省半小时的绘图线 指标显示所有价格水平的期限 指示器不重涂 过去和现在的价格水平因接近程度而崩溃,并根据当前的市场行为进行了调整。在动作发生的地方绘制了线条,而不一定在峰值处绘制了线条。 价格水平随着时间的推移而被拒绝,变得越来越暗 定期清除不重要的价格水平以避免噪音 可自定义的时间范围选择和崩溃因子 它实现了电子邮件/声音/推送警报的突破 输入参数 指标设置:指标将从当前时间段读取价格,但您可以选择另一个。例如,您可以在H4图表中显示D1支撑线和阻力线。您还可以使用 价格水平密度 参数选择在图表上显示多少价格水平。 颜色设置:根据重要性输入所需的支撑线和阻力线颜色。 标签设置:(可选)可以在指示器
PZ Mean Reversion MT5
PZ TRADING SLU
3 (2)
采用专业和量化方法进行均值回归交易的独特指标。它利用了价格以可预测和可衡量的方式转移并返回均值这一事实,这允许明确的进入和退出规则大大优于非量化交易策略。 [ Installation Guide | Update Guide | Troubleshooting | FAQ | All Products ] 清晰的交易信号 非常容易交易 可定制的颜色和尺寸 实现性能统计 优于大多数交易策略 显示合适的止损和止盈水平 它实现了电子邮件/声音/视觉警报 这个怎么运作 该指标从更高的时间范围测量完全可定制的移动平均线的标准偏差,并使用趋势跟踪方法精确地找到交易。交易是通过深入当前图表的价格行为发现的,并在价格返回到平均价格区间时关闭,根据您选择的更高时间范围计算。由于其编码方式,该指标将远离高波动性和强劲趋势市场,并且仅在可预测的情况下进行交易,在可接受的波动性与方向性比率范围内,回归均值是可行的。 指标剖析 绿线是更高时间范围内的移动平均线(也就是平均值) 虚线区域是移动平均线周围的典型价格区间 蓝线是看涨交易的突破价格 红线是看跌交易的突破价格 交易是针对均值进行的,并在
PZ Penta O MT5
PZ TRADING SLU
The Penta-O is a 6-point retracement harmonacci pattern which usually precedes big market movements. Penta-O patterns can expand and repaint quite a bit. To make things easier this indicator implements a twist: it waits for a donchian breakout in the right direction before signaling the trade. The end result is an otherwise repainting indicator with a very reliable trading signal. The donchian breakout period is entered as an input. [ Installation Guide | Update Guide | Troubleshooting | FAQ | A
Noize Absorption Index
Ekaterina Saltykova
Noize Absorption Index - is the manual trading system that measures the difference of pressure between bears forces and bulls forces. Green line - is a noize free index that showing curent situation. Zero value of index shows totally choppy/flat market.Values above zero level shows how powerfull bullish wave is and values below zero measures bearish forces.Up arrow appears on bearish market when it's ready to reverse, dn arrow appears on weak bullish market, as a result of reverse expectation.
An indicator of pattern #31 ("Long Island") from Encyclopedia of Chart Patterns by Thomas N. Bulkowski. The second gap is in the opposite direction. Parameters: Alerts - show alert when an arrow appears   Push - send a push notification when an arrow appears (requires configuration in the terminal) GapSize - minimum gap size in points ArrowType - a symbol from 1 to 17 ArrowVShift - vertical shift of arrows in points   ShowLevels - show levels ColUp - color of an upward line ColDn - color of a
这是一个 MTF 指标,它基于 带有价格标签的 Advanced ZigZag Dynamic 和/或 Extended Fractals 指标极值(可以禁用)。可以为 MTF 模式选择更多更高的 TF。默认情况下,级别是基于 ZigZag 指标点生成的。分形指标点也可以与 ZigZag 一起使用或代替它。为了简化使用并节省 CPU 时间,每根柱线在开盘时执行一次计算。 参数: ForcedTF - 水平计算的图表时间范围(可能等于或超过当前时间) MinPipsLevelWidth   - 以点为单位的最小关卡宽度(用于非常紧凑的关卡) Use ZigZag Extremums points - 启用/禁用使用 ZigZag 峰值计算支撑/阻力水平 Fixed pips range - 计算 ZigZag 指标的最小值和最大值之间的距离 UseDynamicRange   - 启用/禁用 ZigZag 指标最小值和最大值之间距离的动态计算 Dynamic volatility period - 用于计算 ZigZag 指标最小值和最大值之间的动态距离的波动期 Dynamic vola
该指标将向您显示您已经为图表上的每个订单设置的 TP 和 SL 值(以该货币表示)(接近交易/订单行),这将帮助您估算每个订单的利润和损失。它还会向您显示 PIP 值。显示的格式是“我们的损益/PIP 值的货币值”。 TP 值将以绿色显示,SL 值将以红色显示。 如有任何问题或了解更多信息,请随时通过 fxlife.asia@hotmail.com 或 fxlife.asia@yahoo.com 与卖家联系 (而指标中即将加入的下一个功能是“自动或半自动TP和SL设置”,我们的客户将免费获得更新版本。谢谢...^_^) (或者如果您认为在指示中应该增加一些功能,请随时告诉我们) ========================================================
- This is the exact conversion from TradingView: "Support/Resistance" By "BarsStallone". - This indicator lets you read the buffers for R/S values. - This is a non-repaint and light processing load indicator. - This is not a multi time frame indicator If you want the multi time frame version you should create a personal order and I deliver two files that you need them both to have the multi time frame indicator running on your system. - The MT4 version of the indicator is not light load from pr
PipFinite Exit EDGE MT5
Karlo Wilson Vendiola
4.89 (37)
Did You Have A Profitable Trade But Suddenly Reversed? In a solid strategy, exiting a trade is equally important as entering. Exit EDGE helps maximize your current trade profit and avoid turning winning trades to losers. Never Miss An Exit Signal Again Monitor all pairs and timeframes in just 1 chart www.mql5.com/en/blogs/post/726558 How To Trade You can close your open trades as soon as you receive a signal Close your Buy orders if you receive an Exit Buy Signal. Close your Sell orde
This indicator obeys the popular maxim that: "THE TREND IS YOUR FRIEND" It paints a Blue line for BUY and also paints a RED line for SELL. (you can change the colors). It gives alarms and alerts of all kinds. IT DOES NOT REPAINT COLOR and can be used for all currency pairs and timeframes. Yes, as easy and simple as that. Even a newbie can use it to make great and reliable trades. https://www.mql5.com/en/market/product/115553
KT Pin Bar MT5
KEENBASE SOFTWARE SOLUTIONS
KT Pin Bar identifies the pin bar formation which is a type of price action pattern which depicts a sign of reversal or rejection of the trend. When combined with support and resistance, BRN and other significant levels, Pin Bar pattern proved to be a very strong sign of reversal. Basically, a pin bar is characterized by a small body relative to the bar length which is closed either in upper or lower 50% part of its length. They have very large wicks and small candle body. A pin bar candlest
ATrend
Zaha Feiz
4 (1)
ATREND: 工作原理及使用方法 工作原理 “ATREND”指标针对MT5平台设计,旨在通过结合多种技术分析方法为交易者提供强有力的买卖信号。该指标主要利用平均真实波幅(ATR)来测量波动性,并结合趋势检测算法来识别潜在的市场动向。 购买后请留言,您将获得特别的赠品。 剩余8份,售价39美元。 主要特点: - 动态趋势检测:该指标评估市场趋势并相应调整信号,帮助交易者与当前市场条件对齐策略。 - 波动性测量:通过使用ATR,该指标衡量市场波动性,这对于确定最佳止损(SL)和止盈(TP)水平至关重要。 - 信号可视化:该指标在图表上直观地表示买卖信号,增强交易者的决策能力。 操作步骤 输入和设置: - 时间框架:此输入允许您设置指标计算的主要时间框架,默认值为15分钟。 - 时间框架2:此输入可用于定义额外分析的辅助时间框架,默认值为1分钟。 - 移动:此参数允许您将指标的计算向回移动,默认值为0。 - SLATR:此输入定义用于根据ATR计算止损水平的乘数,默认值为2.56。 - TPATR:此输入定义用于根据ATR计算止盈水平的乘数,默认值也为2.56。 - Alerts
首先,值得强调的是,这个交易工具是非重绘、非重画和非滞后的指标,非常适合专业交易。 在线课程,用户手册和演示。 智能价格行动概念指标是一个非常强大的工具,既适用于新手,也适用于经验丰富的交易者。它将超过20个有用的指标合并到一个指标中,结合了高级交易思想,如内圈交易员分析和智能资金概念交易策略。该指标侧重于智能资金概念,提供有关大型机构交易方式的见解,帮助预测它们的动向。 它在流动性分析方面尤其擅长,有助于理解机构的交易方式。它擅长预测市场趋势,并仔细分析价格波动。通过将您的交易与机构策略对齐,您可以更准确地预测市场走向。该指标多才多艺,擅长分析市场结构,识别重要的订单区块,并识别各种模式。 它擅长识别BOS和CHoCH等模式,理解动量的转变,并突出显示供需强劲的关键区域。它还擅长发现强大的不平衡,并分析价格创造更高高点或更低低点的模式。如果您使用斐波那契回撤工具,该指标可以满足您的需求。它还可以识别相等的高点和低点,分析不同的时间框架,并通过仪表板显示数据。 对于使用更高级策略的交易者,该指标提供了工具,如公平价值差指标和优惠和折扣区域的识别。它特别关注高时间框架订单
Atomic Analyst MT5
Issam Kassas
4.79 (19)
首先值得强调的是,该交易指标是非重绘、非延迟的指标,这使其成为手动和机器人交易的理想选择。 用户手册:设置、输入和策略。 Atomic Analyst是一种PA价格行动指标,利用价格的力量和动量来寻找市场上更好的机会。配备了高级过滤器,可帮助去除噪音和假信号,并提高交易潜力。使用多层复杂的指标,Atomic Analyst扫描图表,并将复杂的数学计算转化为任何初学者都能理解并用来做出一致交易决策的简单信号和颜色。 “Atomic Analyst”是专为新手和经验丰富的交易者量身定制的综合交易解决方案。它将高级指标和一流功能融合为一体的交易策略,使其成为所有类型交易者的多功能选择。 日内交易和剥头皮策略:专为快速准确的日内交易和短期交易而设计。 日内和摆动交易策略:可用作追求价格大幅波动的日内和摆动交易者的可靠工具。 多货币和市场:凭借其可靠的精度,在不同的工具和市场上运作。 多个时间框架:可在多个时间框架上使用,性能良好。 稳定性:所有指标均不重绘、不重绘和不滞后,确保可靠的信号。 信号清晰度:提供箭头信号,用于清晰的入场和出场点。 实时警报:通过交易入场、SL和TP警报通知交
Renko Gold
Ignacio Agustin Mene Franco
Renko Gold! clearly indicates the floors and ceilings where it goes from 4 lines, the line below that marks the floor in green confirming with the thinnest line clarifies the purchase entry, the same is for sale, the top line marks the ceiling and the thinnest red line marks the sale, This indicator works for all temporalities! For Forex and Synthetic Indices markets! It also works for crypto markets! Good profit! World Investor.
To download MT4 version please click here . - This is the exact conversion from TradingView: "Trend Direction Force Index - TDFI [wm]" By "causecelebre". - This indicator uses multiple levels of averaging to detect trend strength. - You can optimize filter low and filter high levels to achieve best results. - You have access to buffers to use in EAs. - This is a light-load processing and non-repaint indicator. - You can message in private chat for further changes you need.
The new update makes this indicator a complete tool for studying, analyzing and operating probabilistic patterns. It includes: On-chart Multi-asset percentage monitor. Configurable martingales. Twenty-one pre-configured patterns, including Mhi patterns and C3. An advanced pattern editor to store up to 5 custom patterns. Backtest mode to test results with loss reports. Trend filter. Hit operational filter. Martingale Cycles option. Various types of strategies and alerts. Confluence between patter
Volume by Price MT5
Brian Collard
3.6 (5)
The Volumebyprice.com Indicator for MetaTrader 5 features Volume Profile and Market Profile TPO (Time Price Opportunity). Volume and TPO histogram bar and line charts. Volume Footprint charts. TPO letter and block marker collapsed and split structure charts. Static, dynamic and flexible range segmentation and compositing methods with relative and absolute visualizations. Session hours filtering and segment concatenation with Market Watch and custom user specifications. Graphical layering, posit
No Demand No Supply MT5
Trade The Volume Waves Single Member P.C.
No Demand No Supply   This indicator identifies   No Demand –No Supply candles to your chart and plots volume bars colored according to the signal. It can be applied to all timeframes or to a specific one only. It can also be used as regular volume indicator  with exceptional future of WEIGHTED VOLUME. Furthermore is has an alert notification, sound and email when a signals occurs. The indicator does not repaint but the alert will come on two candles back due to the definition of No Demand No Su
支撑和阻力指标是改编自标准的比尔威廉姆斯的分形指标。 该指标可工作于任何时间帧。它在图表上显示支撑和阻力位,并允许设置止损和止盈级别 (您可以通过鼠标覆盖级别来检查其精确值)。 蓝色点划线是支撑位。 红色点划线是阻力位。 如果您愿意, 您可以改变这些线的样式和颜色。 如果价格接近支撑位,卖方的活跃度降低,买方的活跃度增加。如果价格接近阻力位,买方的活跃度降低,卖方的活跃度增加。 注, 当价格突破支撑位, 它变为阻力位; 同样当价格突破阻力位, 它变为支撑位。
Cumulative Delta NG
Anton Polkovnikov
Cumulative delta indicator As most traders believe, the price moves under the pressure of market buying or selling. When someone redeems an offer standing in the cup, the deal is a "buy". If someone pours into the bid standing in the cup - the deal goes with the direction of "sale". The delta is the difference between purchases and sales. A cumulative delta - the difference between the cumulative sum of purchases and sales for a certain period of time. It allows you to see who is currently contr
How to use Pair Trading Station Pair Trading Station is recommended for H1 time frame and you can use it for any currency pairs. To generate buy and sell signal, follow few steps below to apply Pair Trading Station to your MetaTrader terminal. When you load Pair Trading Station on your chart, Pair Trading station will assess available historical data in your MetaTrader platforms for each currency pair. On your chart, the amount of historical data available will be displayed for each currency pai
SolarTrade Suite 金融指标:木星市场指标 - 您在金融市场世界中的可靠指南! 这是一个趋势指标,使用特殊的创新和高级算法来计算其值,并且具有令人赏心悦目的设计。 很容易理解此指标的读数:蓝色 - 买入,红色 - 卖出。 在说明底部查看我们来自 SolarTrade Suite 系列的其他产品。 您想自信地驾驭投资和金融市场的世界吗? SolarTrade Suite 金融指标:木星市场指标是一款创新软件,旨在帮助您做出明智的投资决策并增加您的利润。 SolarTrade Suite 金融指标:木星市场指标的优势: - 准确预测:我们的指标使用先进的算法和分析方法来准确预测市场走势。 接收有关买卖资产最佳时机的信号。 - 用户友好界面:直观的界面将使您能够轻松掌握该程序并在安装后立即开始享受其好处。 您可以从设置中更改点的大小和颜色、灵敏度和速度,所有其他设置都是自动完成的。 - 专家支持:我们的专业团队随时准备为您解答任何问题并提供有关使用该程序的建议。 为什么选择 SolarTrade Suite 财务指标:木星市场指标? -
该指标找到AB = CD回撤形态。 AB = CD回调模式是一种4点价格结构,其中初始价格区间被部分回调,然后与回调完成后等距移动,这是所有谐波模式的基本基础。 [ 安装指南 | 更新指南 | 故障排除 | 常见问题 | 所有产品 ] 可定制的图案尺寸 可定制的AC和BD比率 可定制的突破时间 可定制的线条,颜色和大小 它根据CD纤维水平显示SL和TP水平 视觉/声音/推送/邮件警报,用于模式和突破 AB = CD Retracements可以扩展和重新绘制很多内容。为了使事情变得更容易,该指标实施了一个转折:它在向交易发出信号之前等待正确方向的Donchian突破。最终结果是带有非常可靠的交易信号的重新粉刷指示器。输入donchian突破时段作为输入。 看涨回撤是蓝色的 空头回撤是红色的 请注意,价格模式(例如AB = CD)可以扩展,指标必须重新绘制以跟随该模式的扩展。如果图案重涂超出了参数中输入的AC / BD / AB = CD比率,则该图案将消失,因为它将不再有效。要交易这些模式,请求助于donchian突破信号。 输入参数 幅度:AB = C
首先值得强调的是,这个交易系统是一个不重绘、不重画和不滞后的指标,这使它非常适合专业交易。 在线课程,用户手册和演示。 “智能支撑和阻力交易系统”是专为新手和经验丰富的交易者量身定制的先进指标。它赋予交易者在外汇市场上精确和自信的能力。这个综合系统结合了7+种策略、10个指标和各种交易方法,包括日内交易策略、波段交易策略、支撑和阻力策略、蜡烛图模式策略、VWAP策略、多时间段趋势策略等。它提供箭头信号、入场和出场点、交易警报、更高时间框架的趋势分析、实时交易监控以及见解深刻的趋势和成交量蜡烛染色。通过自动支撑和阻力检测,这是一个多面手的指标,帮助交易者在不同的市场条件下做出明智的决策。 “智能支撑和阻力交易系统”是一个强大的技术分析方法,融合了一套高端和强大的指标和工具。在其核心,这个系统识别关键的支撑和阻力水平,这些水平作为潜在市场反转或延续的关键区域。该系统无缝集成了多时间框架趋势面板,增强了交易者在不同时间框架下评估当前趋势方向的能力。此外,蜡烛图模式检测器扫描价格图表以获取重要的蜡烛图模式,为潜在的市场走势提供宝贵的见解。此外,VWAP(成交量加权平均价格)的加入
For a trader, trend is our friend. This is a trend indicator for MT5, can be used on any symbol. just load it to the terminal and you will see the current trend. green color means bullish trend and red means bearlish trend. you can also change the color by yourself when the indicator is loaded to the MT5 terminal the symbol and period is get from the terminal automaticly. How to use: I use this trend indicator on 2 terminals with different period  for the same symbol at same time. for example M5
该产品的买家也购买
Atbot
Zaha Feiz
4.96 (28)
AtBot: 它是如何工作的以及如何使用它 ### 它是如何工作的 “AtBot”指标用于MT5平台,通过结合技术分析工具生成买入和卖出信号。它集成了简单移动平均线(SMA)、指数移动平均线(EMA)和平均真实波幅(ATR)指标,以识别交易机会。此外,它还可以利用Heikin Ashi蜡烛来增强信号的准确性。 购买后留下评论,您将获得特别的奖励礼物。 ### 主要特点: - 不重绘: 信号在绘制后不会改变。 - 不变动: 信号保持一致,不会被更改。 - 无延迟: 提供及时的信号,没有延迟。 - 多种时间框架: 可在任何时间框架上使用,以适应您的交易策略。 ### 操作步骤: #### 输入和设置: - firstkey (TrendValue): 调整趋势检测的灵敏度。 - Secondkey (SignalValue): 定义买入/卖出信号生成的灵敏度。 - masterkey (ExitValue): 控制信号的退出策略。 - h: 切换是否根据Heikin Ashi蜡烛生成信号(真/假)。 - notifications: 启用或禁用信号提醒。 #### ATR计算: ATR测
首先,值得强调的是,这个交易系统是一个非重绘、非重画和非滞后的指标,这使得它非常适合手动和机器人交易。 在线课程,手册和下载预设。 “智能趋势交易系统 MT5”是专为新手和经验丰富的交易者量身定制的综合交易解决方案。它结合了超过 10 个优质指标,具有 7 多个强大的交易策略,使其成为适用于各种市场条件的多功能选择。 趋势跟随策略:提供精确的入场和止损管理,以有效地跟随趋势。 反转策略:识别潜在的趋势反转,使交易者能够利用区域市场的机会。 剃头策略:专为快速准确的日内交易和短期交易而设计。 稳定性:所有指标都不会重绘、不会重画和不会滞后,确保可靠的信号。 定制:支持自定义策略,以满足个人交易偏好。超过 7 种策略和组合可帮助您找到最佳策略。 信号清晰度:提供箭头信号,以指示清晰的入场和退出点。 实时警报:通过交易进出警报使交易者保持了解。 深入分析:提供更高时间框架的趋势分析和实时交易监控。 自适应颜色编码:利用蜡烛颜色编码来显示成交量、趋势和反转蜡烛信号。通过蜡烛颜色分析市场方向。 “智能趋势交易系统 MT5”赋予交易者必要的工具,以便在各种市场条件下做出明智和战略性的交易决策。无论
Gold Stuff mt5
Vasiliy Strukov
4.9 (185)
Gold Stuff mt5 是专为黄金设计的趋势指标,也可用于任何金融工具。 该指标不会重绘,也不会滞后。 推荐时间框架 H1。 购买后立即联系我以获得设置和个人奖励!   你可以在我的个人资料中找到它。   重要! 购买后立即与我联系,以获得说明和奖金!   您可以免费收到我们的强力支持和趋势扫描指标的副本,请私信。大部头书!   设置 绘制箭头 - 打开关闭。 在图表上绘制箭头。 警报 - 打开关闭声音警报。 电子邮件通知 - 打开关闭。 电子邮件通知。 Puch-notification - 打开关闭。 推送通知。 接下来,调整色域。 Gold Stuff mt5 是专为黄金设计的趋势指标,也可用于任何金融工具。 该指标不会重绘,也不会滞后。 推荐时间框架 H1。 购买后立即联系我以获得设置和个人奖励!   设置 绘制箭头 - 打开关闭。 在图表上绘制箭头。 警报 - 打开关闭声音警报。 电子邮件通知 - 打开关闭。 电子邮件通知。 Puch-notification - 打开关闭。 推送通知。 接下来,调整色域。
TPSpro RFI Levels MT5
Roman Podpora
4.67 (9)
Reversal First Impulse levels (RFI)      INSTRUCTIONS        RUS       -       ENG              R ecommended to use with an indicator   -   TPSpro  TREND PRO -  Version MT4                 A key element in trading is zones or levels from which decisions to buy or sell a trading instrument are made. Despite attempts by major players to conceal their presence in the market, they inevitably leave traces. Our task was to learn how to identify these traces and interpret them correctly. Main functi
Entry Points Pro for MT5
Yury Orlov
4.56 (163)
这款指标用于 MT5,可提供准确的入场交易信号,且无重绘。 它可应用在任何金融资产:外汇、加密货币、贵金属、股票、指数。 它将提供极其精准的评估,并告诉您何时开仓和平仓的最佳时机。 观看 视频 (6:22),其中包含一个仅处理单一信号的示例,该信号即可值回指标购价! 大多数交易者在 Entry Points Pro 指标的帮助下,在第一个交易周内即改善了他们的交易结果。 订阅我们的 Telegram 群 ! Entry Points Pro 指标的益处。 入场信号无重绘 如果信号出现,并得到确认,则它不会再消失;不像是重绘指标,它会导致重大的财产损失,因为它们可以在显示信号后再将其删除。 无差错开仓 指标算法可令您找到入场交易(买入或卖出资产)的理想时机,从而提高每位交易者的成功率。 Entry Points Pro 可操作任何资产 它允许您在 MT5 平台上交易任何经纪商的加密货币、股票、贵金属、指数、大宗商品和货币。 提供任何方向的信号 Entry Points Pro 指标提供针对任意价格走势的入场交易信号 - 上涨、下跌或横盘(横向)。
Quantum Trend Sniper
Bogdan Ion Puscasu
4.92 (48)
介绍   量子趋势狙击指标 ,突破性的 MQL5 指标,正在改变您识别和交易趋势反转的方式!由拥有超过13年交易经验的资深交易员团队开发,     量子趋势狙击指标   旨在通过其创新的方式以极高的准确度识别趋势反转,将您的交易之旅推向新的高度。 ***购买量子趋势狙击指标,即可免费获得量子突破指标!*** 当量子突破指标识别出趋势反转时,它会向您发出警报和信号箭头,并建议您三个止盈水平。 它既适合新手交易者,也适合专业交易者。 量子 EA 通道:       点击这里 MT4版本:       点击这里 建议: 时间范围: 所有时间范围。为了获得最佳结果,我们建议在 M15、M30 和 H1 时间范围内使用它。 货币对:欧元兑美元、英镑兑美元、澳元兑美元、欧元兑英镑、, EURAUD,  XAUUSD 账户类型:ECN、Raw 或 Razor,点差极低 经纪时间:任意 经纪商:IC Markets、Pepperstone with Raw 和 Razor 的点差最低 建议止损:50 点 建议止盈水平:20 点、50 点和
Trend Screener Pro MT5
STE S.S.COMPANY
4.88 (67)
使用趋势筛选指标释放趋势交易的力量:由模糊逻辑和多货币系统提供支持的终极趋势交易解决方案! 使用趋势筛选器(由模糊逻辑提供支持的革命性趋势指标)提升您的趋势交易。 它是一个强大的趋势跟踪指标,结合了超过 13 种高级工具和功能以及 3 种交易策略,使其成为使您的 Metatrader 成为趋势分析器的多功能选择。 限时优惠:趋势筛选指标终身仅需 50 美元。 ( 原价 125$ ) (优惠延长) 体验趋势筛选器 100% 无需重新绘制的准确性,确保您的交易决策不受过去价格变化的影响。 释放多时间框架和多货币功能的多功能性,使您能够以无与伦比的信心在外汇、商品、加密货币和指数领域进行交易。 利用 Trend Screener 的综合策略套件增强您的交易: - 趋势跟踪策略和趋势延续策略 :趋势筛选器的趋势跟踪策略提供清晰的趋势延续信号,让您有效捕捉趋势走势并管理风险。 - 反转策略和早期入场点策略 :趋势筛选器的反转策略可检测市场方向的潜在变化,使您能够预测趋势反转并利用疲弱的市场趋势。通过早期入场点,您可以在潜在的趋势变化之前定位自己 获取可观的利润。 - 倒卖策略: 趋势筛选器的倒卖
FX Power MT5 NG
Daniel Stein
5 (6)
通过 mql5 和 Telegram 上 的晨间简报获取每日市场更新,包括详细信息和屏幕截图 ! FX Power MT5 NG 是我们长期以来非常受欢迎的货币强度计算器 FX Power 的下一代产品。 这款下一代强度计算器能提供什么?您所喜爱的原版 FX Power 的所有功能 附加功能 黄金/XAU 强度分析 更精确的计算结果 可单独配置的分析周期 可自定义计算限制,以获得更好的性能 为希望查看更多信息的用户提供特殊的多实例设置 无尽的图形设置,可在每个图表中设置您最喜欢的颜色 无数的通知选项,让您再也不会错过任何重要信息 采用 Windows 11 和 macOS 风格的全新圆角设计 神奇的移动指标面板 FX Power 主要功能 所有主要货币的完整强势历史 所有时间框架内的货币强弱历史 所有经纪商和图表的计算结果完全相同 100% 可靠的实时计算 -> 无重绘 可通过下拉列表选择分析时段 通过自定义模式单独配置分析时段 可在一个图表中使用多个实例 可移动 FX Power 显示屏(通过拖放) 适用于高分辨率 QHD、UHD 和 4K 显示器 自动终端配置 针对平板电脑
FX Volume MT5
Daniel Stein
4.94 (17)
通过 mql5 和 Telegram 上 的 " 晨间简报 "获取每日市场更新,包括详细信息和屏幕截图 ! 外汇交易量(FX Volume)是第一个也是唯一一个从经纪商角度真正洞察市场情绪的交易量指标。 直接在您的图表上看到这些信息是真正改变游戏规则和突破性的交易解决方案。 受益于独特的市场数据洞察,如 比率(Ratios )显示货币多头和空头头寸的比率(百分比 比率变化 显示所选时间段内的多头比率及其百分比变化 总交易量 显示货币的总交易量(多头和空头),以手为单位 多头 交易量显示货币所有多头头寸的交易量 空头 交易量显示所有货币空头头寸的交易量 净多头 显示净多头交易量,即所有多头头寸减去所有空头头寸(以手为单位)。 净多头百分比 显示货币净多头交易量的变化 请阅读我们的基本教程 -> "如何使用外汇交易量进行交易 " 获取更多信息,如常见问题、交易技巧和教程视频,请访问我们的 外汇交易量公共信息频道 请 安装并运行 SI Connect 以建立与我们数据中心的持续连接 背景信息 我们都知道,外汇是一个分散的市场。这就是为什么我们必须打破常规思维,开发一个独
IX Power MT5
Daniel Stein
4.17 (6)
IX Power 终于将 FX Power 的无与伦比的精确性带到了非外汇交易符号中。 它能准确判断您喜爱的指数、股票、商品、ETF 甚至加密货币的短期、中期和长期趋势强度。 您可以 分析 终端提供的 一切 。试试吧,体验一下您在交易时如何把握 时机 。 IX Power 主要功能 100% 精确的非重绘计算结果 - 适用于您终端中的所有交易符号 下拉式选择预配置以及可单独配置的强度分析周期 通过电子邮件、消息和手机通知的无数种通知选项 可访问的 EA 请求缓冲区 可自定义计算限制,以获得更好的性能 为希望查看更多信息的用户提供特殊的多实例设置 无尽的图形设置,让您在每个图表中都能找到最喜欢的颜色 采用 Windows 11 和 macOS 风格的圆角新面板设计 神奇的移动指标面板,可在子窗口和主图表之间无缝移动 适用于高分辨率 QHD、UHD 和 4K 显示器,并针对平板电脑和触摸屏进行了优化 IX Power 参数 最重要的参数不言自明,但我们很快会在另一篇文章中为您提供所有 IX Power 参数的完整说明。 使用别名 "参数可为技术交易符号
XQ Indicator MetaTrader 5
Marzena Maria Szmit
3.5 (2)
Step into the realm of Forex trading with confidence and precision using XQ, a cutting-edge Forex indicator designed to elevate your trading game to unprecedented heights. Whether you're a seasoned trader or just stepping into the world of currency exchange, XQ Forex Indicator empowers you with the insights and signals needed to make informed trading decisions. The signal conditions are a combination of three indicators, and XQ Forex Indicator only display  medium and long-term trends . The ind
Easy Buy Sell Signal Alert
Franck Martin
4.86 (7)
Easy By Sell is a market indicator for opening and closing positions. It becomes easy to track market entries with alerts. It indicates trend reversal points when a price reaches extreme values ​​and the most favorable time to enter the market. it is as effective as a Fibonacci to find a level but it uses different tools such as an algorithm based on ATR indicators and Stochastic Oscillator. You can modify these two parameters as you wish to adapt the settings to the desired period. My othe
该仪表盘显示所选符号的最新可用谐波形态,因此您可以节省时间并提高效率 /  MT4 版本 。 免费指标:  Basic Harmonic Pattern 指标列 Symbol:   显示所选符号 Trend:     看涨或看跌 Pattern:    形态类型(Gartley、蝴蝶、蝙蝠、螃蟹、鲨鱼、Cypher 或 ABCD) Entry:     入口价格 SL: 止损价 TP1: 第一止盈价 TP2: 第二次获利价格 TP3: 第三次获利价格 Current price:    当前价格 Age (in bars):   最后绘制的模式的年龄 主要输入 Symbols :   从 "28 种主要货币对 "或 "选定符号 "中选择。 Selected Symbols :   希望监控的符号,用逗号分隔("EURUSD,GBPUSD,XAUUSD")。如果您的经纪商为货币对设置了后缀或前缀,您必须在以下两个参数中添加(货币对前缀或货币对后缀)。 Max Iteration:   调整模式的最大迭代次数(如果该值越小,则模式越少,性能越快;如果该值越大,则模式越多,性能
TrendMaestro5
Stefano Frisetti
note: this indicator is for METATRADER4, if you want the version for METATRADER5 this is the link:  https://www.mql5.com/it/market/product/108106 TRENDMAESTRO ver 2.4 TRENDMAESTRO recognizes a new TREND in the bud, he never makes mistakes. The certainty of identifying a new TREND is priceless. DESCRIPTION TRENDMAESTRO identifies a new TREND in the bud, this indicator examines the volatility, volumes and momentum to identify the moment in which there is an explosion of one or more of these data a
Golden Spikes Premium
Kwaku Bondzie Ghartey
Golden Spikes Detector Overview: The Golden Spikes Premium is a groundbreaking trading indicator meticulously crafted for the Boom and Crash indices on the Deriv market. Tailored to meet the needs of discerning traders, this powerful tool operates exclusively on the one-minute timeframe, providing timely and precise signals to maximize your trading potential. The Golden Spikes Detector stands out in its ability to deliver accurate signals, ensuring that you capitalize on market opportunities wit
Gartley Hunter Multi
Siarhei Vashchylka
5 (8)
Gartley Hunter Multi - An indicator for searching for harmonic patterns simultaneously on dozens of trading instruments and on all possible timeframes. Manual (Be sure to read before purchasing) | Version for MT4 Advantages 1. Patterns: Gartley, Butterfly, Shark, Crab. Bat, Alternate Bat, Deep Crab, Cypher 2. Simultaneous search for patterns on dozens of trading instruments and on all possible timeframes 3. Search for patterns of all possible sizes. From the smallest to the largest 4. A
Matrix Arrow Indicator MT5
Juvenille Emperor Limited
5 (14)
矩阵箭头指标 MT5   是一种独特的 10 合 1 趋势,遵循   100% 非重绘多时间框架指标 ,可用于所有符号/工具: 外汇 、 商品 、 加密货币 、 指数 、 股票 。 Matrix Arrow Indicator MT5 将在其早期阶段确定当前趋势,从多达 10 个标准指标中收集信息和数据,它们是: 平均定向运动指数 (ADX) 商品渠道指数 (CCI) 经典 Heiken Ashi 蜡烛 移动平均线 移动平均收敛散度 (MACD) 相对活力指数 (RVI) 相对强弱指数 (RSI) 抛物线SAR 随机振荡器 威廉姆斯的百分比范围 当所有指标给出有效的买入或卖出信号时,相应的箭头将打印在图表上,在下一根蜡烛/柱线开盘时,指示强劲的上升趋势/下降趋势。用户可以选择使用哪些指标,并可以单独调整每个指标的参数。 Matrix Arrow Indicator MT5 仅从选定的指标中收集信息,并仅根据其数据打印箭头。   Matrix Arrow Indicator MT5   还可以为所有新信号发送终端、推送通知或电子邮件警报。无论您是黄牛、日内交易者还是波段交易者, Mat
ICT, SMC, SMART MONEY CONCEPTS, SMART MONEY, Smart Money Concept, Support and Resistance, Trend Analysis, Price Action, Market Structure, Order Blocks, BOS/CHoCH,   Breaker Blocks ,  Momentum Shift,   Supply&Demand Zone/Order Blocks , Strong Imbalance,   HH/LL/HL/LH,    Fair Value Gap, FVG,  Premium  &   Discount   Zones, Fibonacci Retracement, OTE, Buy Side Liquidity, Sell Side Liquidity, BSL/SSL Taken, Equal Highs & Lows, MTF Dashboard, Multiple Time Frame, BigBar, HTF OB, HTF Market Structure
Volatility Trend System - a trading system that gives signals for entries. The volatility system gives linear and point signals in the direction of the trend, as well as signals to exit it, without redrawing and delays. The trend indicator monitors the direction of the medium-term trend, shows the direction and its change. The signal indicator is based on changes in volatility and shows market entries. The indicator is equipped with several types of alerts. Can be applied to various trading in
Blahtech Supply Demand MT5
Blahtech Limited
4.54 (13)
Was: $299  Now: $99   Supply Demand uses previous price action to identify potential imbalances between buyers and sellers. The key is to identify the better odds zones, not just the untouched ones. Blahtech Supply Demand indicator delivers functionality previously unavailable on any trading platform. This 4-in-1 indicator not only highlights the higher probability zones using a multi-criteria strength engine, but also combines it with multi-timeframe trend analysis, previously confirmed swings
Gold TMAF MTF - 这是一个最佳股票技术指标。该指标算法分析资产的价格走势,并反映波动性和潜在进入区域。 最佳指标信号: - 卖出 = TMA2 的红色上边界高于 TMA1 的红色上边界 + 上方的红色分形指标 + 同方向的黄色 SR 信号箭头。 - 买入 = TMA2 的蓝色下边界低于 TMA1 的蓝色下边界 + 下方的蓝色分形指标 + 同方向的水蓝色 SR 信号箭头。 该指标的优点 1. 指标产生的信号精确度高。 2. 确认的箭头信号不会重绘,分形信号可以重绘半个周期。 3. 您可以在任何经纪商的 MetaTrader 5 交易平台上进行交易。 4. 您可以交易任何资产(货币、金属、加密货币、股票、指数等)。 5. 最好在 M30-H1 时间框架(中期交易)上进行交易。 6. 在指标设置中可更改个别参数(TF、颜色等),以便每位交易者都能轻松定制适合自己的指标。 7. 该指标既可作为交易系统的主要补充,也可作为独立的交易系统使用。 注意:交易的入市准确性和盈利能力仅取决于交易者的技能。任何指标都只是交易者的助手,而非行动指南。
Automated Trendlines MT5
Georgios Kalomoiropoulos
趋势线是外汇交易中最重要的技术分析工具。不幸的是,大多数交易者没有正确绘制它们。自动趋势线指标是专业交易者的专业工具,可帮助您可视化市场的趋势运动。 有两种类型的趋势线看涨趋势线和看跌趋势线。 在上升趋势中,外汇趋势线是通过价格变动的最低摆动点绘制的。 连接至少两个“最低点”将创建一条趋势线。 在下跌趋势中,趋势线是通过价格走势的最高摆动点绘制的。 连接至少两个“最高点”将创建一条趋势线。 趋势线何时突破? 当看跌蜡烛收于看涨​​趋势线下方并且蜡烛的高点在趋势线上方时,看涨趋势线会被打破。 当看涨蜡烛收于看跌趋势线上方并且蜡烛的低点低于趋势线时,看跌趋势线会被打破。 趋势线何时删除? 当一根完整的蜡烛在看涨趋势线下方形成时,看涨趋势线将被删除。 当完整的蜡烛在看跌趋势线上方形成时,看跌趋势线将被删除。 您可以从输入参数更改看涨和看跌趋势线的颜色和宽度。
TPA True Price Action indicator reveals the true price action of the market makers through 100% non-repainting signals strictly at the close of a candle! TPA shows entries and re-entries, every time the bulls are definitely stronger than the bears and vice versa. Not to confuse with red/green candles. The shift of power gets confirmed at the earliest stage and is ONE exit strategy of several. There are available now two free parts of the TPA User Guide for our customers. The first "The Basics"
The 1 2 3 Pattern Scanner MT5
Reza Aghajanpour
5 (16)
** All Symbols x All Timeframes scan just by pressing scanner button ** ***Contact me after purchase to send you instructions and add you in "123 scanner group" for sharing or seeing experiences with other users. After 17 years of experience in the markets and programming, Winner indicator is ready. I would like to share with you! Introduction The 123 Pattern Scanner indicator with a special enhanced algorithm is a very repetitive common pattern finder with a high success rate . Interestingly,
Auto Order Block with break of structure based on ICT and Smart Money Concepts (SMC) Futures Break of Structure ( BoS )             Order block ( OB )            Higher time frame Order block / Point of Interest ( POI )    shown on current chart           Fair value Gap ( FVG ) / Imbalance   -  MTF      ( Multi Time Frame )    HH/LL/HL/LH  -  MTF      ( Multi Time Frame )  Choch  MTF      ( Multi Time Frame )  Volume Imbalance     ,  MTF          vIMB Gap’s Power of 3 Equal High
Trend Reversal Scanner MT5
Reza Aghajanpour
5 (5)
**   All Symbols   x   All Timeframes   scan just by pressing scanner button ** *** Contact me after the purchase to send you instructions and add you in "Trend Reversal group" for sharing or seeing experiences with other users. Introduction: Trendlines are the most famous technical analysis in trading . Trendlines continually form on the charts of markets across all the different timeframes providing huge opportunities for traders to jump in and profit on the action. In the other hand,  The tre
介绍     Quantum Breakout PRO   ,突破性的 MQL5 指标,正在改变您交易突破区域的方式!由拥有超过13年交易经验的资深交易员团队开发,     量子突破 PRO     旨在通过其创新和动态的突破区域策略将您的交易之旅推向新的高度。 量子突破指标将为您提供带有 5 个利润目标区域的突破区域的信号箭头,以及基于突破框的止损建议。 它既适合新手交易者,也适合专业交易者。 量子 EA 通道:       点击这里 重要的!购买后请私信我领取安装手册。 建议: 时间范围:M15 货币对:GBPJPY、EURJPY、USDJPY、NZDUSD、XAUUSD 账户类型:ECN、Raw 或 Razor,点差极低 经纪商时间:GMT +3 经纪商:IC Markets、Pepperstone with Raw 和 Razor 的点差最低 规格: 不重漆! 最多 5 个建议利润目标区域 建议止损水平 可定制的盒子。您可以设置自己的 Box Time Start 和 Box Time End。 接触 如果您有任何疑问或需要帮
Order Block Hunter MT5
Noha Mohamed Fathy Younes Badr
5 (1)
Order block hunter indicator is the best indicator for  hunt the order blocks that area where there has been a large concentration of limit orders waiting to be executed Order blocks are identified on a chart by observing previous price action and looking for areas where the price experienced significant movement or sudden changes in direction .This indicator does that for you by using very complicated codes and helps you to take the best areas To buy and sell because it make marks at the best a
AW Trend Predictor MT5
AW Trading Software Limited
4.78 (58)
一个系统中趋势和故障水平的组合。先进的指标算法过滤市场噪音,确定趋势、进入点以及可能的退出水平。指标信号记录在统计模块中,您可以选择最合适的工具,显示信号历史的有效性。该指标计算获利和止损标记。 手册和说明 ->   这里 / MT4 版本 ->   这里 如何使用指标进行交易: 使用趋势预测器进行交易只需三个简单的步骤: 第 1 步 - 开仓 收到买入信号,成功率超过 70% 第 2 步 - 确定止损 通过相反的信号选择中继线 第 3 步 - 定义止盈策略 策略一:达到 TP1 时平仓 策略 2:达到 TP1 时平仓 50%,达到 TP2 时平仓剩余 50% 策略三:在趋势反转时平仓 好处: 从不重绘结果,信号严格位于蜡烛收盘时 它可以在顾问中使用 获利和止损标记 对交易策略或独立策略的重要补充 市场噪音过滤算法 适用于任何工具 统计模块: 为了更好地选择配对,请使用内置的统计计算。 计算交易 - 给出统计数据的信号总数 成功评级 - 达到 TP1 的信号百分比,或反转那些正获利的信号时的百分比 TakeProfit1 Hit - 达到 TP1 的信号百分比 TakeProfit2
作者的更多信息
Follow Line 指标是交易者用于准确识别和跟随市场趋势的重要工具。该指标动态适应价格变化,绘制一条平滑、连续的线来跟踪价格走势。凭借其视觉上的简洁性和有效性,能够提示趋势变化,Follow Line 是任何交易者策略中的绝佳补充。 主要特点: 趋势跟踪: Follow Line 紧随价格变化,使交易者能够轻松识别当前的市场趋势。 视觉简洁: 通过清晰明确的线条,即使是经验不足的交易者也能快速理解市场方向。 适应性强: 适用于各种时间框架和工具,适合从日内交易到波段交易的多种交易策略。 如何使用: 安装: 将 Follow Line 指标添加到您希望分析的金融工具的图表上。 设置: 根据您的交易策略调整指标参数。 趋势分析: 观察 Follow Line 线条以确定当前趋势方向。 交易机会: Follow Line 在趋势市场中特别有用。例如,在突破情境中,当价格超过重要的阻力或支撑位时,Follow Line 可以确认走势的有效性。这使交易者能够更加自信地把握价格波动的机会。
Enhance Your Trading Strategies with the "Order Block" Indicator for MT4 Discover the "Order Block" Indicator: The "Order Block" Indicator for MT4 is designed to help you precisely identify order blocks in the market by marking the highs and lows of the order block candles. This powerful tool enables you to understand where large institutions place their orders, improving your ability to predict market movements. Key Features: Precise Order Block Detection: Automatically highlights the highs and
FREE Spread indicator for MetaTrader 4 this indicator includes: -average spread -current spread -minimum spread -maximum spread If you are interested in my products I recommend you visit my page where you can find: Experts Advisors:  https://www.mql5.com/it/market/product/119456?source=Site+Profile indicators:  https://www.mql5.com/it/market/product/120038?source=Site+Profile I hope the spread indicator will be useful to you. https://www.mql5.com/it/users/kappa05
FREE
Volume Profile Indicator for MT4 Gain a trading edge with the "Volume Profile" indicator for MetaTrader 4 (MT4). This advanced technical analysis tool allows you to precisely identify key support and resistance levels based on transaction volume. Easily visualize market areas of high interest, where trading volumes are highest, and use this information to make more informed trading decisions. Key Features: Clear and detailed visualization : The indicator displays volume histograms directly on th
Presentation of the "Color Range Indicator" The "Color Range Indicator" is a powerful technical analysis tool designed for the MT4 platform, perfect for traders who want a clear and immediate view of market trends. This indicator draws a colored line based on the current trend, making it easier to interpret price movements. Indicator Description: Green line : Indicates an uptrend. Use this signal to consider buying opportunities. Red line : Indicates a downtrend. Use this signal to consider sell
什么是“Automatic BE”? “Automatic BE”是每位手动交易员的必备工具,旨在显著改善风险管理。这款先进的指标可以在市场朝有利方向发展时,自动将止损调整到保本点,从而保护您的利润。使用“Automatic BE”,即使您不在屏幕前,您的收益也会得到保障,您可以继续自信地进行交易。 为什么选择“Automatic BE”? 自动保护利润 :“Automatic BE”可以让您不再担心由于市场突然逆转而失去潜在收益。当您的交易达到一定的利润水平时,指标会自动将止损移动到保本点,确保盈利的交易不会变成亏损。 使用简单 :该工具设计简单直观。即使您是交易新手,设置“Automatic BE”也非常容易。只需配置您想要的参数,然后让指标自动管理您的交易。 设置灵活 :每位交易员都有自己的策略,“Automatic BE”能够完美适应您的需求。您可以选择在何时激活保本点,从而完全掌控您的交易操作。 提高风险管理 :有效的风险管理是成功交易的关键。“Automatic BE”帮助您将潜在的损失降至最低,确保您的最有前景的交易仍然保持优势,减少交易的压力。 它如何改善您的交易? 想
什么是"实时多指标"? "实时多指标" 是一款先进的交易工具,旨在简化和优化您的技术分析。这款革命性指标收集多个时间框架和技术指标的信号,并将它们显示在一个清晰易读的表格中。如果您希望在不必不断切换图表或手动分析每个指标的情况下获得完整和详细的市场视图,"实时多指标" 是您的理想解决方案。 为什么选择"实时多指标"? 多时间框架分析: "实时多指标" 允许您同时监控多个时间框架的市场。从M15到H4,这个指标清楚地显示了每个时间框架的趋势是上升还是下降,帮助您根据市场的整体视图做出明智的决策。 多个指标的集成: 该工具结合了多个关键技术指标的信号,如Parabolic SAR, MACD, SMA, ADX 和 CCI。无需分别分析每个指标,"实时多指标" 为您提供了全面而详细的概览,清晰地显示了多个时间框架中的趋势和买卖信号。 清晰的汇总表: "实时多指标" 的一个突出特点是其汇总表。此表清晰显示了每个时间框架中每个指标的买入或卖出信号,使市场状况一目了然,并使您能够迅速应对机会。 易于使用: 无论您的交易经验水平如何,"实时多指标" 都被设计为用户友好型。直观的界面和信息的有序呈现
OB Indicator
Nicola Capatti
Order Block indicator, highs and lows; the indicator focuses mainly on OBs, on the chart they are represented with a horizontal line on the minimum and maximum of that candle. While for the maximums and minimums only one line is marked (see the images to understand better). The indicator is for MT5, it works on all Timeframes, on any Forex Pair, on any index and on crypto markets. (For any information on the indicator do not hesitate to contact me). Limited time discount (50%) 74.90$ -> 38.60$
ScalpingMarketEA
Nicola Capatti
Expert Advisor for scalping; This EA was built for monthly profitability. Works on any asset: Forex, Indices, Crypto and Stocks. Perfectly usable in MT5 tester and usable on any TimeFrame. The EA has various inputs available to customize operations: -Lots -Risk% (0 = Fix) -OrderDist (the distance between one order and another, the distance is calculated in points not pips) -TP (in points) -Sl (in points) -TrailingStopTrigger(the trailing stop trigger point in points) -TrailingStop(distance from
Highs, Lows and Bos Indicator for MT5; The indicator works on any type of market and on all TimeFrames. It also works on the MetaTrader5 Tester. the main function of the indicator is to identify the highs and lows by marking them with a point above/below the candle, then with a horizontal line it marks the Bos. It is very simple and intuitive, there are only 2 inputs: -the color of the maximums -the color of the minima For any other information do not hesitate to contact me.
Panel Info Trade For MT5; The indicator has 2 main objects: -An icon chart that you can change Timeframe, zoom, Forex Pair, crypto....the position of the graph can be modified via the (x;y) inputs. The chart is perfectly usable in the MT5 tester. If the graph isn't for you and doesn't help you with anything, you can press the button on the top right to make it smaller. -the second object is a dynamic control panel where you can change plots, place sl and tp, BE, close partial... (if you watch th
货币强度指数 (Currency Strength Index - CSI) 指标 在激活指标之前,请记得将"TRUE"设置为显示货币对 货币强度指数 (Currency Strength Index - CSI) 指标是外汇交易中用于衡量主要货币相对强度的强大工具。该指标帮助交易者识别在特定时间内最强和最弱的货币,从而使他们能够做出更明智的交易决策。 主要特点: 比较分析: 根据历史和当前数据比较不同货币的强度。 交易信号: 帮助识别基于相对强度的最佳货币对进行交易。 自定义: 用户可以配置计算周期和其他参数,以适应其交易策略。 直观显示: 以清晰和可视化的方式呈现信息,便于数据解释。 如何使用: 安装: 将CSI指标添加到所需货币对的图表中。 设置: 配置所需的参数,如计算周期。 分析: 观察货币强度线,识别那些强度增加或减少的货币。 交易: 使用这些信息做出交易决策,选择买入强势货币,卖出弱势货币。
In the world of trading, the key to success lies in having the right tools at the right time. Our innovative Volume Profile indicator was developed with one goal in mind: to provide traders with unprecedented access to vital market activity information. This cutting-edge tool allows you to not only see where and when volumes are traded but also to understand market depth with clarity never seen before. Main Features: Temporal Flexibility: Set the analysis range up to 1800 minutes to perfectly ma
Maximize Your Trading Opportunities with the "Auto Trendlines" Indicator Discover the "Auto Trendlines" Indicator: "Auto Trendlines" is the essential tool for every technical trader. This indicator automatically plots trend lines, pinpointing support and resistance levels with surgical precision. It's ideal for those looking to capitalize on market breakouts and reversals. Key Features: Automatic Trendline Plotting: Identifies and draws crucial trend lines without manual intervention. Advanced C
AutoFibo for MT5
Nicola Capatti
Optimize Your Trading Decisions with the "autoFibo" Indicator Discover the "autoFibo" Indicator: "autoFibo" is the essential analysis tool for traders who want to fully leverage Fibonacci levels without the hassle of manual plotting. This indicator automates the Fibonacci retracement process, providing instant visual access to key support and resistance zones. Key Features: Automatic Fibonacci Retracement: Automatically plots Fibonacci levels, making it easy to identify support and resistance zo
Enhance Your Trading Performance with the "Better Volume" Indicator Discover the "Better Volume" Indicator: The "Better Volume" is the essential market volume analysis tool for traders aiming to stand out. It analyzes tick volumes with unprecedented accuracy, featuring an advanced moving average function (PERIOD_MA) and customizable buy and sell alerts. Key Features: Advanced Volume Analysis: Recognize volume peaks signaling crucial price movements. Intuitive Buy and Sell Alerts: Stay one step a
SuperTrend 是交易中最有效且广泛使用的技术指标之一,非常适合识别趋势方向并生成进场和出场信号。基于波动性和趋势,该指标会动态适应市场条件,为交易者提供清晰的视觉参考。 主要特点: 趋势检测: SuperTrend 跟随市场趋势,在下跌趋势中绘制一条位于价格上方的线,在上涨趋势中绘制一条位于价格下方的线。 易于使用: 由于其直观的图形表示,即使是经验较少的交易者也可以轻松解读。 进场/出场信号: 当价格向上穿越 SuperTrend 线时生成买入信号,向下穿越时生成卖出信号。 适应性: 可在不同时间框架和工具上工作,使其成为从日内交易到波段交易的各种交易风格的多功能工具。 如何使用: 安装: 将 SuperTrend 添加到您要分析的金融工具图表中。 设置: 配置指标参数,如周期和倍数,以适应您的交易策略。 趋势分析: 观察 SuperTrend 线以确定当前趋势方向。 交易执行: 使用 SuperTrend 生成的信号做出交易决策。当 SuperTrend 位于价格下方时做多,当其位于上方时做空。 交易机会: SuperTrend 在趋势市场中特别有效。例如,在突破情境中,当
新的组合指标 - 3合1 你是否在寻找可以提升市场分析和投资策略的交易工具?我们将三个最好的指标组合在一个强大且便捷的解决方案中,使你在交易中获得最大的价值。 1. 订单块指标 (原价32.90$) 订单块指标是识别市场中机构兴趣区域的关键工具。该指标标记了订单块蜡烛的高点和低点,这通常代表了价格可能发生反转或趋势延续的关键区域。单独使用时,订单块指标帮助你识别潜在的支撑和阻力区域,从而提高你的交易决策能力。 链接: https://www.mql5.com/it/market/product/121633?source=Site+Market+MT5+Search+Rating006%3aorderblock+indicator 2. FVG指标 (原价34.90$) FVG指标旨在识别公平价值缺口(FVG),这些价格空隙可能表明供需不平衡。这些缺口通常被视为交易机会,因为价格通常会回到这些区域填补空白。FVG指标是希望精准把握这些价格波动的交易者必不可少的工具。 链接: https://www.mql5.com/it/market/product/119368?source=Sit
FVG for MT5
Nicola Capatti
“Fair Value Gap” (FVG) 指标 - 探索市场不平衡的力量 交易的世界充满了隐藏的机会,但只有拥有正确工具的人才能有效识别和利用这些机会。我们的 FVG 指标 旨在帮助您做到这一点。如果您是一位寻求提升市场分析能力并找到最佳进场和出场点的交易员,FVG 指标将是您完美的助手。 什么是 Fair Value Gap (FVG)? Fair Value Gap 的概念指的是供需之间的差异,这种差异在价格图表上形成了一个“缺口”。这个缺口代表了价格可能回调以填补这一不平衡的区域,使这些区域成为潜在的交易机会。这些缺口是在价格快速波动时形成的,可能是理解未来市场行为的关键。 为什么 FVG 指标必不可少? FVG 指标可以轻松帮助您在图表上识别这些不平衡区域,并突出显示价格可能回调以填补缺口的地方。这一信息对于任何交易策略都至关重要,因为它为交易员提供了识别可能发生回调或加速的关键价格水平的能力。 FVG 指标的主要特点 自动缺口识别: FVG 指标自动扫描图表以识别 Fair Value Gap,节省您的时间并减少人为错误的可能性。 清晰的视觉信号: 缺口区域在图表上被清晰
什么是“Schaff RSX”? “Schaff RSX”将相对强弱指数(RSX)的有效性与Schaff周期的精确性相结合,创造出一种独特的指标,帮助您轻松识别最佳的市场进出时机。这就像拥有一个能够检测隐藏交易机会的雷达,让您在竞争中脱颖而出,其他交易者根本无法忽视这一优势。 为什么选择“Schaff RSX”? 清晰直观的视觉简洁性 :“Schaff RSX”的颜色和线条会清楚地显示市场何时处于超买或超卖状态。不再依赖直觉或运气;您将拥有准确可靠的信息,尽在眼前。 完全可定制化 :每个交易者都有自己的策略,而“Schaff RSX”完美适应您的策略。您可以根据自己的喜好配置参数,准确获取您所需要的结果。 适用于每种交易风格 :无论您是日间交易者,还是偏好较长时间段的交易,“Schaff RSX”都能适应各种时间框架,从M1图表到日线图。 完整的交易工具 :通过结合Schaff周期和RSX,您将拥有一个更灵敏和反应迅速的指标,能够比其他工具更精确地捕捉市场动向。 “Schaff RSX”如何改善您的交易? 想象一下,您可以提前识别趋势反转,准确知道市场何时处于极端状态,并通过额外的确定
什么是“Automatic BE”? “Automatic BE”是每位手动交易员的必备工具,旨在显著改善风险管理。这款先进的指标可以在市场朝有利方向发展时,自动将止损调整到保本点,从而保护您的利润。使用“Automatic BE”,即使您不在屏幕前,您的收益也会得到保障,您可以继续自信地进行交易。 为什么选择“Automatic BE”? 自动保护利润 :“Automatic BE”可以让您不再担心由于市场突然逆转而失去潜在收益。当您的交易达到一定的利润水平时,指标会自动将止损移动到保本点,确保盈利的交易不会变成亏损。 使用简单 :该工具设计简单直观。即使您是交易新手,设置“Automatic BE”也非常容易。只需配置您想要的参数,然后让指标自动管理您的交易。 设置灵活 :每位交易员都有自己的策略,“Automatic BE”能够完美适应您的需求。您可以选择在何时激活保本点,从而完全掌控您的交易操作。 提高风险管理 :有效的风险管理是成功交易的关键。“Automatic BE”帮助您将潜在的损失降至最低,确保您的最有前景的交易仍然保持优势,减少交易的压力。 它如何改善您的交易? 想
筛选:
无评论
回复评论