Terra Infinity
- 指标
- Ivan Simonika
- 版本: 1.0
- 激活: 5
Terra Infinity is a flat indicator.
This improved version of the CalcFlat indicator has three additional lines that significantly increase its effectiveness. Unlike its predecessor with two static levels, Terra Infinity adds three dynamic lines above the main histogram, which are interpreted as follows:
base signal line,
minimum signal line,
maximum signal line.
These lines are formed using the additional parameter Avg, which is the average value of the histogram. Averaging produces a line close to the static level, but with improved dynamic generation. Thus, the main signal line is formed. Additional maximum and minimum signal lines are determined by the Activity parameter and are removed from the main signal line.
Options:
Slow—indicator formation parameter No. 1.
Fast—indicator formation parameter No. 2.
Avg—dynamic signal line formation parameter.
Activity—parameter for forming dynamic levels lines.
OnFixed—fixes the levels below as indicator limits.
FixedMaximum - maximum level for each timeframe (static levels).
FixedMinimum - minimum level for each timeframe (static levels).
The indicator can be used as a basic one, applying everything described for the CalcFlat indicator to Terra Infinity.
Thanks to dynamic signal lines, additional operating rules can be set. Let's look at examples.
Note: the trend is set by a trend indicator, for example, the standard Moving Average.
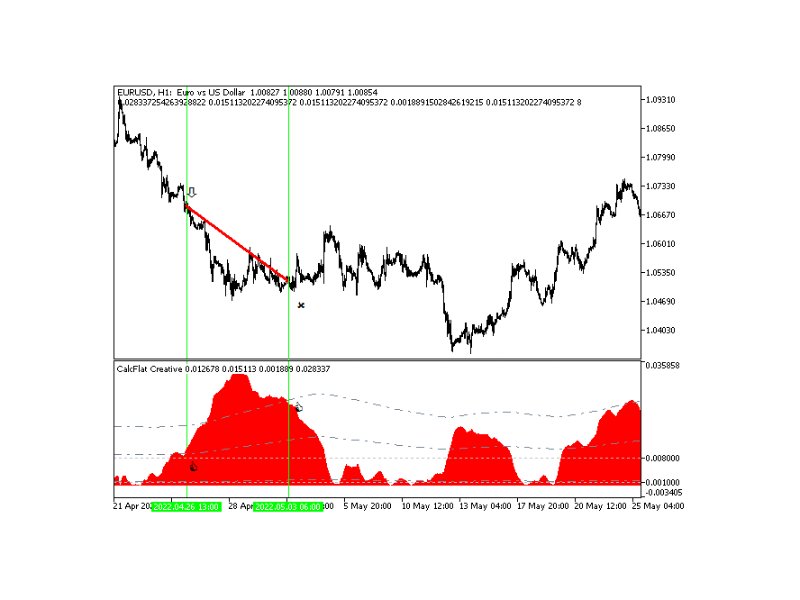
First screenshot: entry when the main line crosses the middle signal line, down arrow on the price chart. Exit when the main line crosses the upper signal line downwards; a cross on the chart indicates exit from the position. The red sloping line represents profit. This method allows you to enter the current trend, which often occurs during a normal trend with pullbacks. If the figure is not fully formed, an additional exit should be provided.
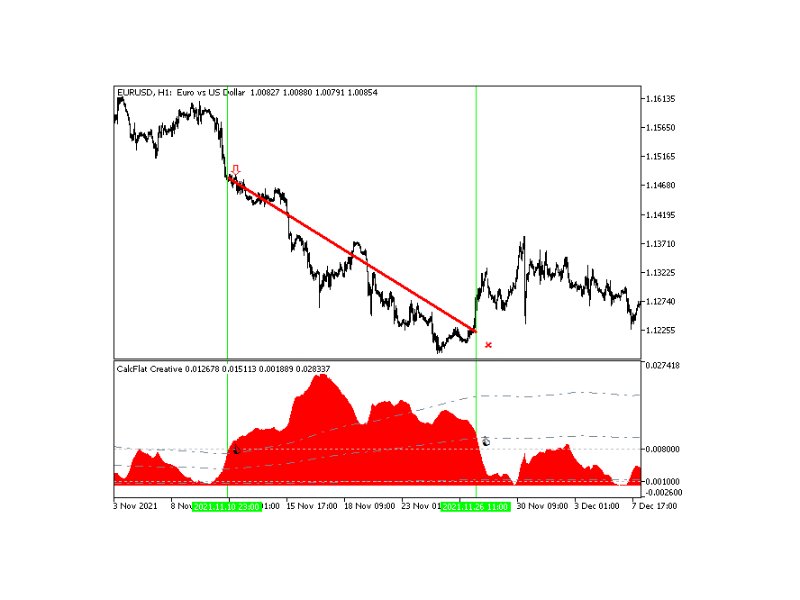
Second screenshot: entry when the main line crosses the upper signal line, down arrow on the price chart. Exit when the main line crosses the middle signal line downwards; a cross on the chart indicates exit. The red sloping line represents profit. This method allows you to enter a long trend with a minimum of pullbacks, which rarely happens.
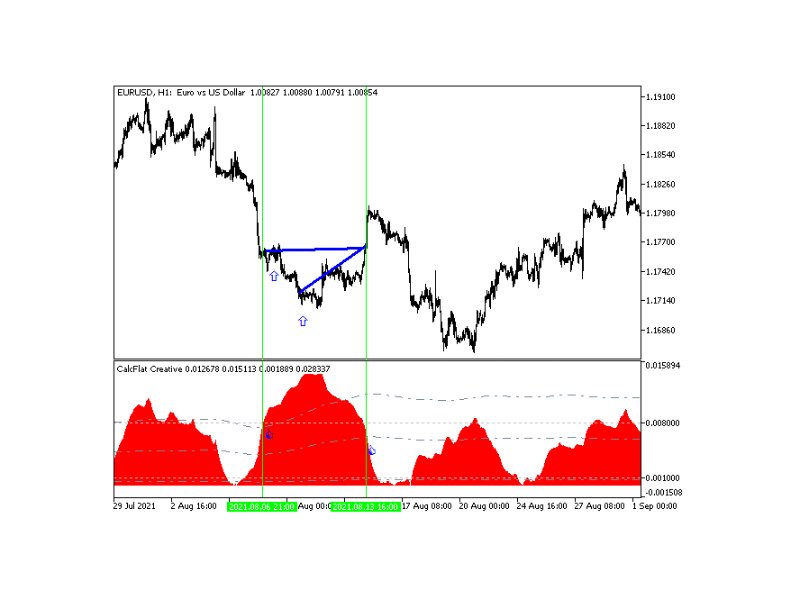
Third screenshot: similar to the second, but a more common version of the trend with rollbacks. We enter the trend at its approximate center, assuming a rollback. When using the martingale strategy, a return to the zero point is likely. If the trend is long-lasting, the series should be closed with a loss on the pullback, which is also recorded by this indicator.


