TMA Channel with showing trend MT5
- 指标
- Yu Fan Zhang
- 版本: 1.0
- 激活: 10
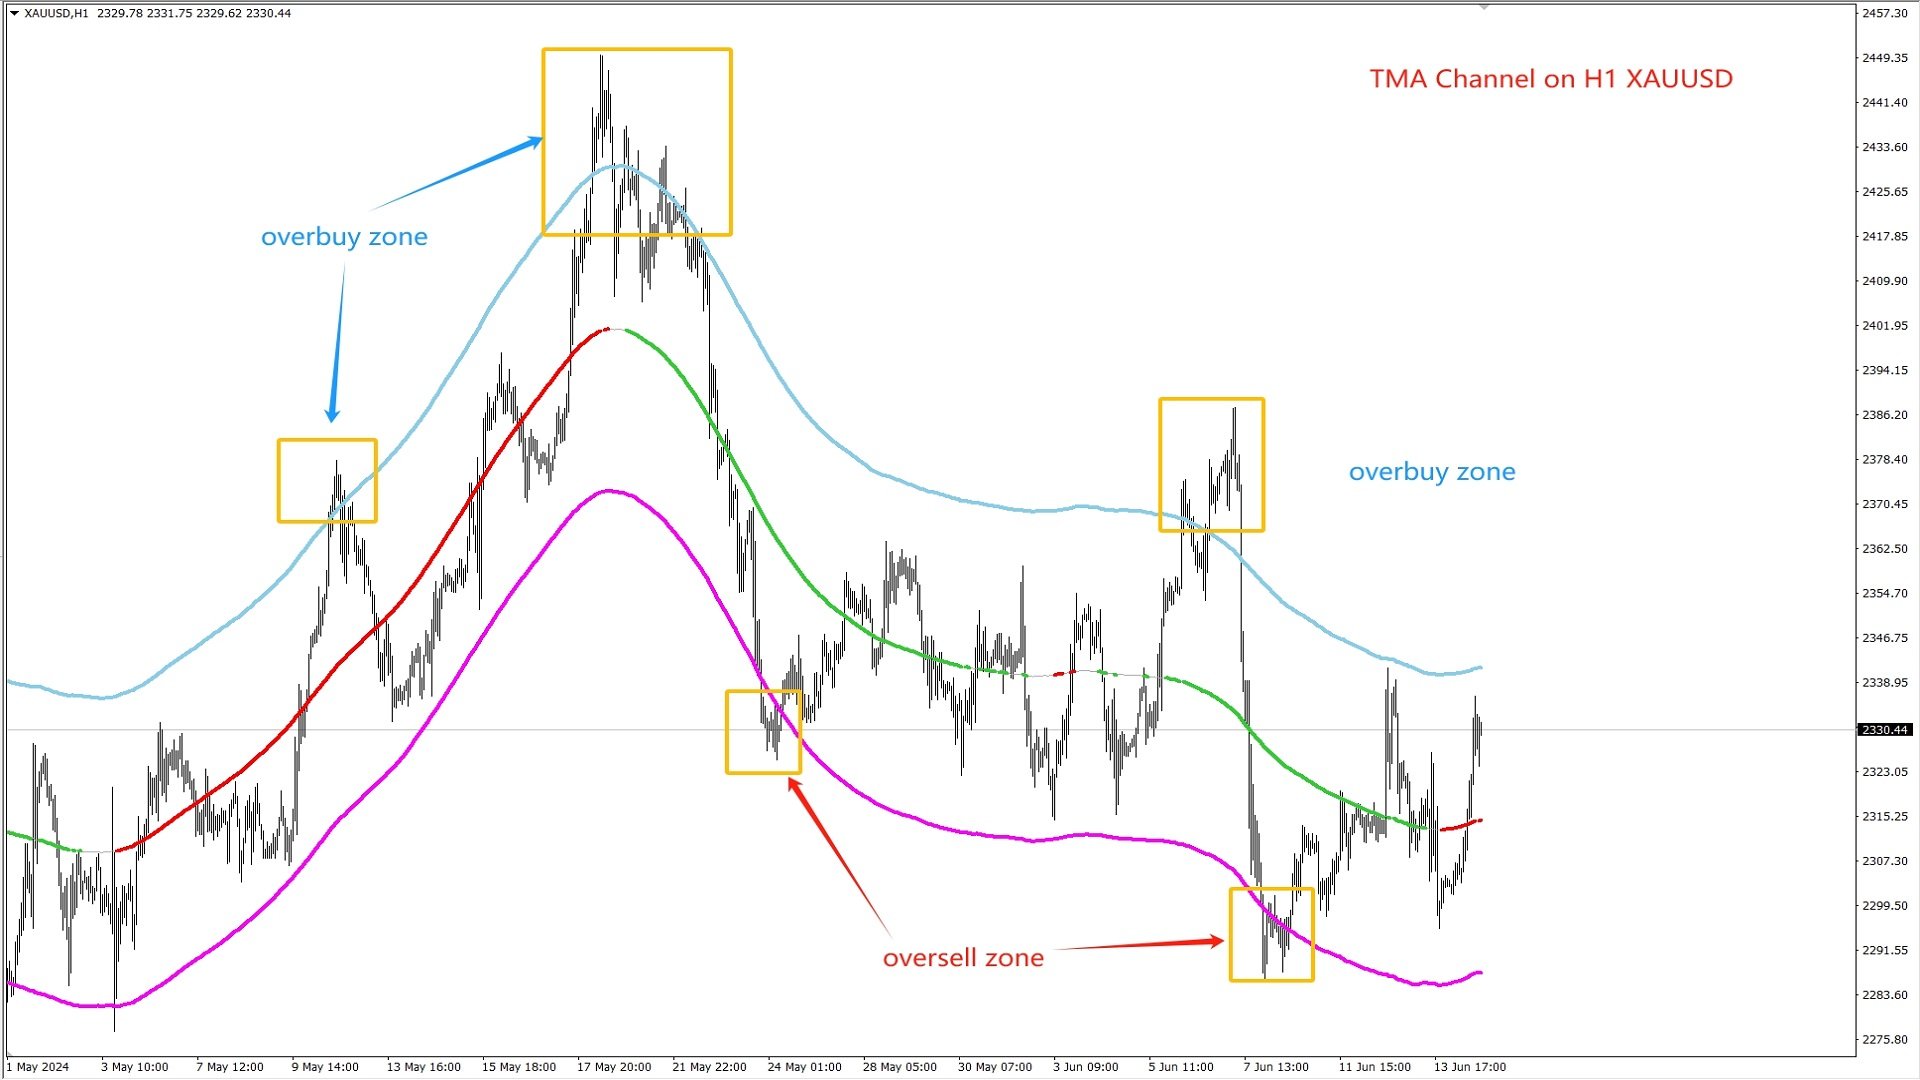
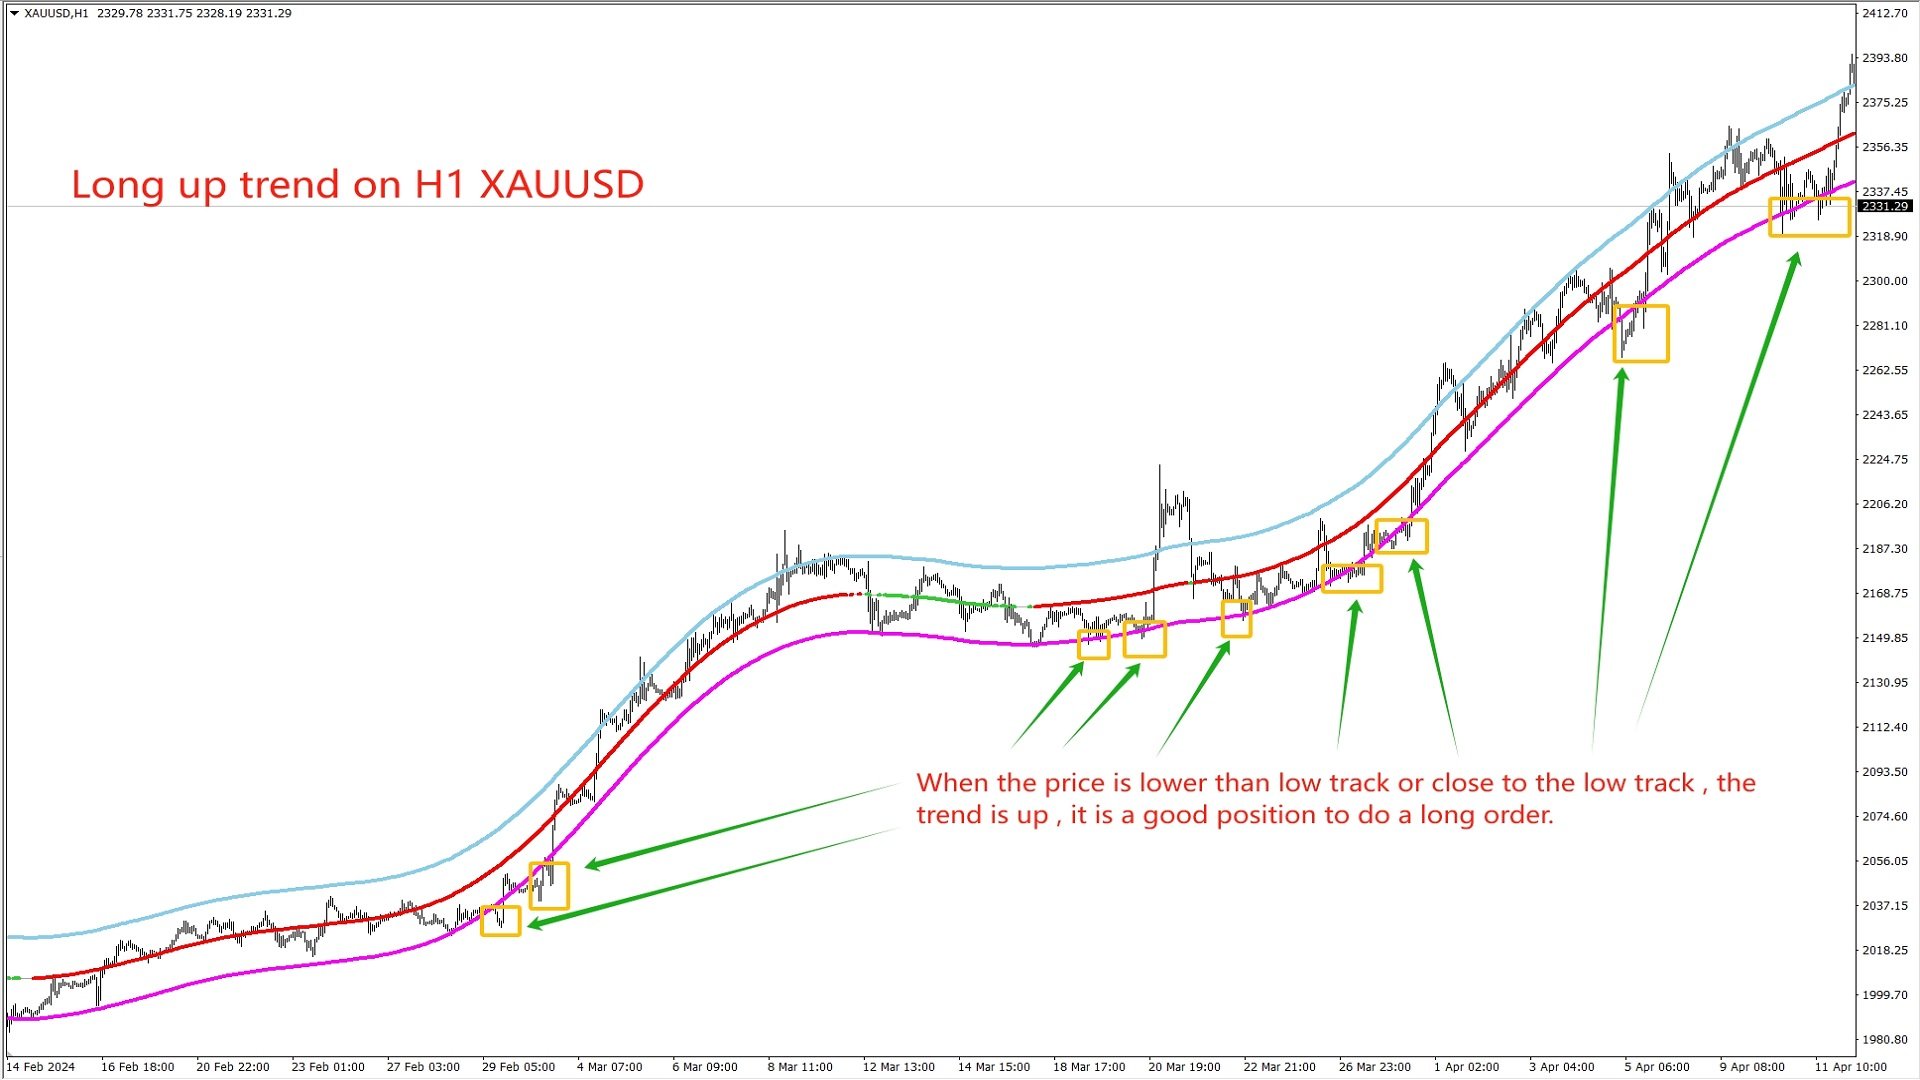
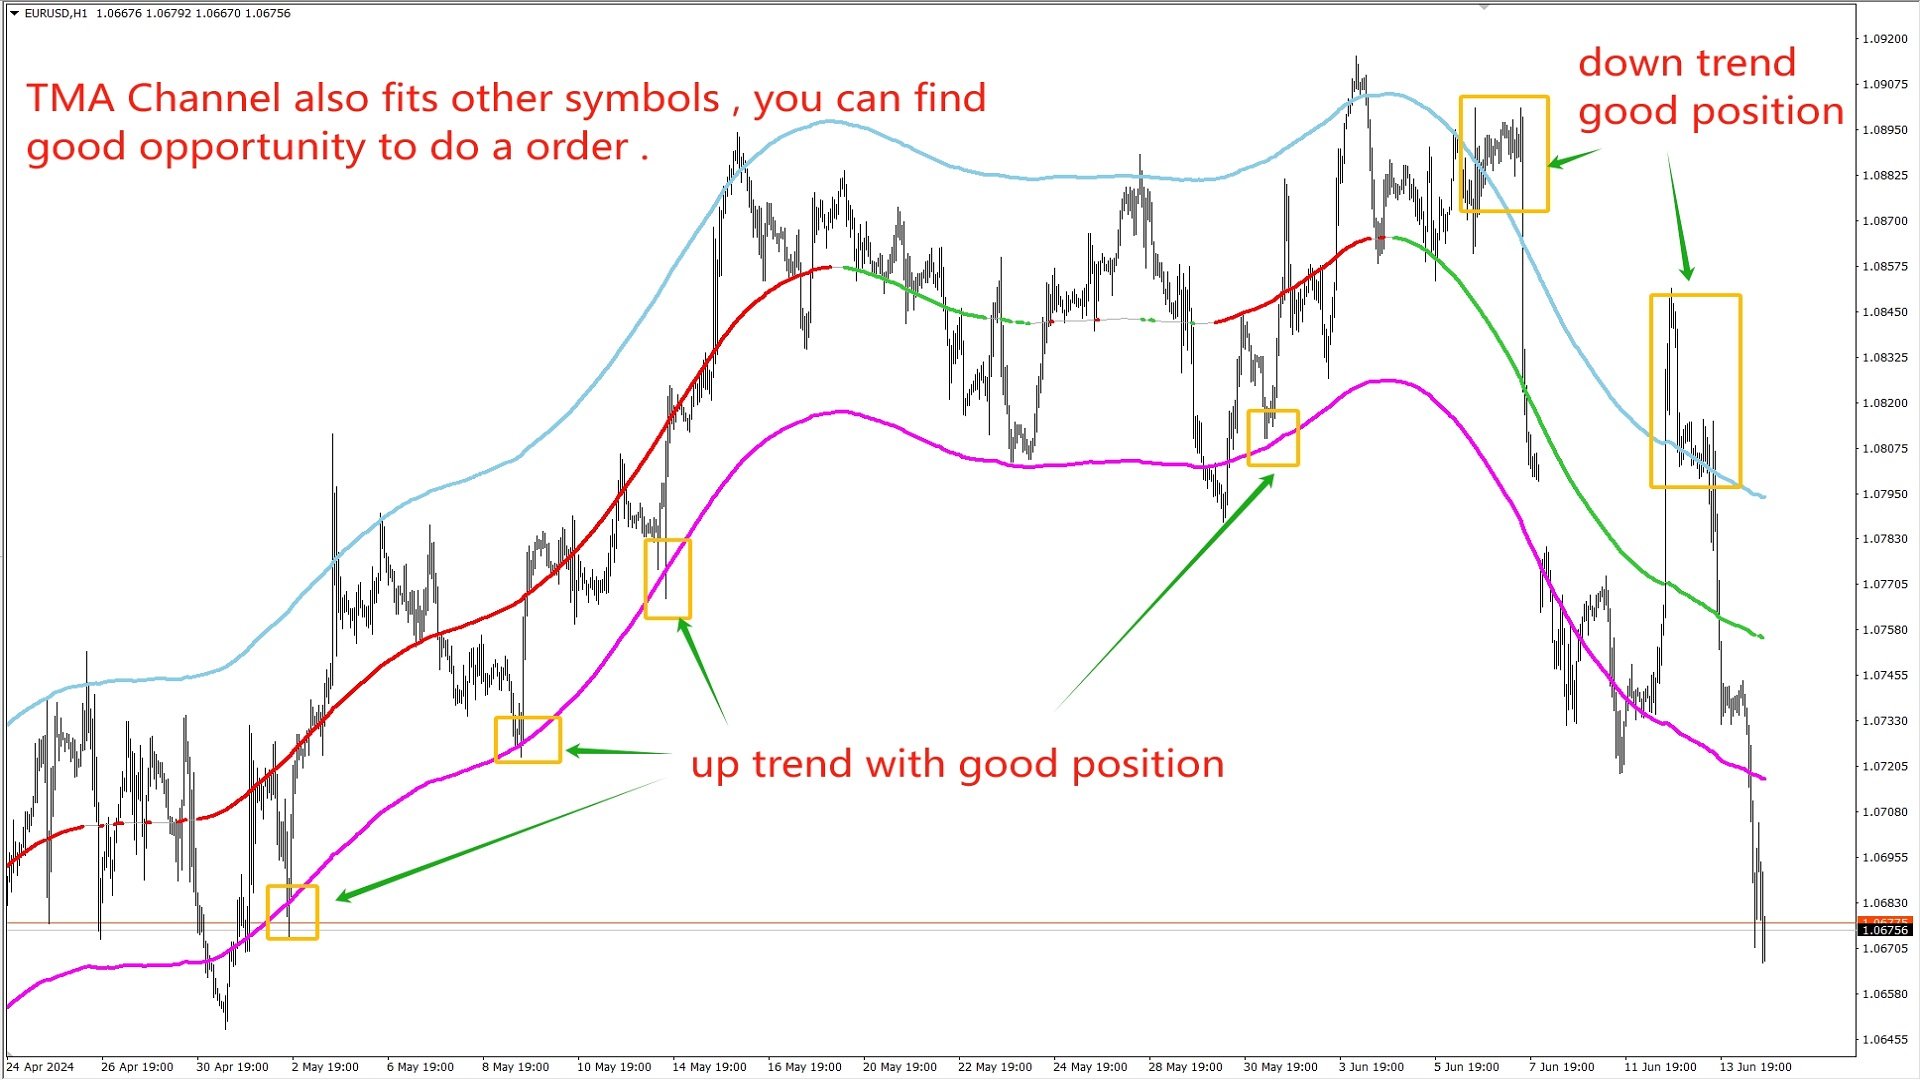
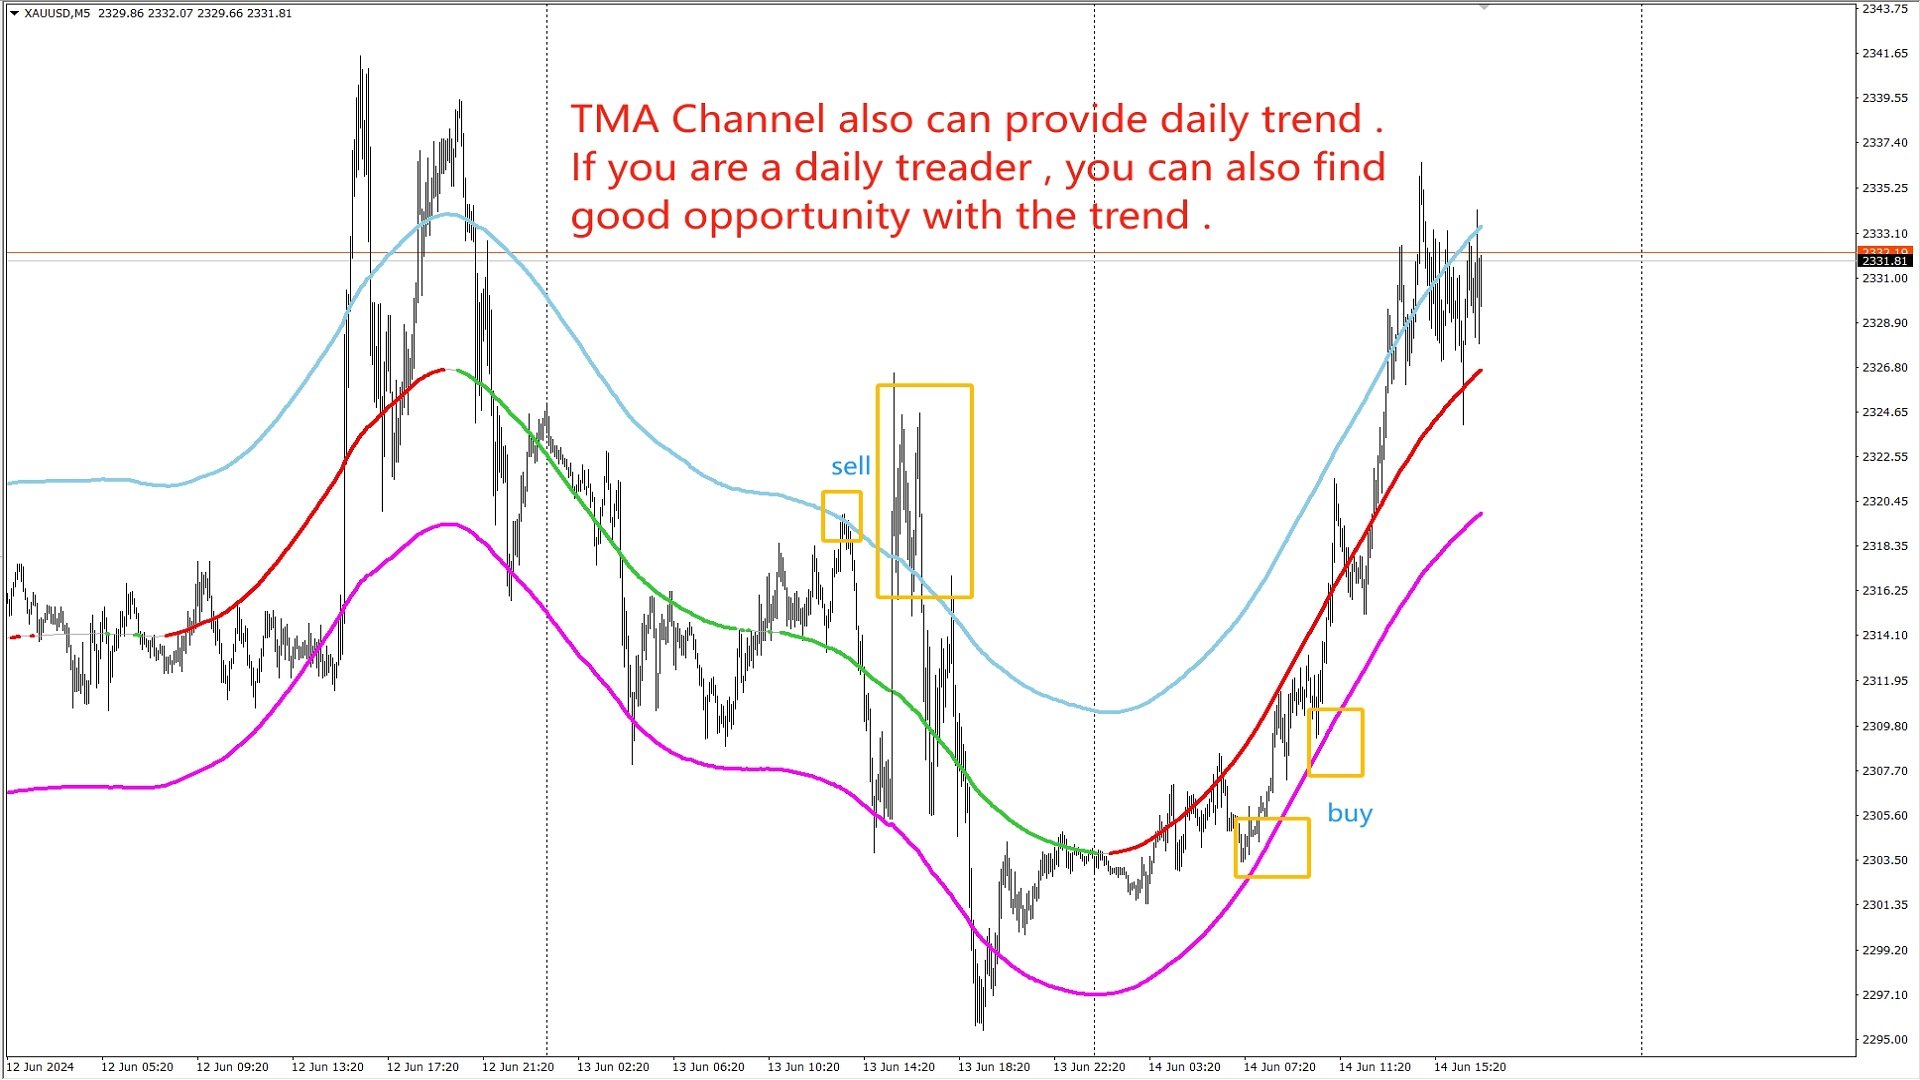
TMA Channel 是在传统的TMA基础之上 , 通过特殊的计算方法得到一个价格通道 . 通道具有上轨 , 中轨 , 下轨 . 当价格接近或者高于上轨时 , 已经处于超买状态 , 这时要注意反转下跌的情况 ; 当价格接近或低于下轨时 , 已经处于超卖状态 , 这时要注意反转上涨的情况 . 指标会根据中轨的坡度 , 来显示出上涨趋势或者下跌趋势 . 当没有明确趋势显示时 , 说明处于宽幅震荡的行情 .
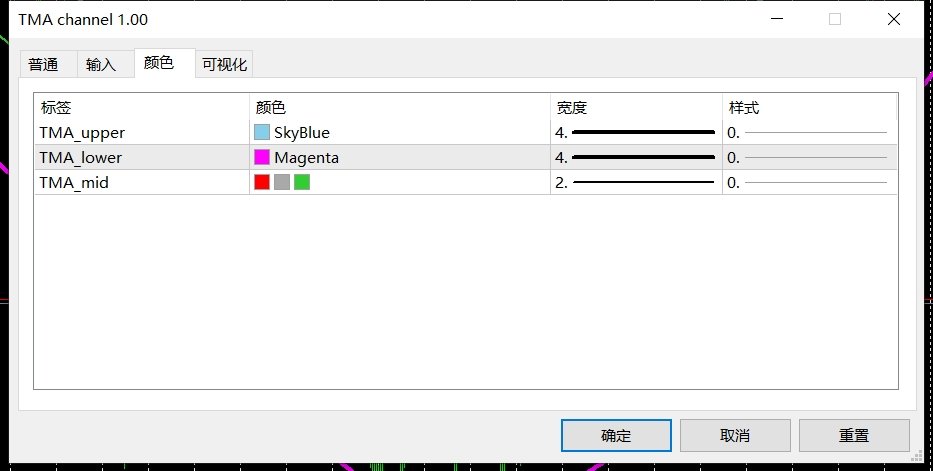
中轨的上升趋势和下降趋势的颜色 , 通过指标的属性里面来设置 , TMA_mid , 第一个颜色是上升趋势的颜色 , 第二个颜色是没有趋势时的颜色 , 第三个颜色是下降趋势的颜色 .
优势 :
对于趋势有很好的跟踪 , 并且能明显的展示出超买和超卖的区域 .
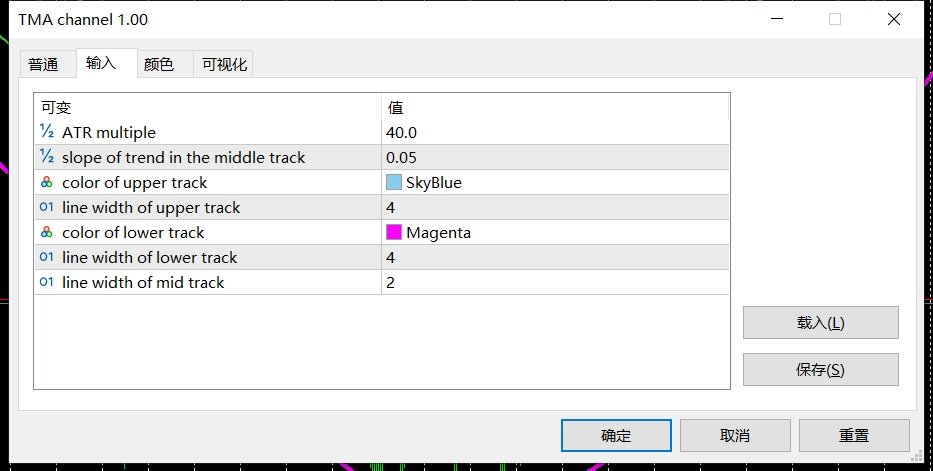
输入参数 :
ATR multiple : ATR 的倍数 , 默认是40 , 修改这个会影响上下轨的位置 , 数值越大 , 上下轨距离中轨越远 .
slope of trend in the middle track : 根据中轨斜率来判断是否是趋势
color of upper track : 上轨颜色
line width of upper track : 上轨线条的宽度
color of lower track : 下轨颜色
line width of lower track : 下轨线条的宽度
color of mid track : 中轨颜色
line width of mid track : 中轨线条的宽度