Smart effective support and resistance levels
- 指标
- Yu Fan Zhang
- 版本: 1.0
- 激活: 8
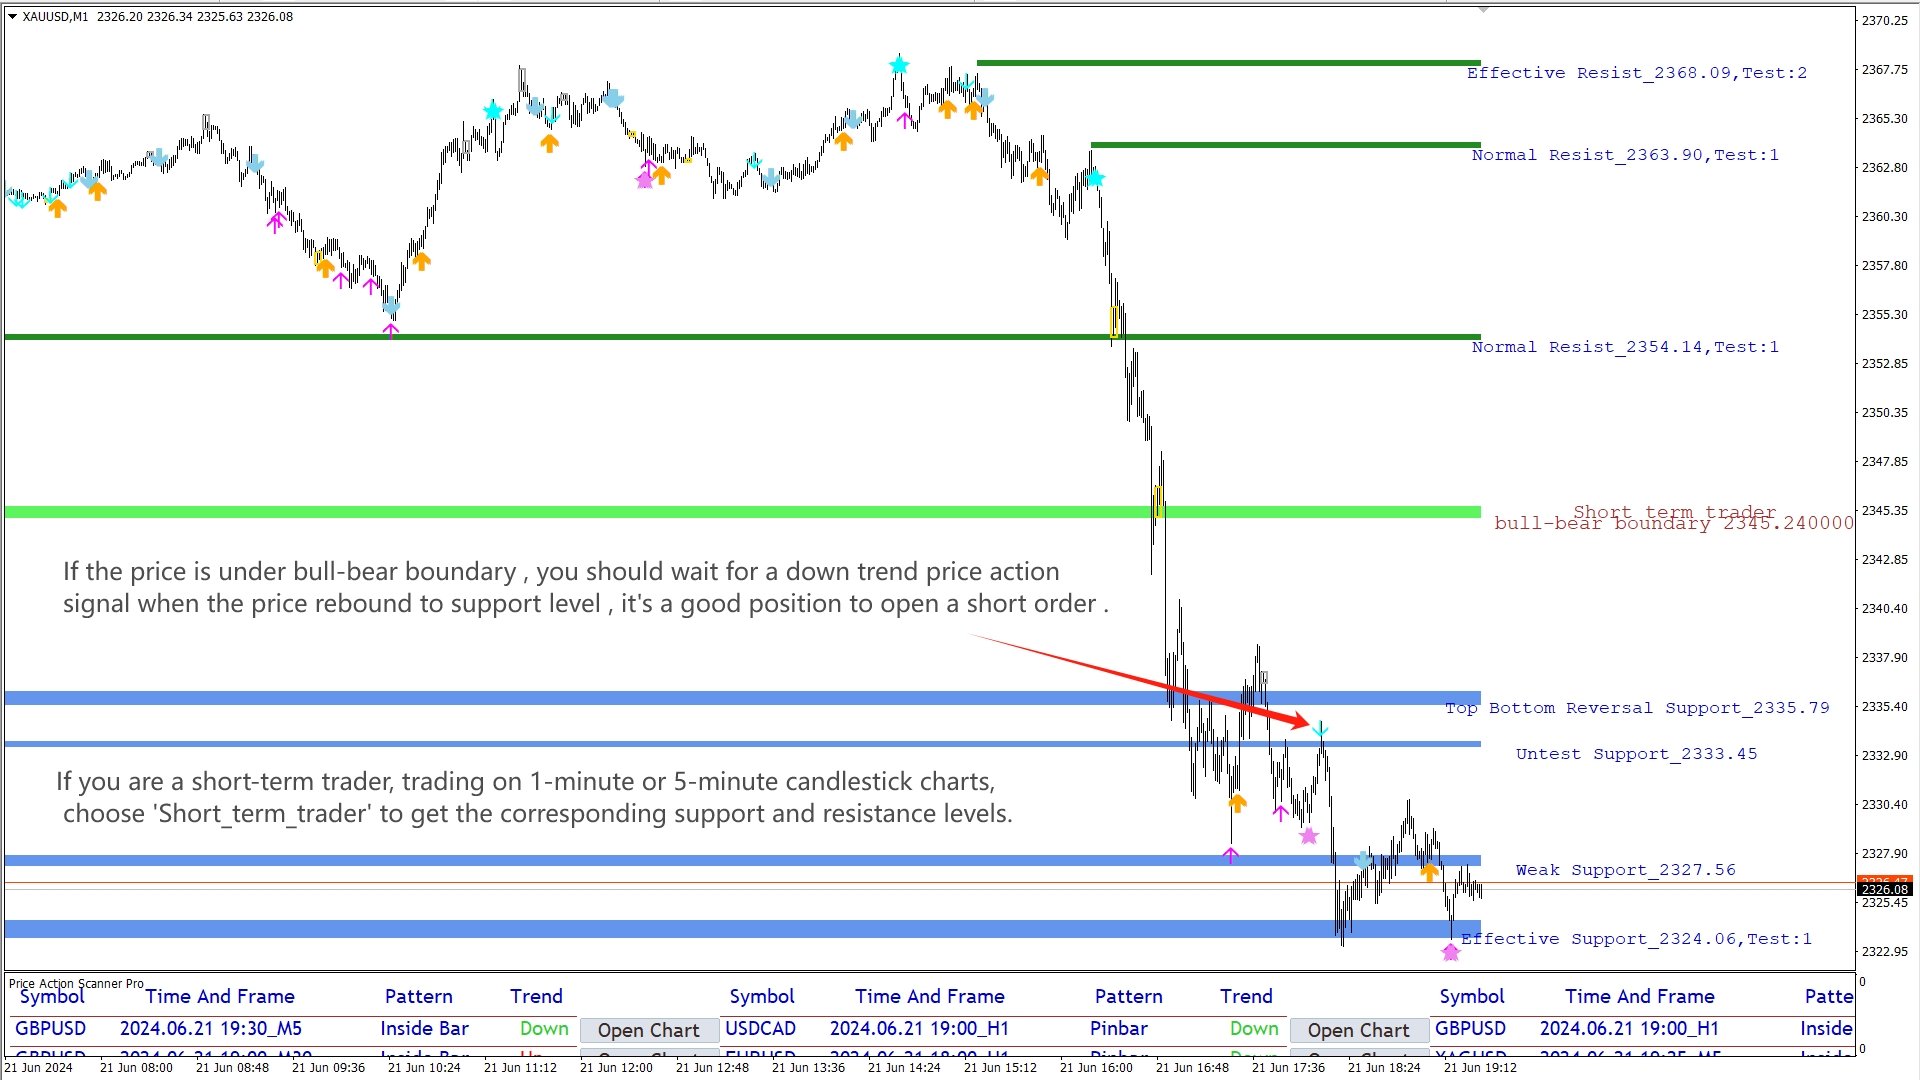
Support and Resistence Levels 是一款智能显示水平支撑阻力位 , 能适用于不同交易频率的交易者的指标 . 你可以选择自己的交易频率 , 指标会自动计算出符合这种交易频率应该参考的支撑阻力位 . 其中 , 牛熊分界线 , 是用来区分多空力量强弱的一个区间 , 也是重要的level . 你可以配合其他指标 , 比如斐波那契 , 价格行为 , 在支撑位做多 , 在阻力位做空 , 也可以突破阻力位追多 , 跌破支撑位追空 .
请一定要注意 , 这些位置只是作为一个用来开仓的依据 , 并不是价格到达位置后直接开仓 .
参数说明 :
Trading frequency : 根据你的交易频率 , 交易习惯 , 来进行相应的选择 .
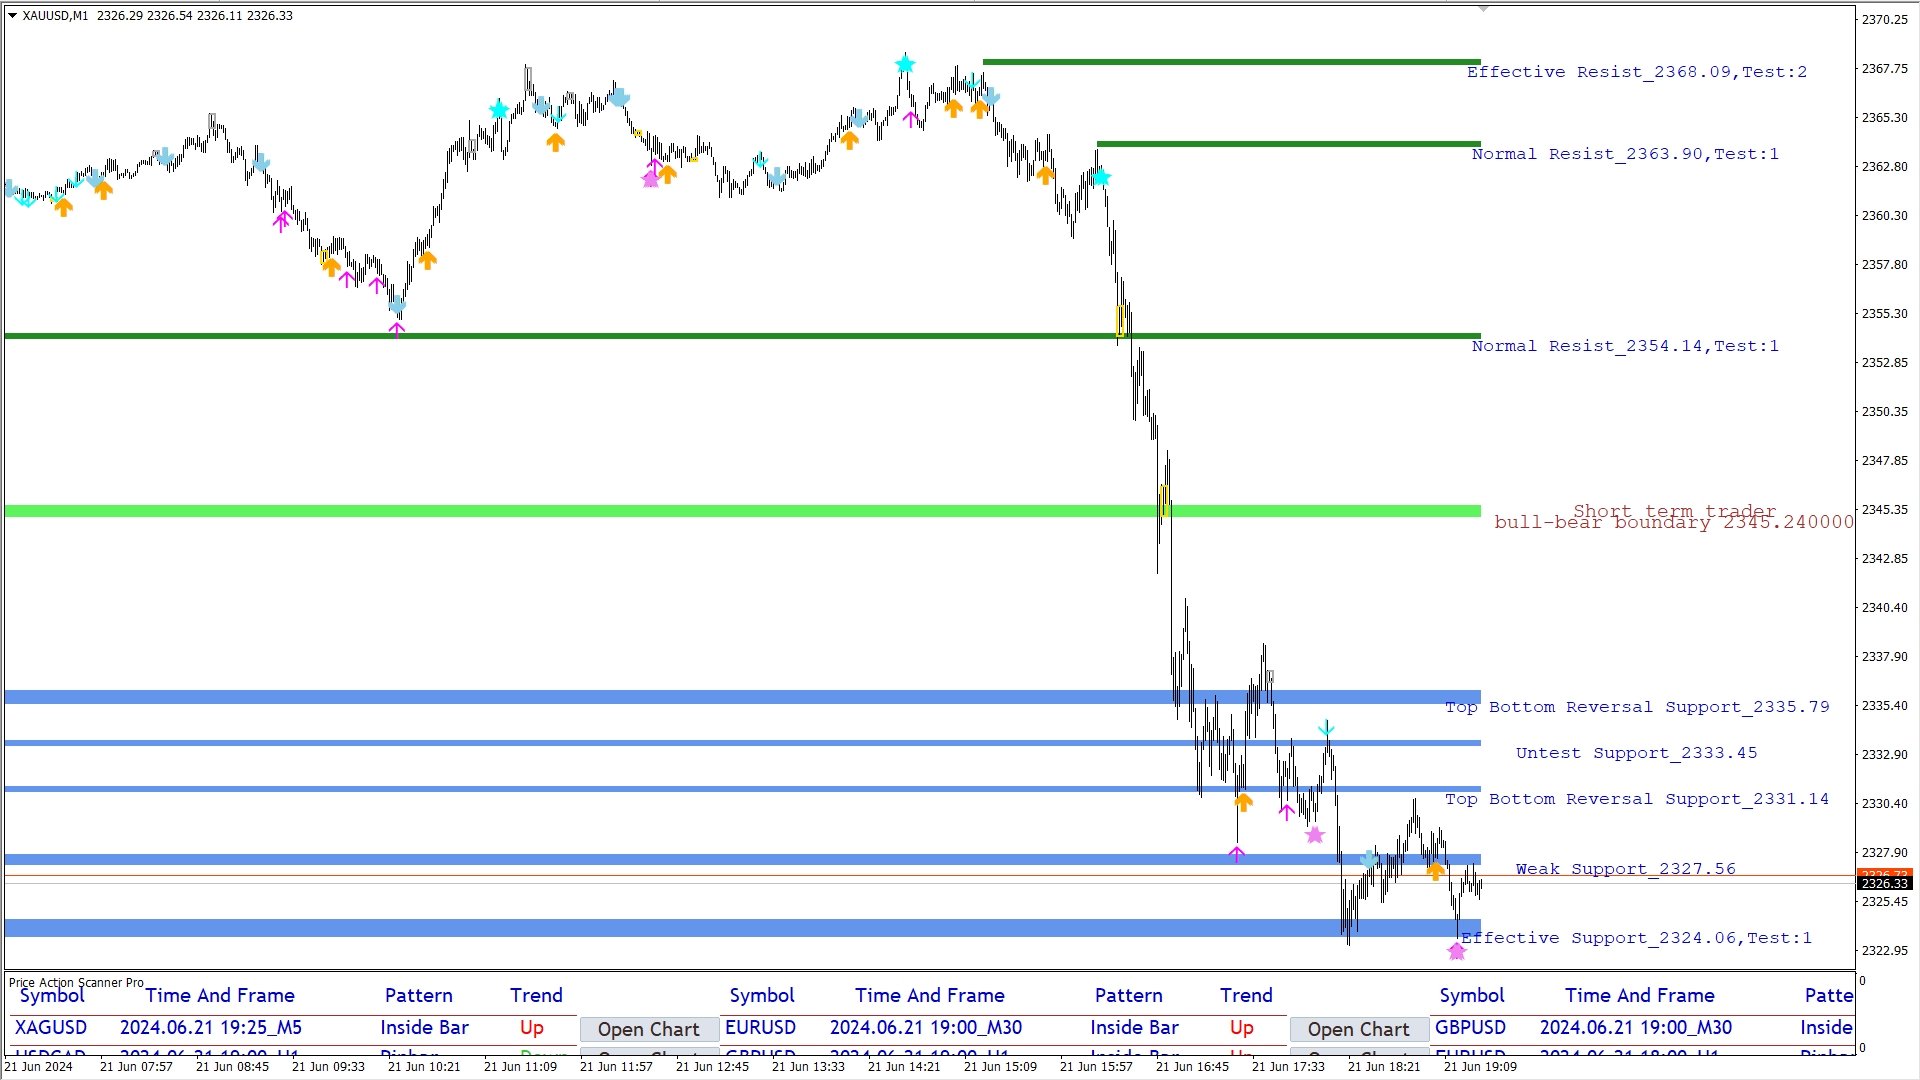
如果你是短线交易者 , 寻找短线交易机会 或者 剥头皮操作 , 喜欢依据1分钟K线或者5分钟K线的价格行为作为入场依据 , 选择 Short_term_trader ;
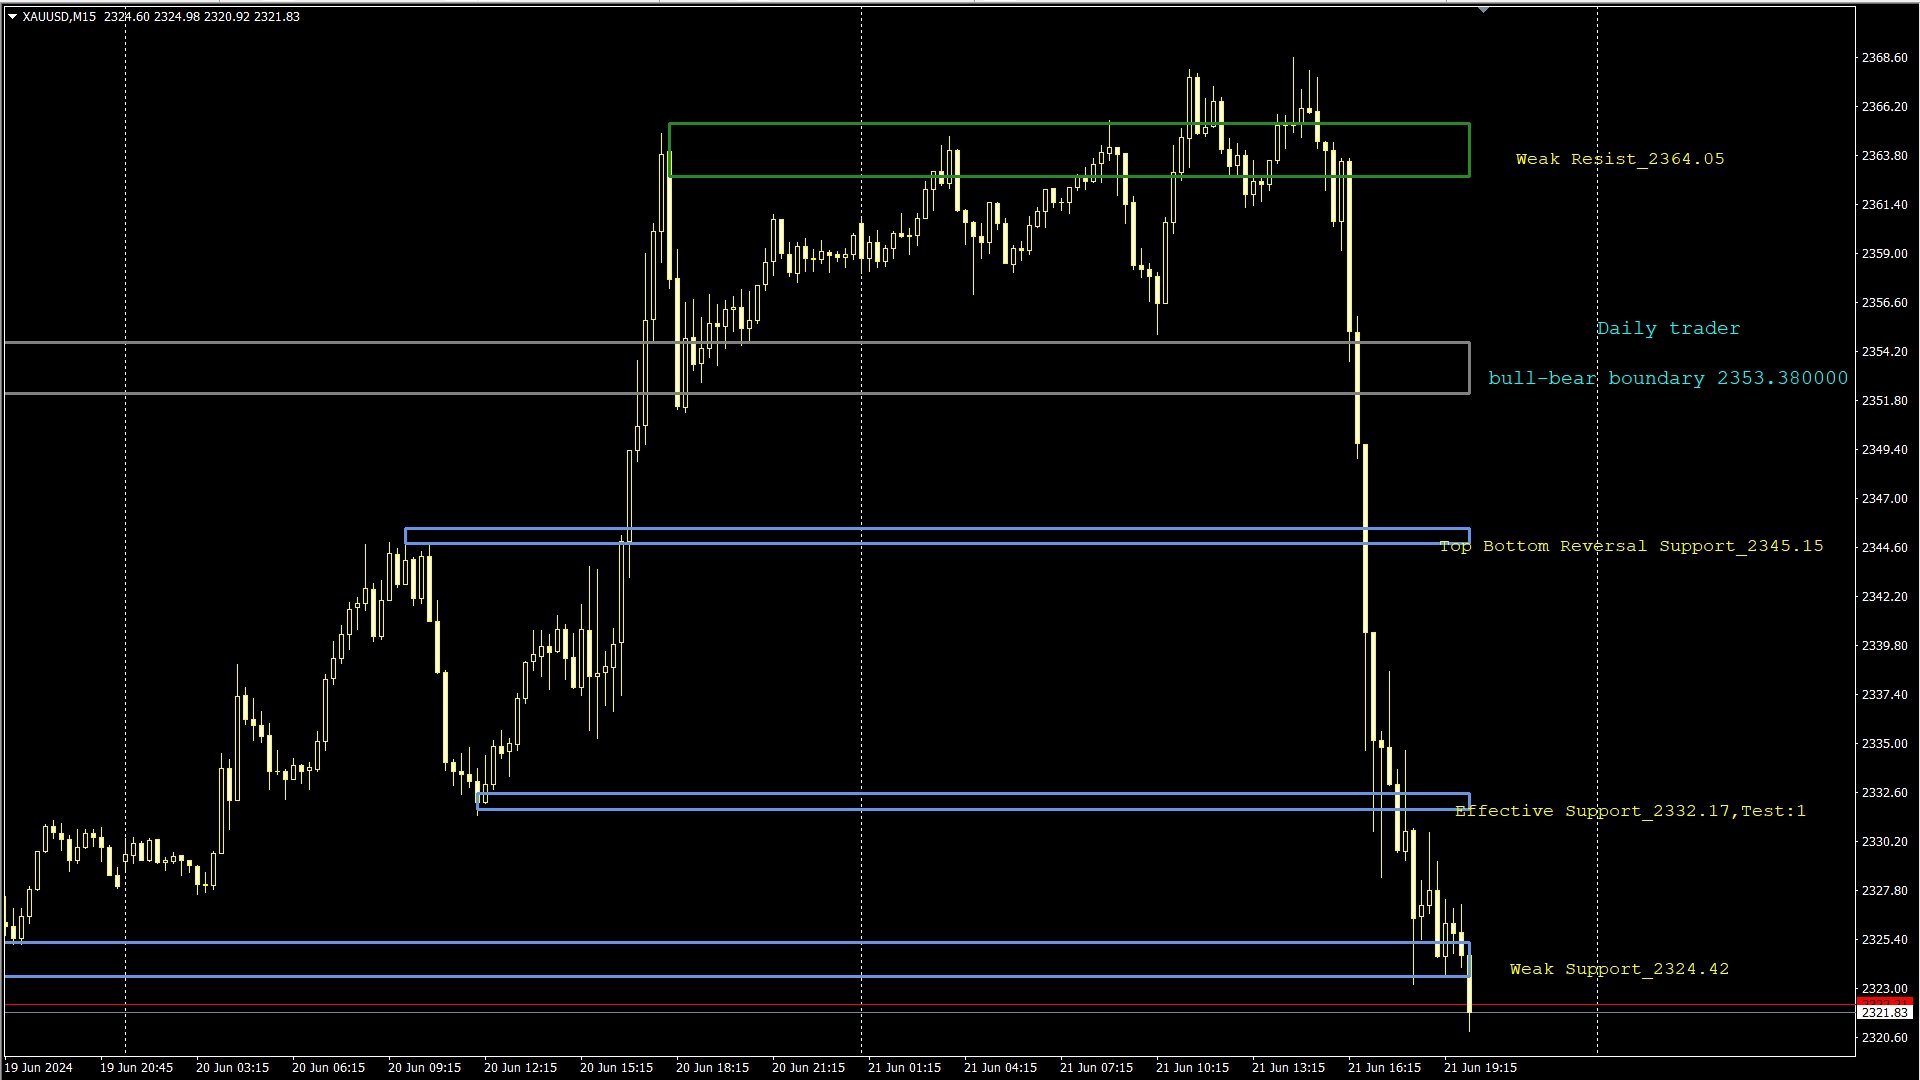
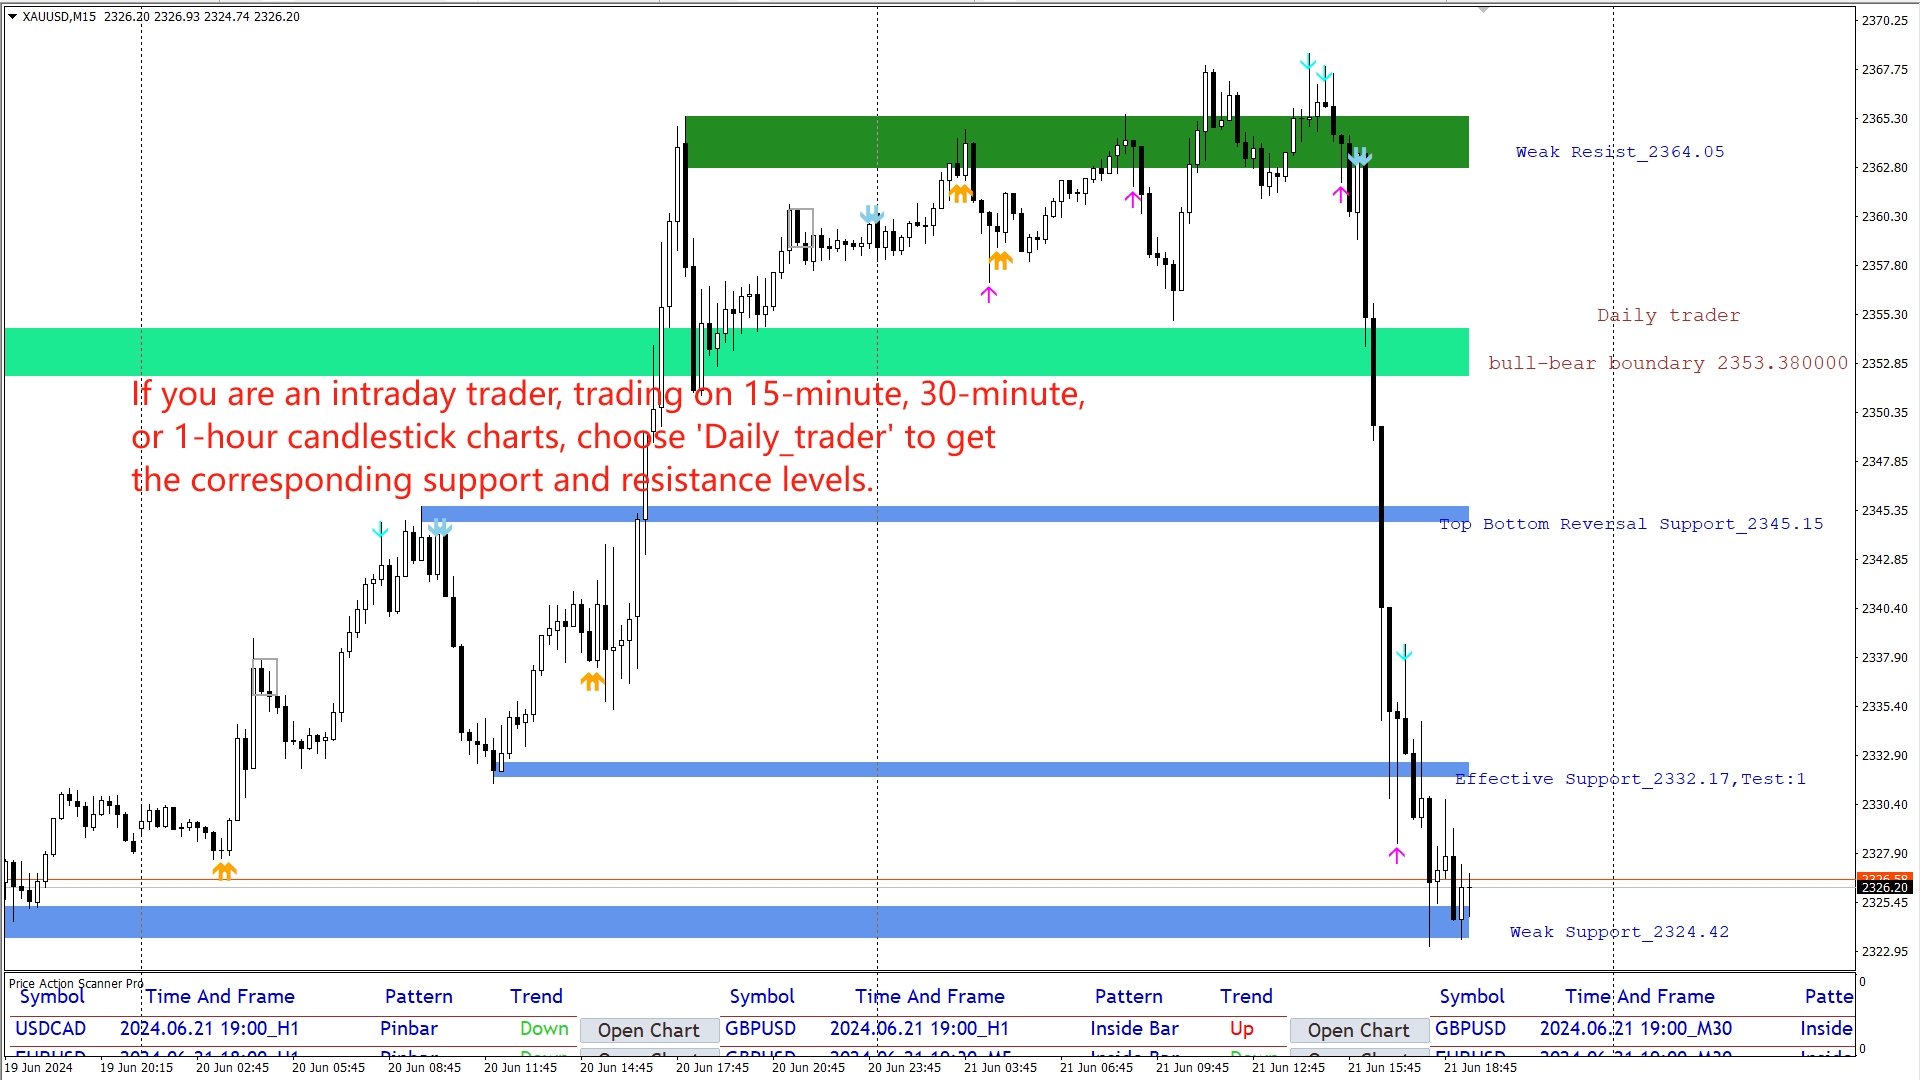
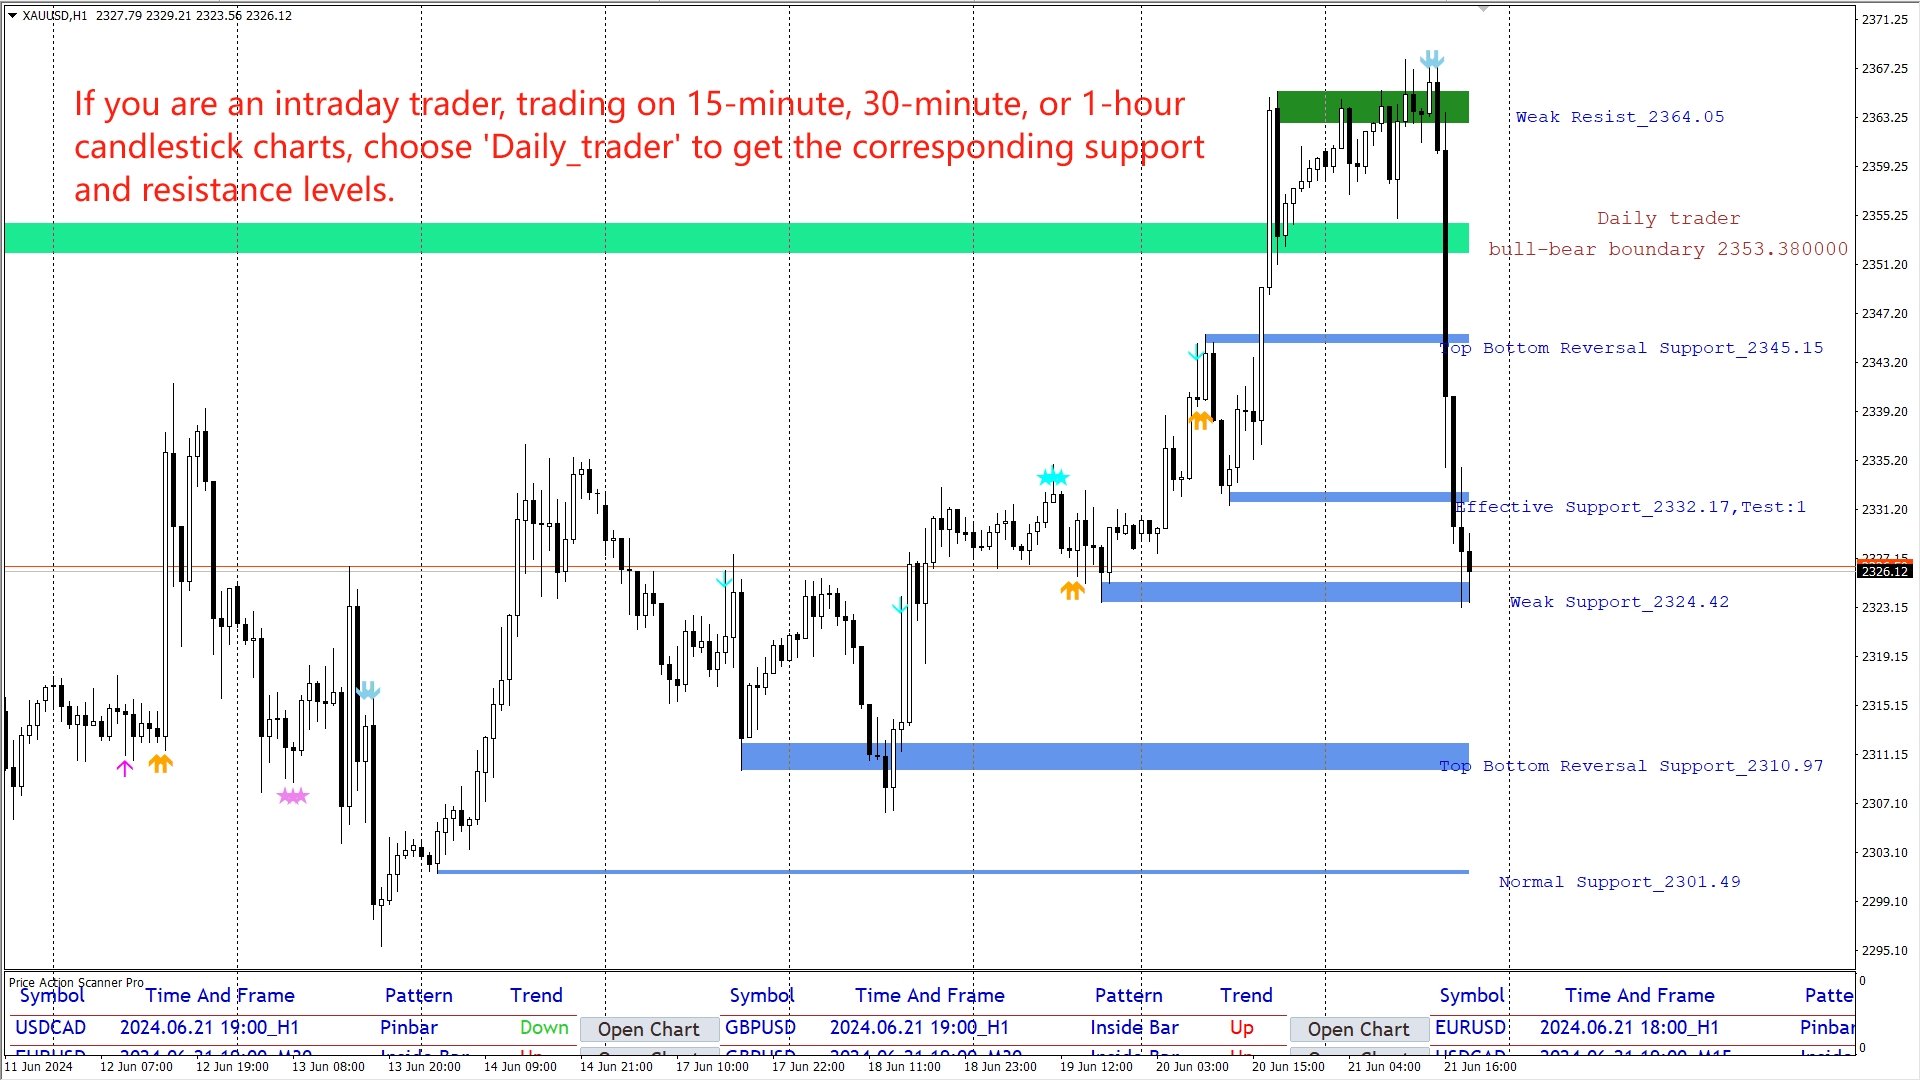
如果你是日内交易者 , 寻找日内的交易机会 , 每天开仓一两次 , 喜欢依据15分钟K线或者30分钟K线以及1小时K线的价格行为作为入场依据 , 选择 Daily_trader ;
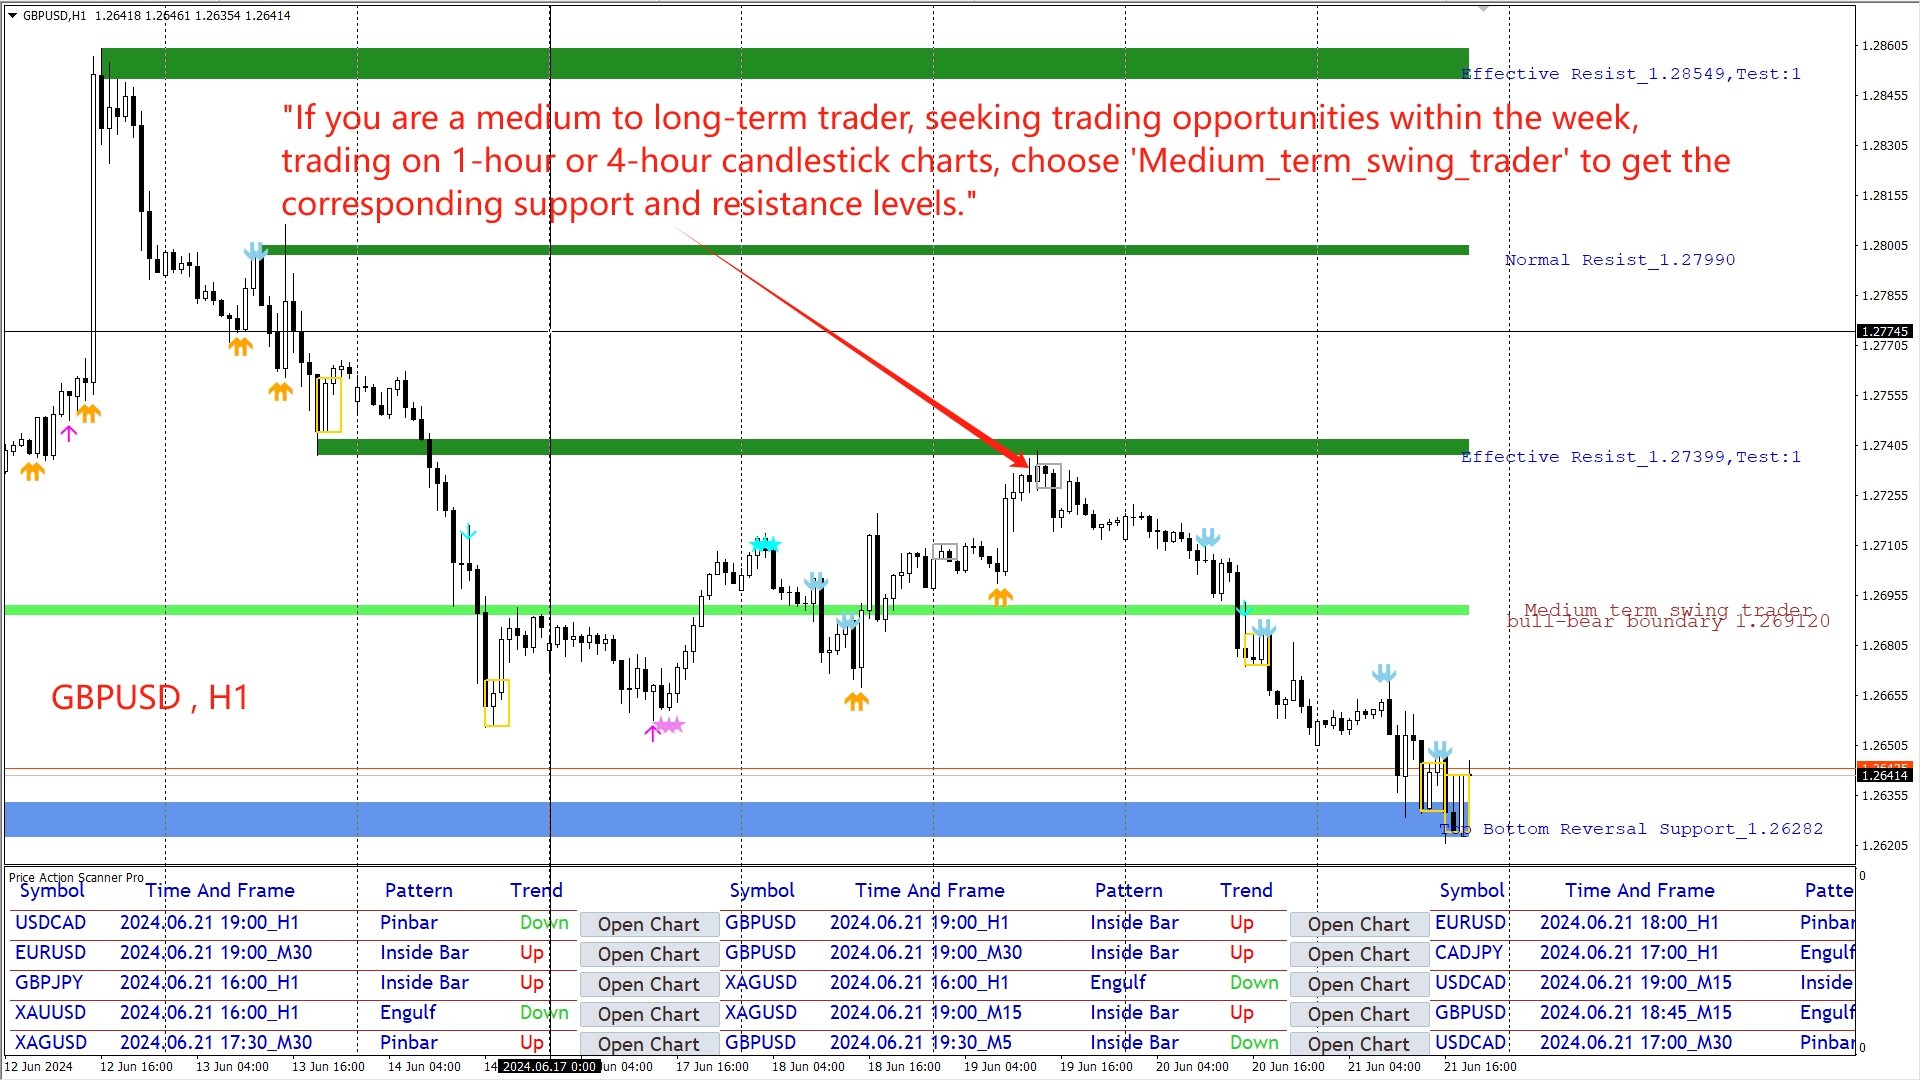
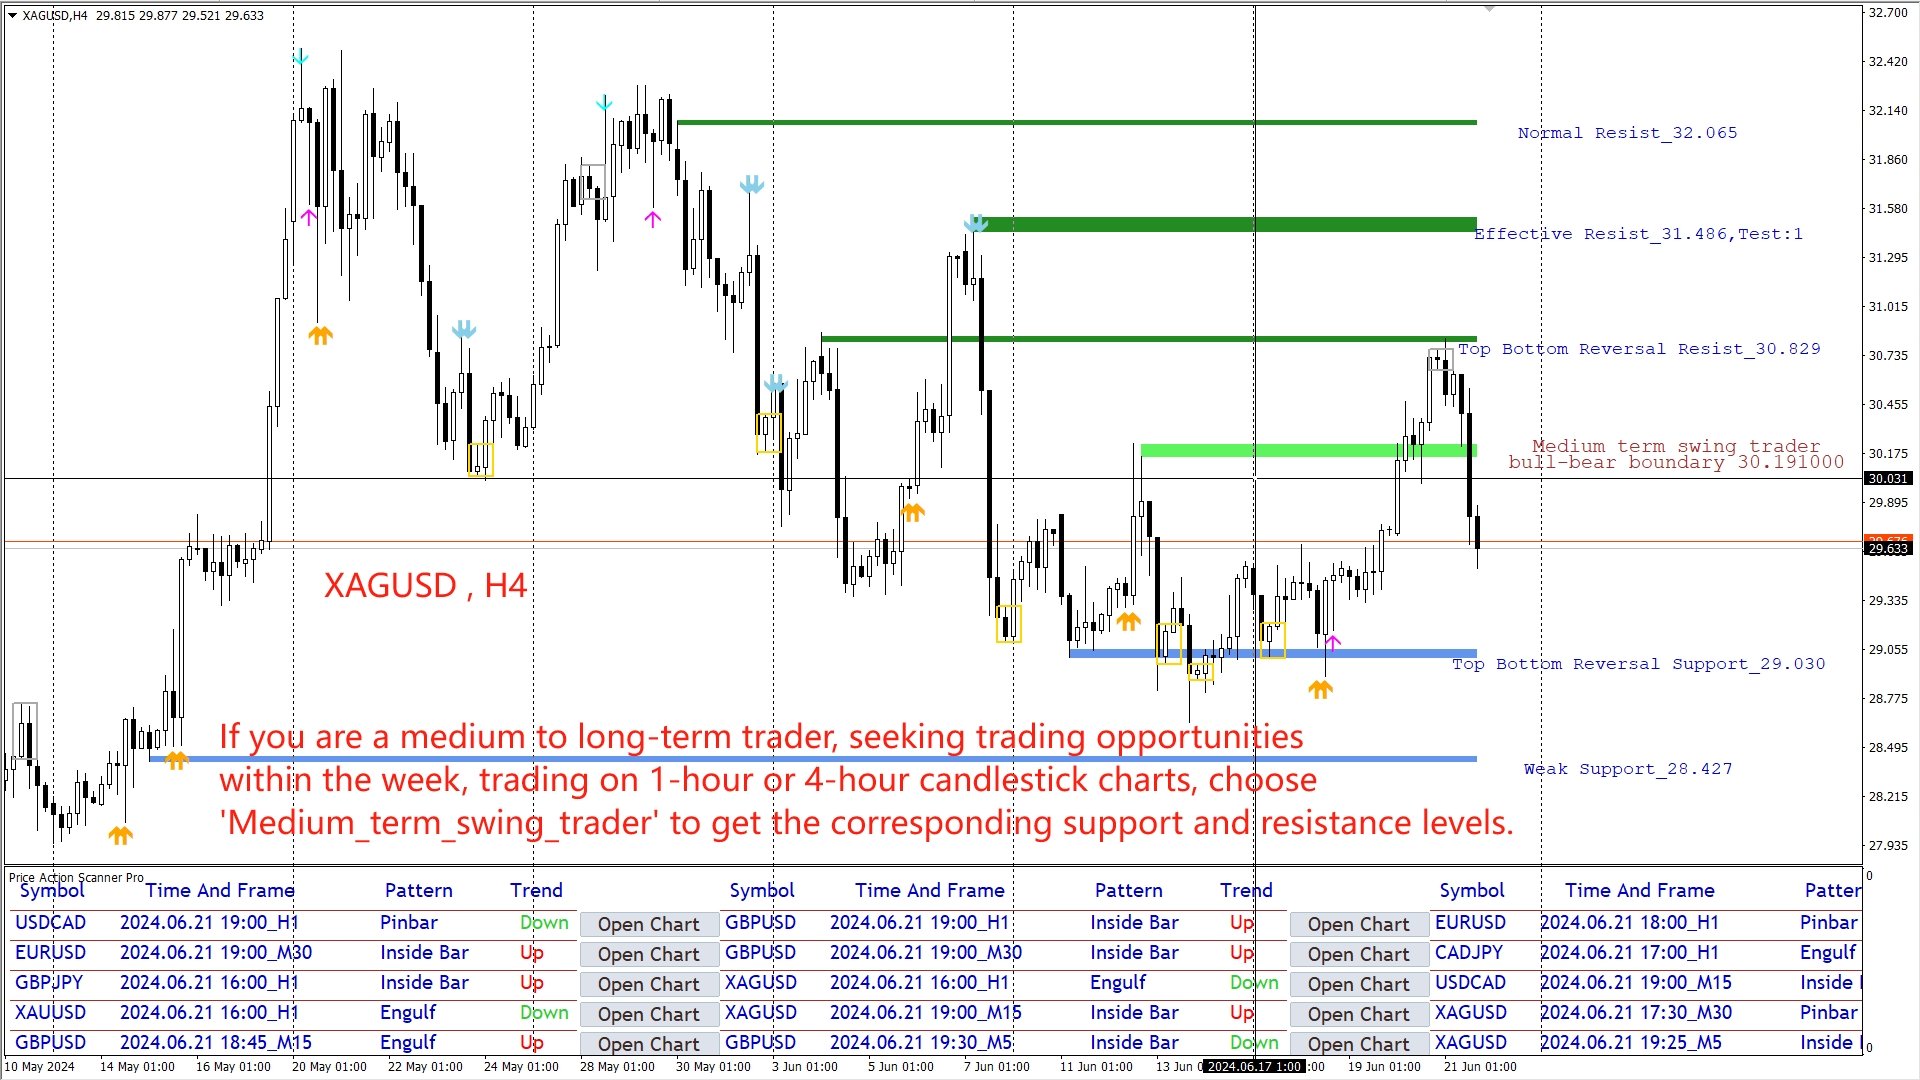
如果你是中长周期波动交易者 , 每周开仓一两次 , 喜欢依据1小时K线或者4小时K线的价格行为作为入场依据 , 选择 Medium_term_swing_trader ;
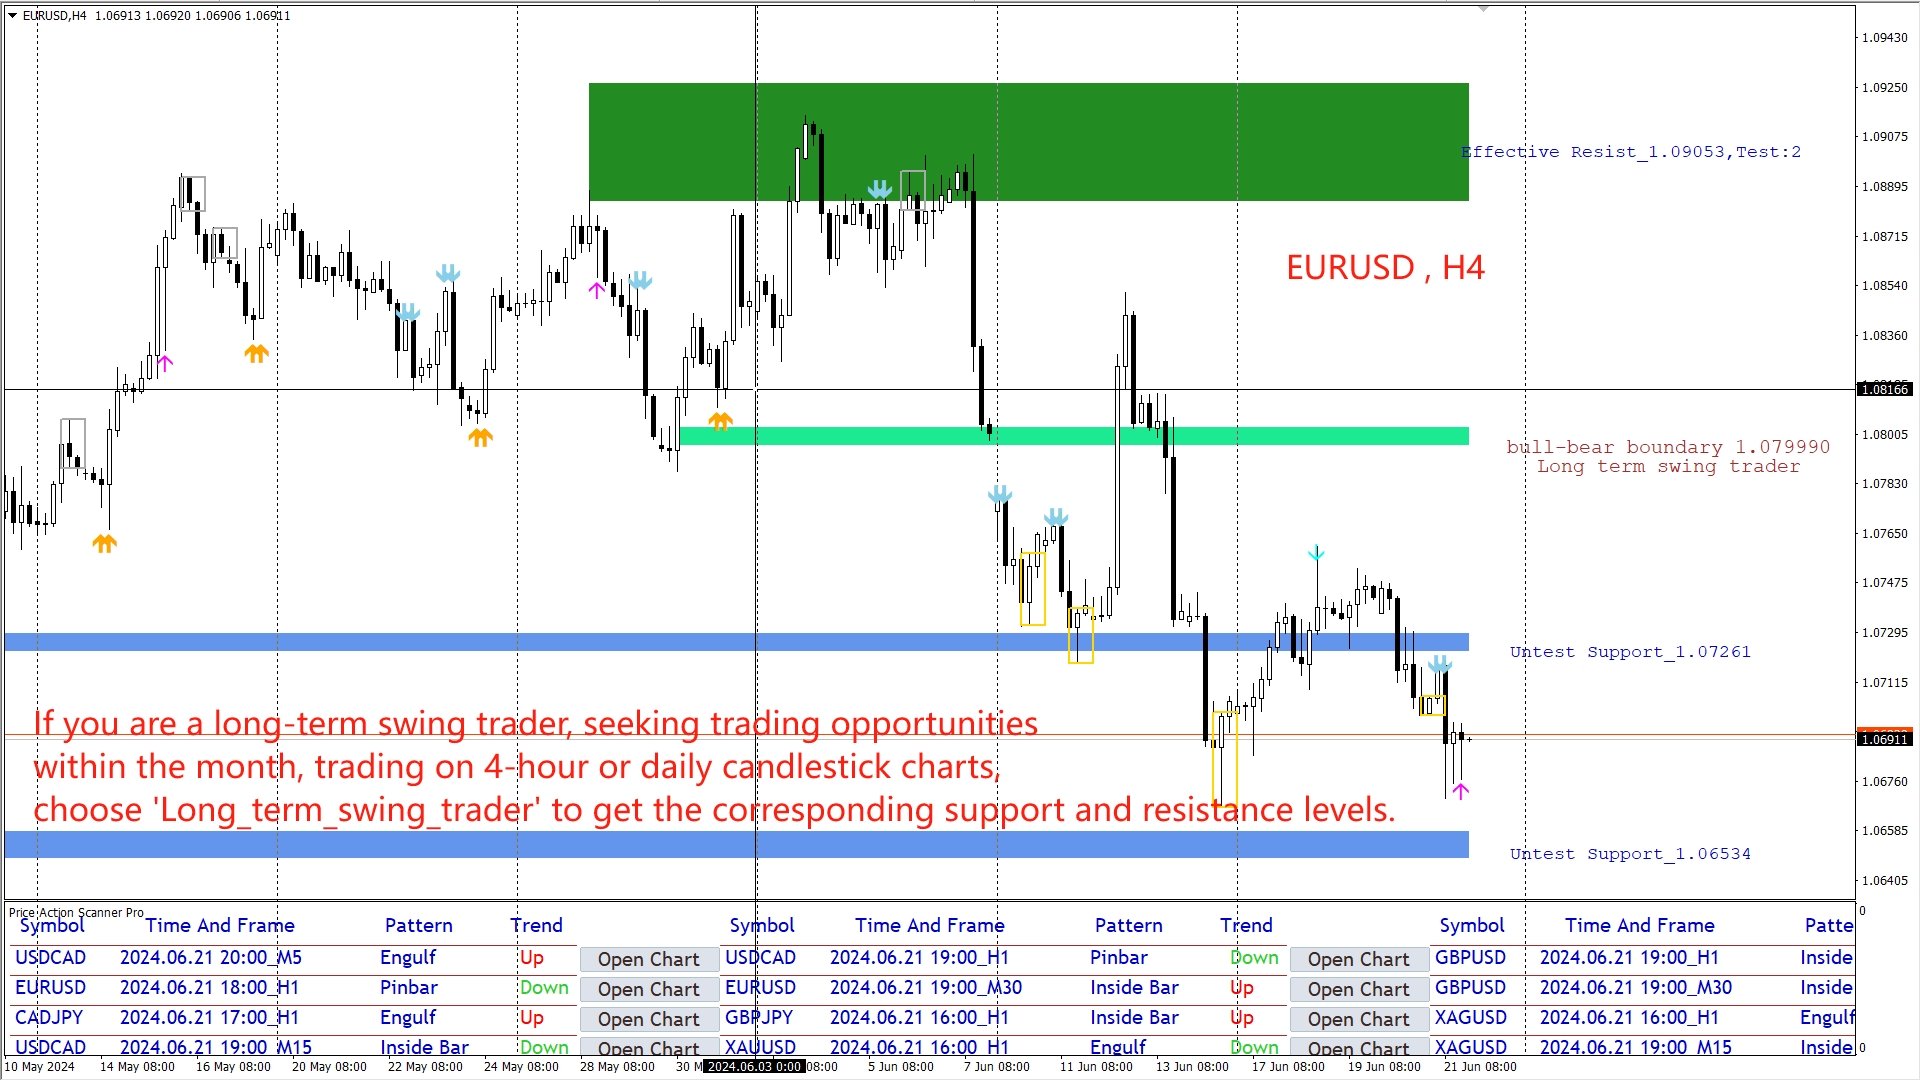
如果你是长周期波动交易者 , 每月开仓一两次 , 喜欢依据4小时K线或者日K线的价格行为作为入场依据 , 选择 Long_term_swing_trader ;