Visual Heatmap Book Analyzer
- 指标
- Alexandre Moraes De Souza Lima
- 版本: 1.0
- 激活: 5
Visual Heatmap Book Analyser
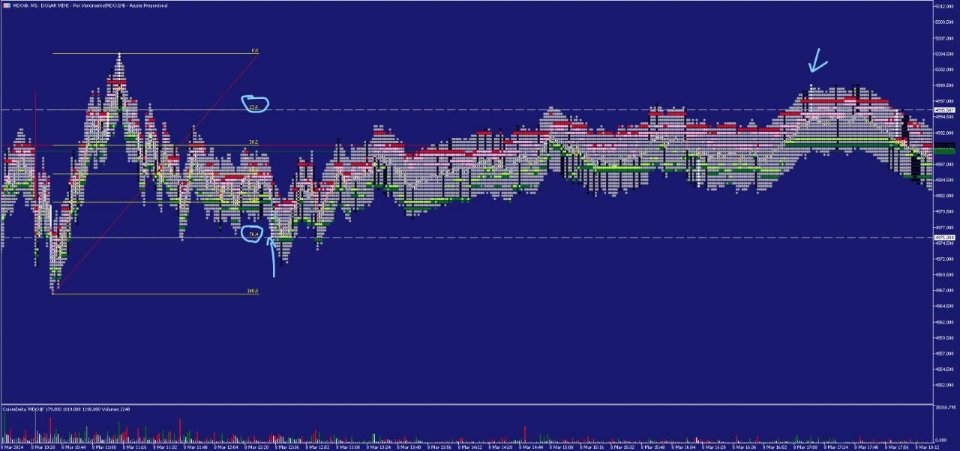
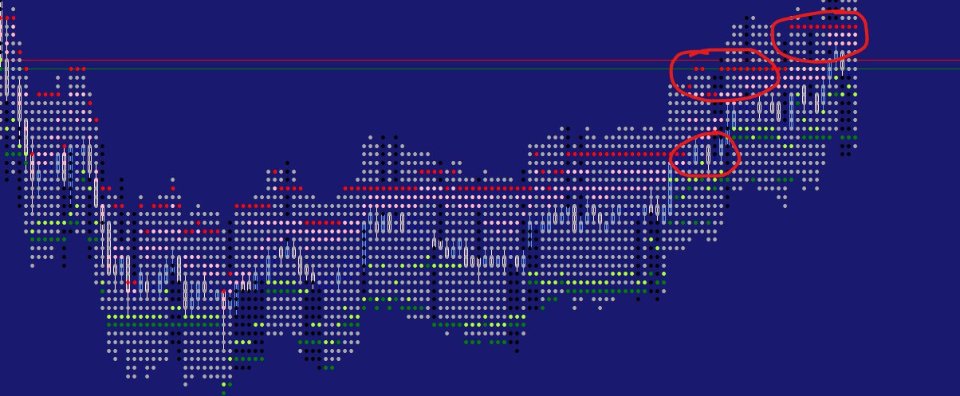
This indicator monitors the market liquidity and generates colors based on order patterns, quantities, and renewal activities in the book. This allows you to visualize the order flow and identify areas of high and low liquidity and activity.
The indicator uses machine learning techniques to analyze the order behavior in the book, enabling it to detect patterns and trends in orders, allowing you to make informed decisions about your trading operations.
The color palette of the indicator is generated from real-time market order flow. This enables you to quickly identify areas of high and low liquidity and activity, making data-driven decisions.
Identify Areas of High and Low Liquidity:
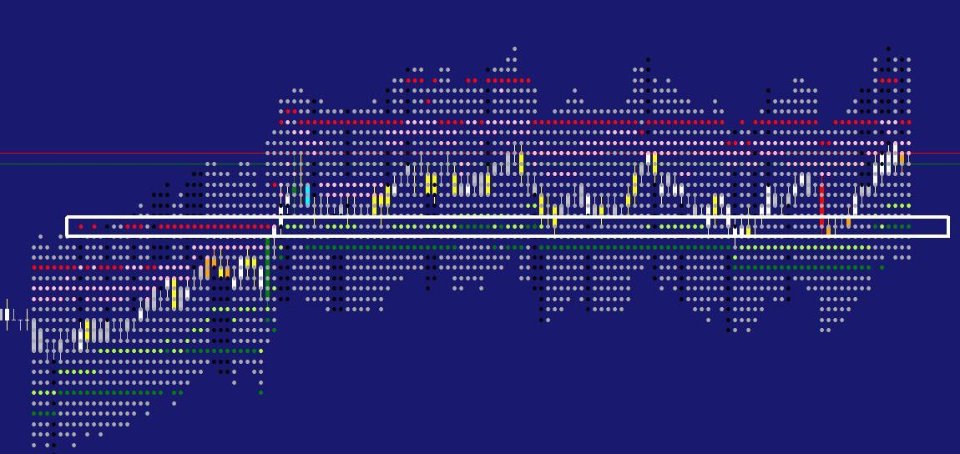
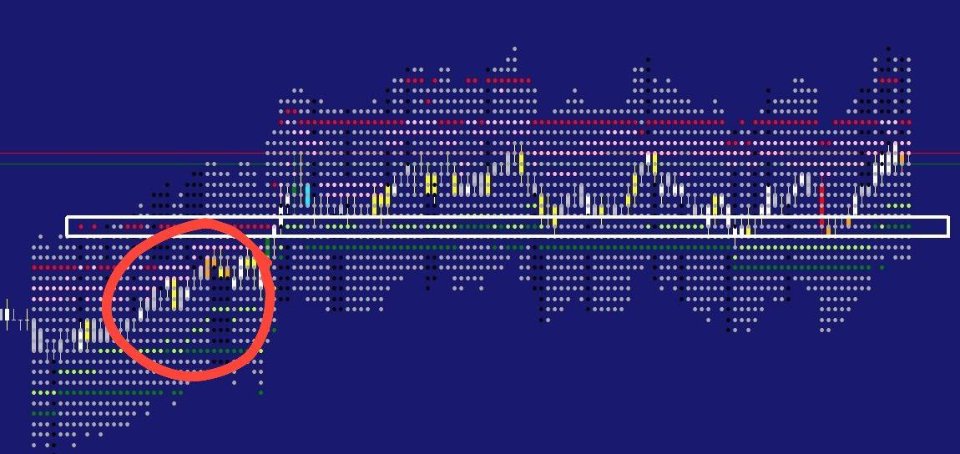
With this indicator, you can rapidly identify areas with high liquidity, where orders are easier to execute, and areas with low liquidity, where orders may be more challenging to realize.
Identify Areas of High and Low Activity:
The indicator also enables you to quickly identify areas with high activity, which may indicate some type of dispute between market players, making it a prime candidate for testing.
Make Data-Driven Decisions:
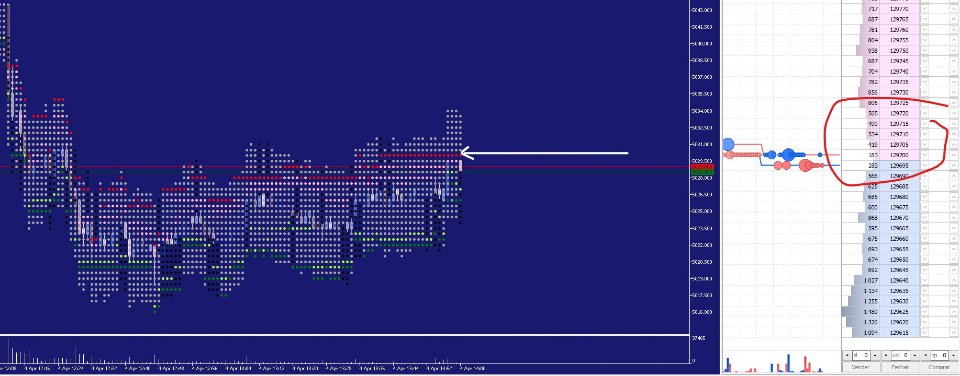
The indicator provides precise information about the order flow in the market, enabling you to make informed decisions about your trading operations.
Stay Ahead of the Game:
With this indicator, you can monitor the market liquidity in real-time and react quickly to changes in patterns of liquidity.
Color Correlation:
Here's the correlation between colors and market liquidity and activity:
- White: Maximum liquidity, many orders in the book.
- Light Gray: High liquidity, large number of orders in the book.
- Dark Gray: Medium liquidity, reasonable number of orders in the book.
- Gray: Low liquidity, few orders in the book.
- Black: Minimum liquidity, only one or a few orders in the book.
- Red: High demand for an asset, indicating low liquidity.
- Green: High supply for an asset, indicating high liquidity.
- Light Yellow: Minimum liquidity and many orders in the book.
- Yellow: Medium liquidity and moderate number of orders in the book.
- Pink: Low liquidity and few orders in the book.
- Light Pink: Maximum liquidity and many orders in the book.
- Green-Yellow: Medium liquidity and reasonable number of orders in the book.
See the real market structure, predict your trades with information on what may happen, not based on what has already happened.
IMPORTANT: for the correct functioning of the indicator it is MANDATORY to have access to the depth of the market.
Test demo account
Discussão sobre o indicador

