Multi timeframe moving average DEMA by William210
- 指标
- Gerard Willia G J B M Dinh Sy
- 版本: 1.1
- 激活: 5
===>此指标有什么作用?
像我的许多代码一样,它是多个时间范围的。
例如,它们允许您在 H1 中显示每日的情节。
使用 William210 搜索我的所有代码(代码库和市场)
它根据时间范围的选择绘制单个 DEMA 平均值。
DEMA(双指数移动平均线)是一种加权移动平均线,结合了两个单指数平均线(EMA),以进一步平滑数据并减少滞后。
您可以根据需要多次将该指标放在图表上进行平均。
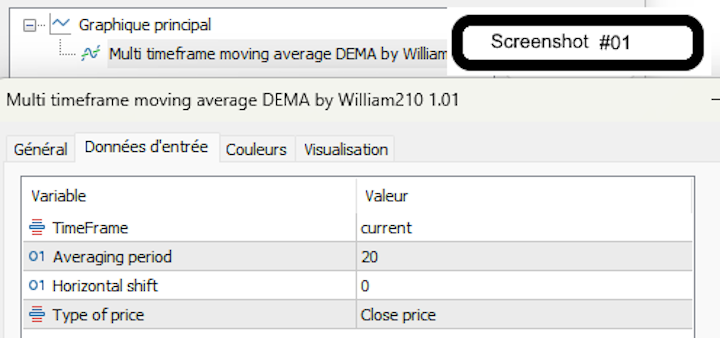
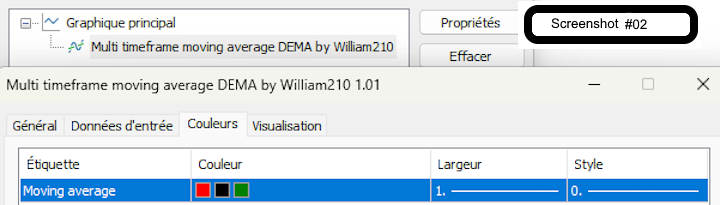
选择平均值的参数和特征,就是这样!
****请参阅屏幕截图01至02
请不要犹豫,要求我提供ICUSTOM代码,以轻松将此平均值集成到您自己的代码,另一个指标或EA中
选择
目标时间范围
期间数
滞后
所需的OHLC
时尚颜色
您可以在代码库和现在以“ William210”的名义找到我的所有出版物。
===>一些示例
这里有一些简单的示例,可以使用多个时间范围的移动平均
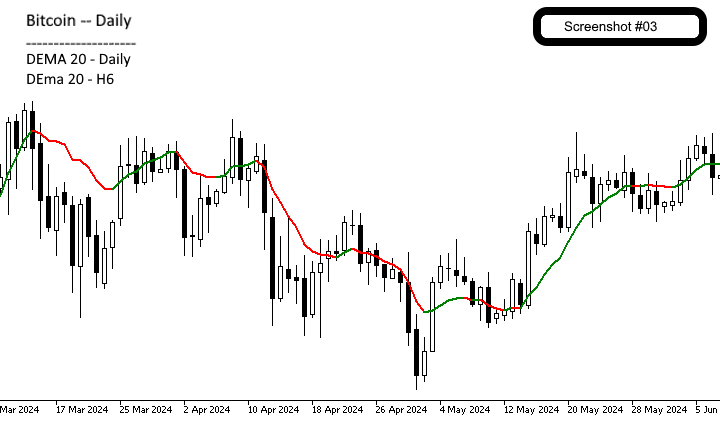
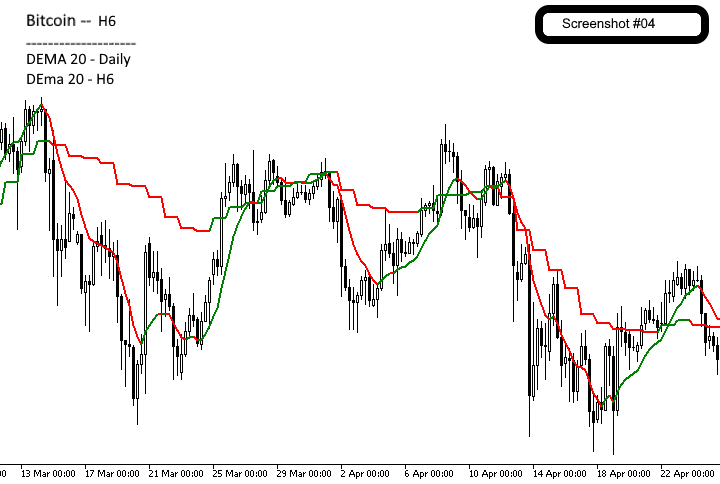
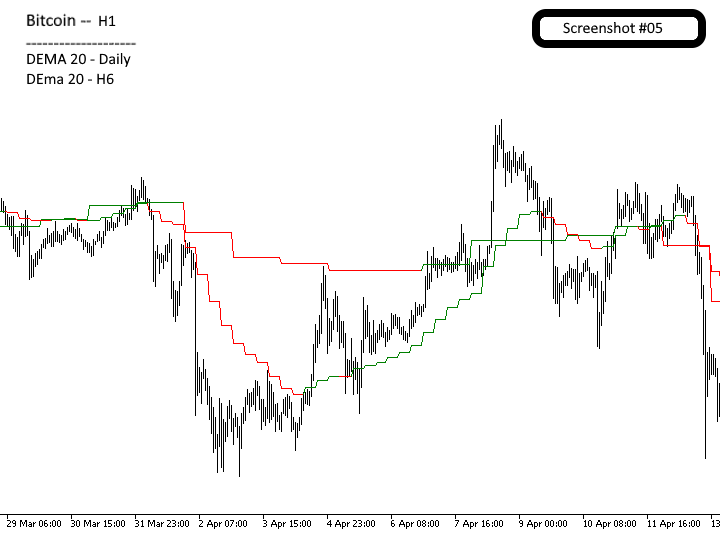
比特币上的示例
添加2个移动平均值20,每天在时间范围内,在H6上添加1个,然后在H1中查看
****请参阅3到5的屏幕截图
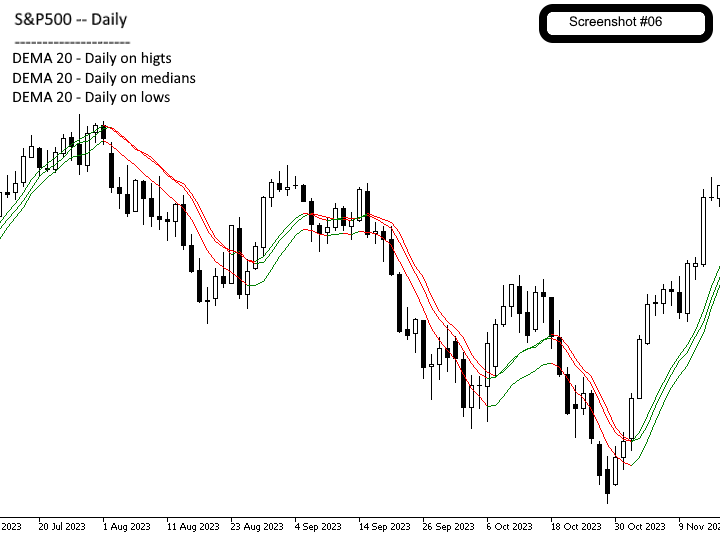
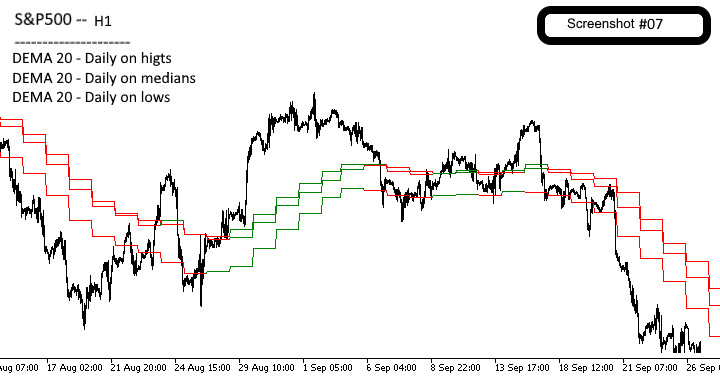
S&P500的示例
在每日添加3个移动平均时间为20个时期
****请参阅6到7的屏幕截图
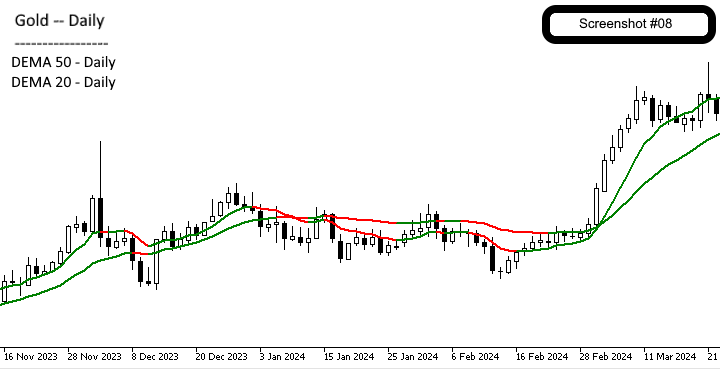
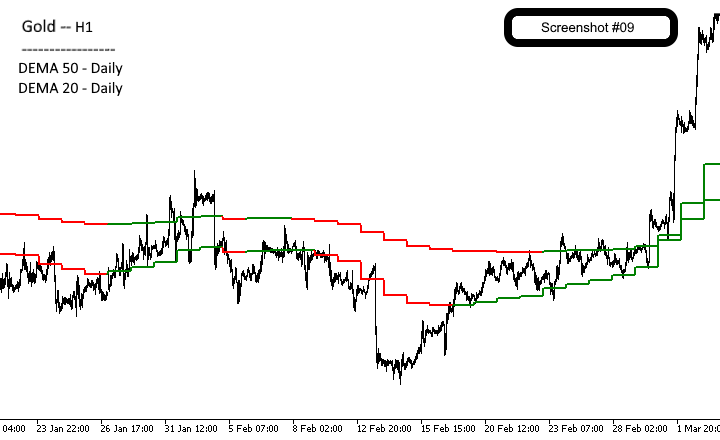
黄金的例子
每天在每天添加2个移动平均值50和20个时期,然后查看H1
****请参阅8到9的屏幕截图
你的
分享您的使用设置,并找出其他交易者如何使用此指标来优化其策略!
===>为谁?
无论您是酌情交易者,算法交易者还是开发人员,该指标都旨在满足您的需求。我了解金钱受到威胁时的可靠性和效率的重要性,我非常重视这一责任。
该指标在您的PC或VPS上消耗了很少的资源。对于算法交易者和开发人员,我为两个缓冲区提供了完全访问:平均值的缓冲区1和平均方向的缓冲区2。
===>为什么?
移动平均值已经使用了很长时间了。他们主要用于定义趋势和范围。
对于您的顾问(EA)专家,您的指标,或者您可以更轻松,更开明的决定。
===>应用的开发规则
命名变量=>所有变量均以连贯和描述的方式命名,从而促进了对代码的理解和维护。
全局变量的最小使用=>很少使用全局变量。
低内存消耗=>该指示器的设计量很少,可以保证最佳性能。
变量的初始化=>所有变量都是初始化的,这可以最大程度地减少意外行为并增强代码的稳定性。
环路的优化=>所有回路均已优化以确保有效的途径,从而提高了计算速度。
环路数量的限制=>:通过组合多种处理方法可以减少环数。
错误管理=>所有反馈都经过精心检测和处理任何错误,从而确保了最大的可靠性。
logs =>一个过程的限制限制了重复消息的写入,从而避免了报纸的过载并促进调试。
===>强大的代码
具有永久性的强大代码至关重要。如果发生问题,则提供明确的错误消息。尽管有这些系统的控制,但由于数据路径的优化,该指标仍保持迅速。
===>如何完成?
不是基于本机IMA函数():指示器是独立于本机IMA()函数构建的。
应用便便的原理:尽管不用便便编写,但面向对象的编程原理被应用于函数的功能。
在市场外运行:它甚至可以在市场之外的符号上工作。一键单击另一个时间范围,对于显示屏的茶点可能是必需的。
部门管理:如果发生Internet剪切或服务器问题,则指示器指示它,为所有历史记录充电并重做所有计算。
反应性:非常反应性,没有重新绘制,指示器已更新为最近的刻度,对于加密货币或非常挥发性的符号至关重要。