SuperTrend MTF
- 指标
- Yu Fan Zhang
- 版本: 1.0
- 激活: 10
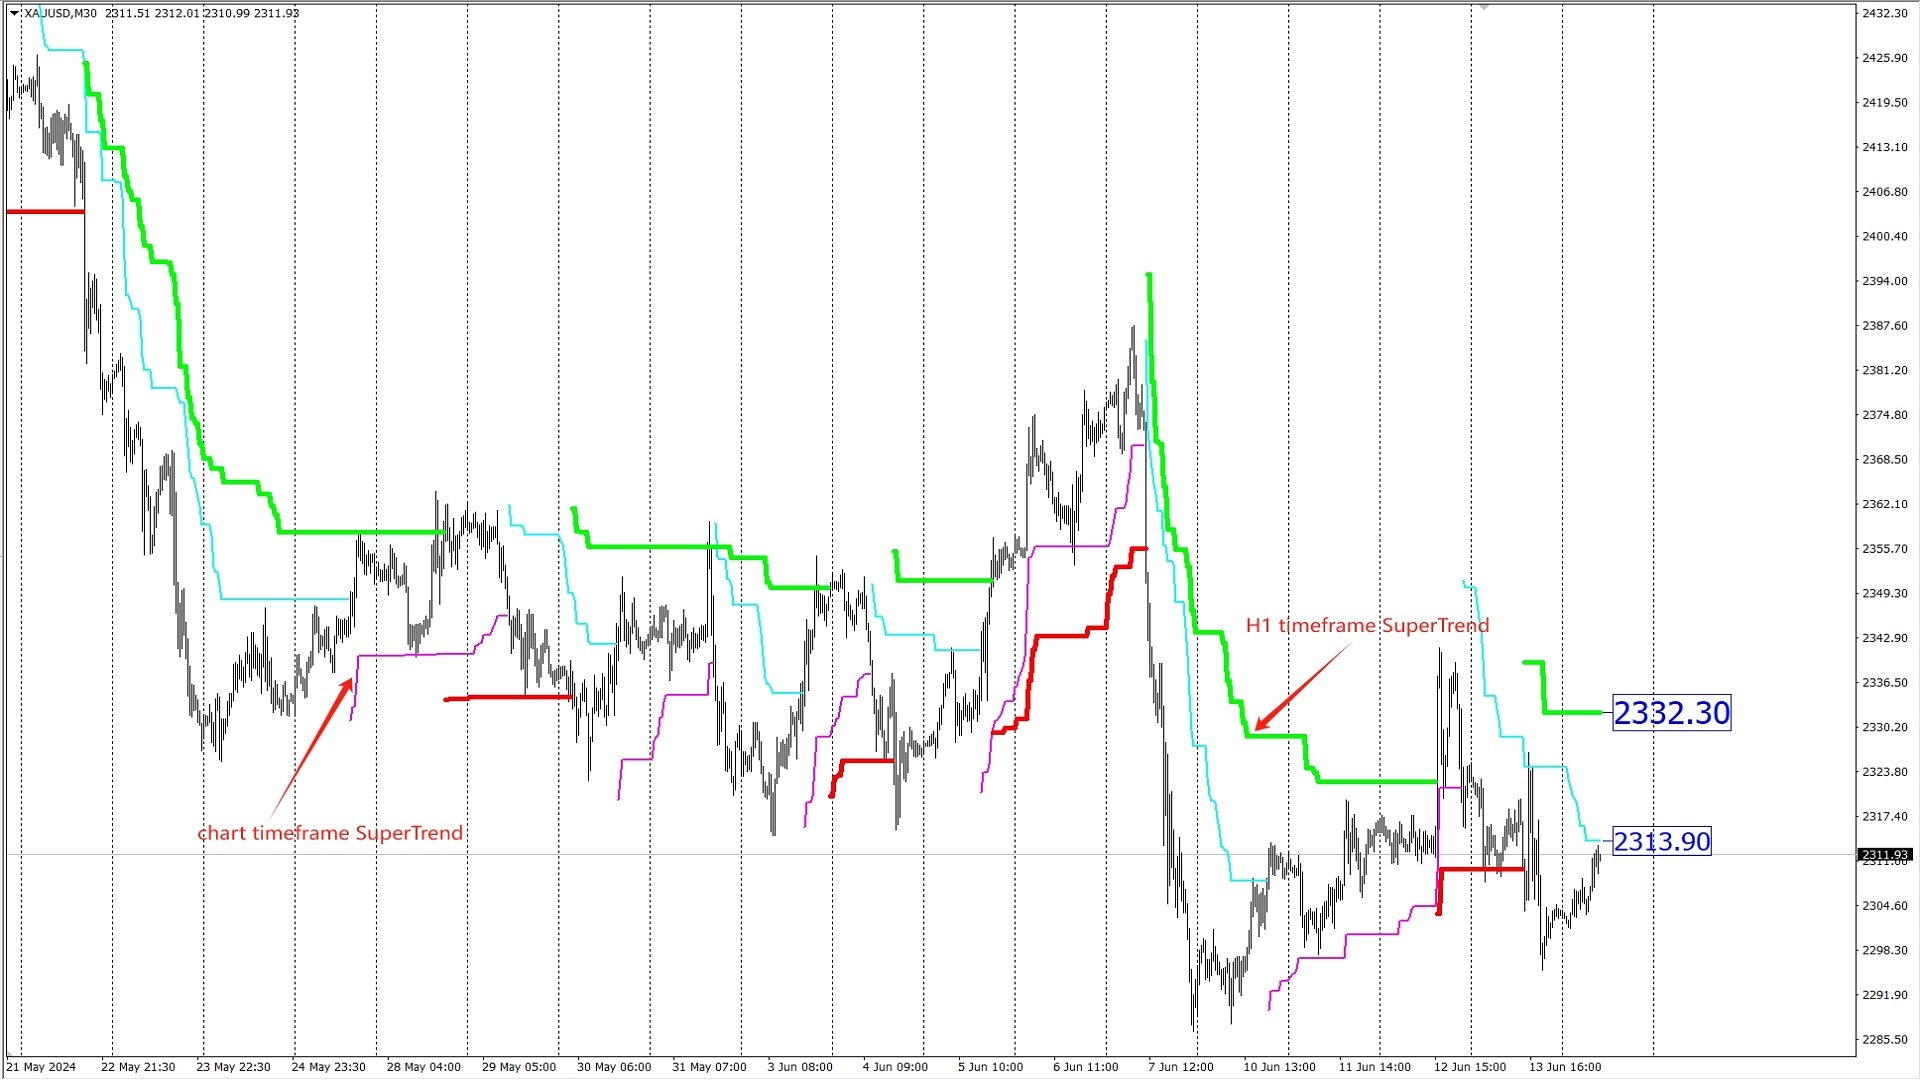
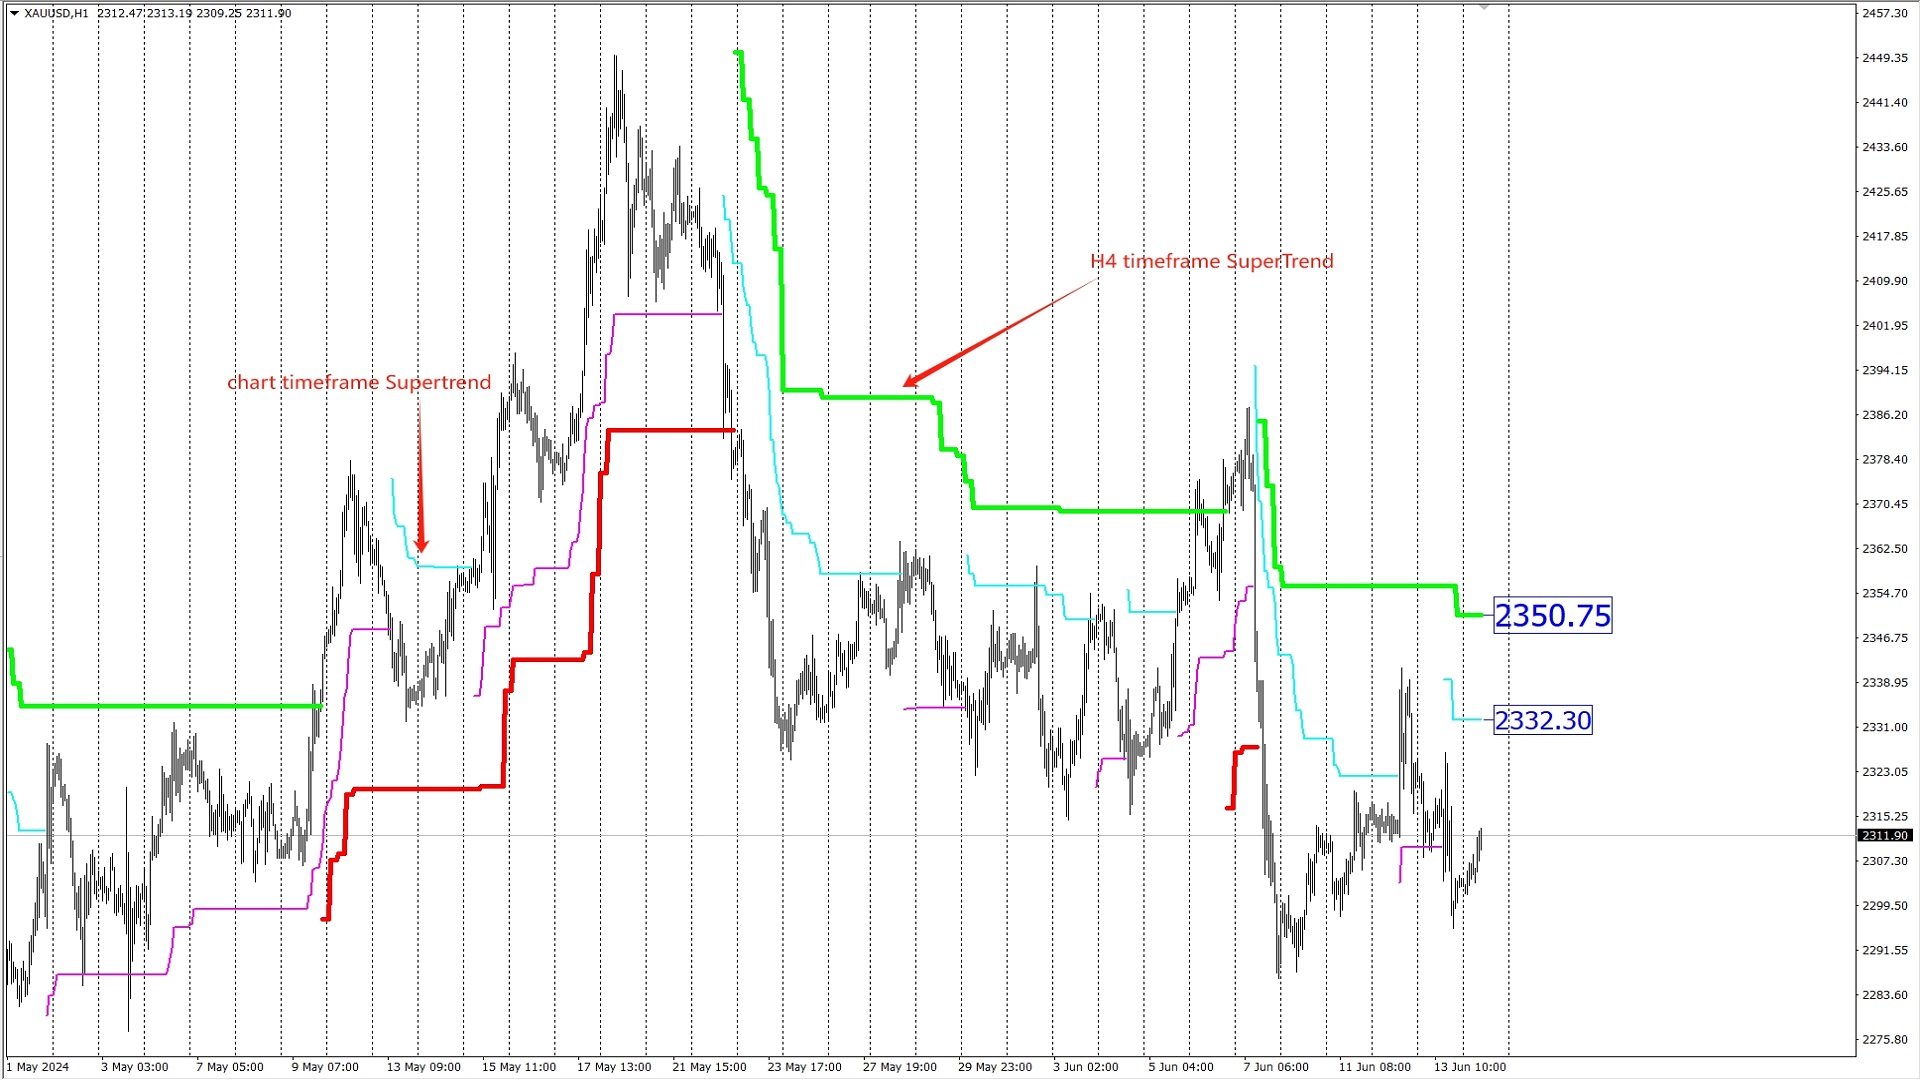
SpuerTrend MTF 指标 , 是一款出色的趋势跟踪指标 . 它不光能显示图表的时间框架下的 SuperTrend 趋势 , 还可以设置同时显示更大时间框架的 SuperTrend 趋势 . 这将有利于把握更大时间级别的趋势 , 判断未来的趋势 . 同时 , 还可以显示趋势线的价格 , 一目了然 , 便于观察 .
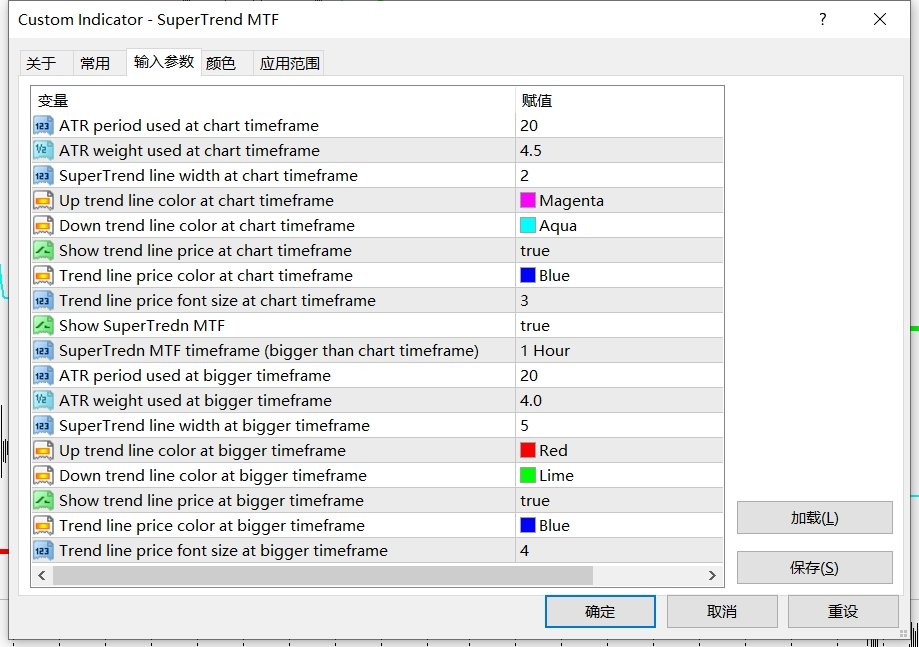
输入参数 :
ATR period used at chart timeframe : 当前时间框架下的 ATR 周期
ATR weight used at chart timeframe : 当前时间框架下的 ATR 权重
SuperTrend line width at chart timeframe : 当前时间框架下的趋势线的宽度
Up trend line color at chart timeframe : 当前时间框架下的上升趋势线的颜色
Down trend line color at chart timeframe : 当前时间框架下的下降趋势线的颜色
Show trend line price at chart timeframe : 是否显示当前时间框架下趋势线的价格
Trend line price color at chart timeframe : 当前时间框架下趋势线的价格的颜色
Trend line price font size at chart timeframe : 当前时间框架下趋势线的价格的字体大小
Show SuperTredn MTF : 是否显示更大时间级别的 SuperTrend
SuperTredn MTF timeframe (bigger than chart timeframe) : 更大时间级别的 SuperTrend 的时间框架 (若设置的 MTF timeframe 小于等于图表的 timeframe , 则会自动的显示出大于图表timeframe的SuperTrend MTF)
ATR period used at bigger timeframe : 更大时间框架下的 ATR 周期
ATR weight used at bigger timeframe : 更大时间框架下的 ATR 权重
SuperTrend line width at bigger timeframe : 更大时间框架下的趋势线的宽度
Up trend line color at bigger timeframe : 更大时间框架下的上升趋势线的颜色
Down trend line color at bigger timeframe : 更大时间框架下的下降趋势线的颜色
Show trend line price at bigger timeframe : 是否显示更大时间框架下趋势线的价格
Trend line price color at bigger timeframe : 更大时间框架下趋势线的价格的颜色
Trend line price font size at bigger timeframe : 更大时间框架下趋势线的价格的字体大小