Buy Sell signal M15
- 指标
- Teofil Creanga
- 版本: 1.0
- 激活: 5
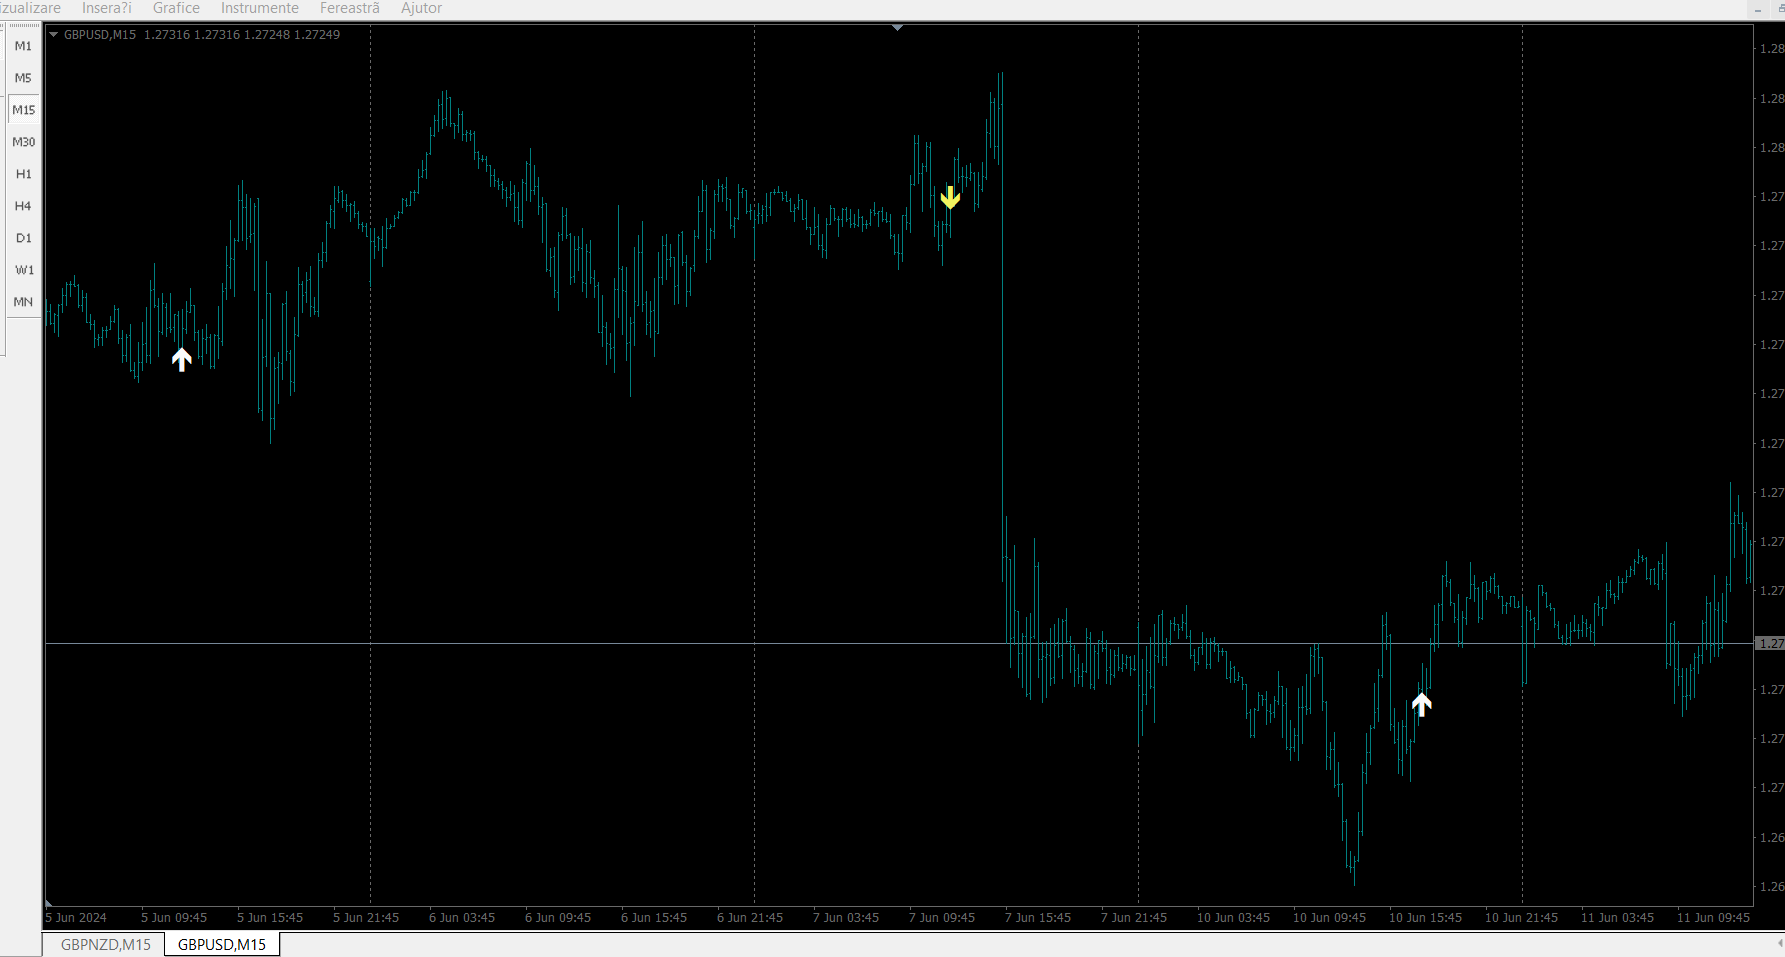
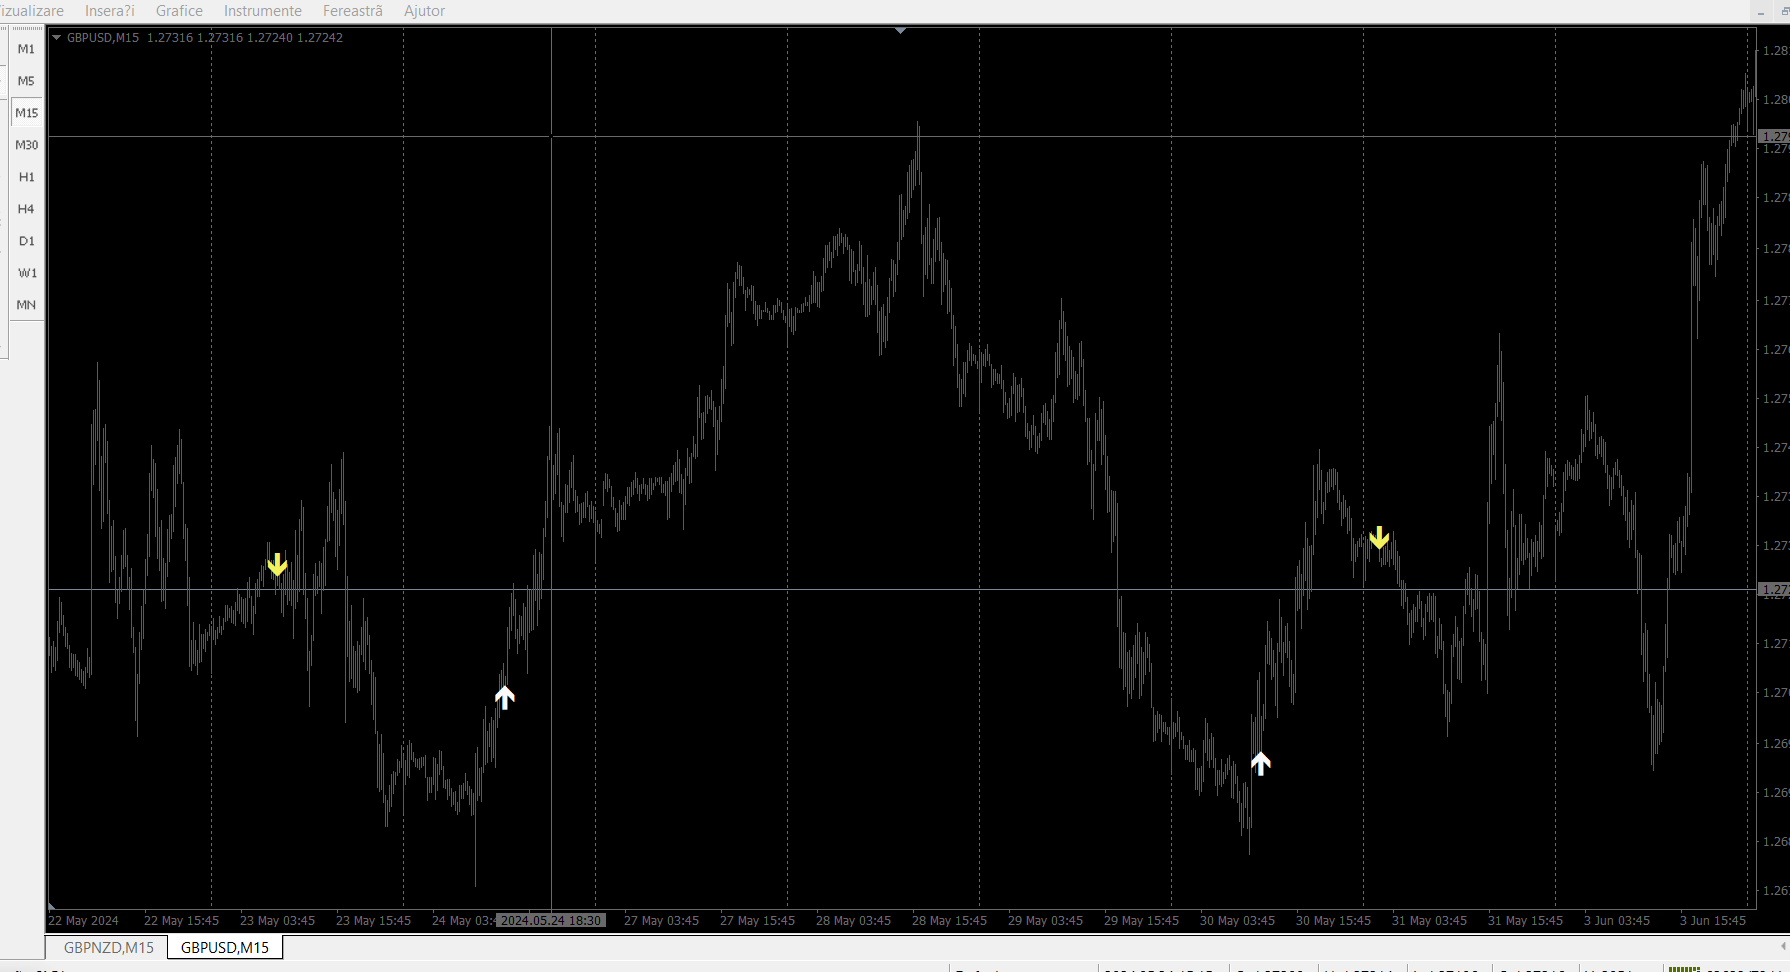
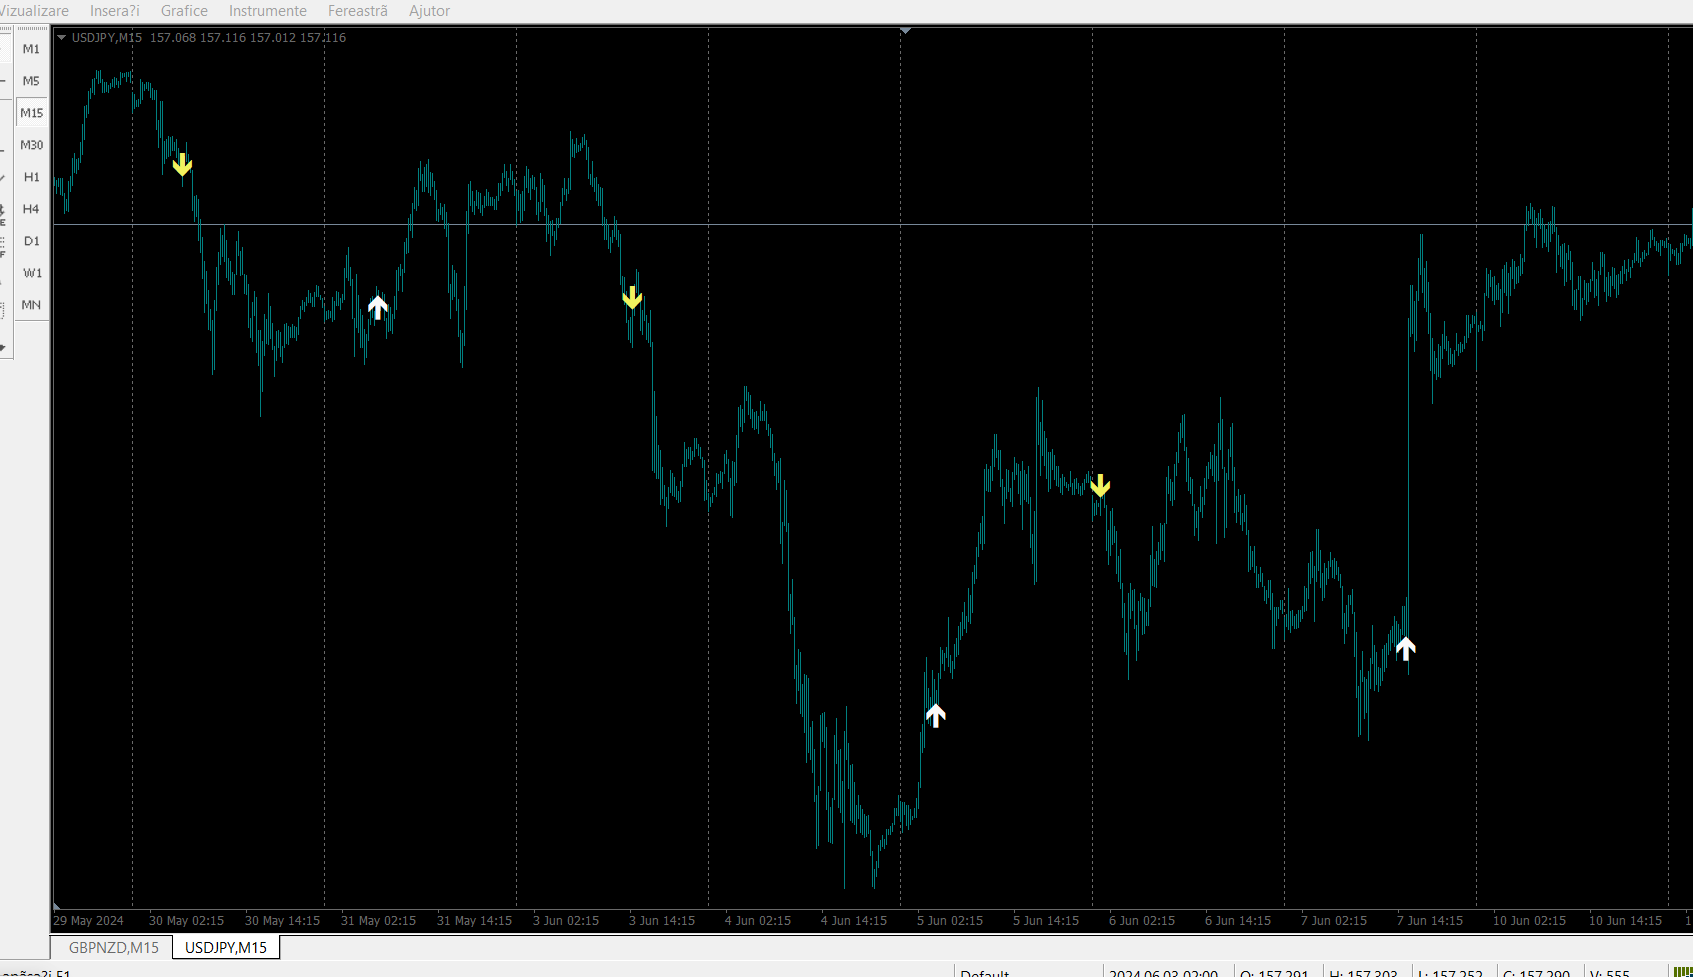
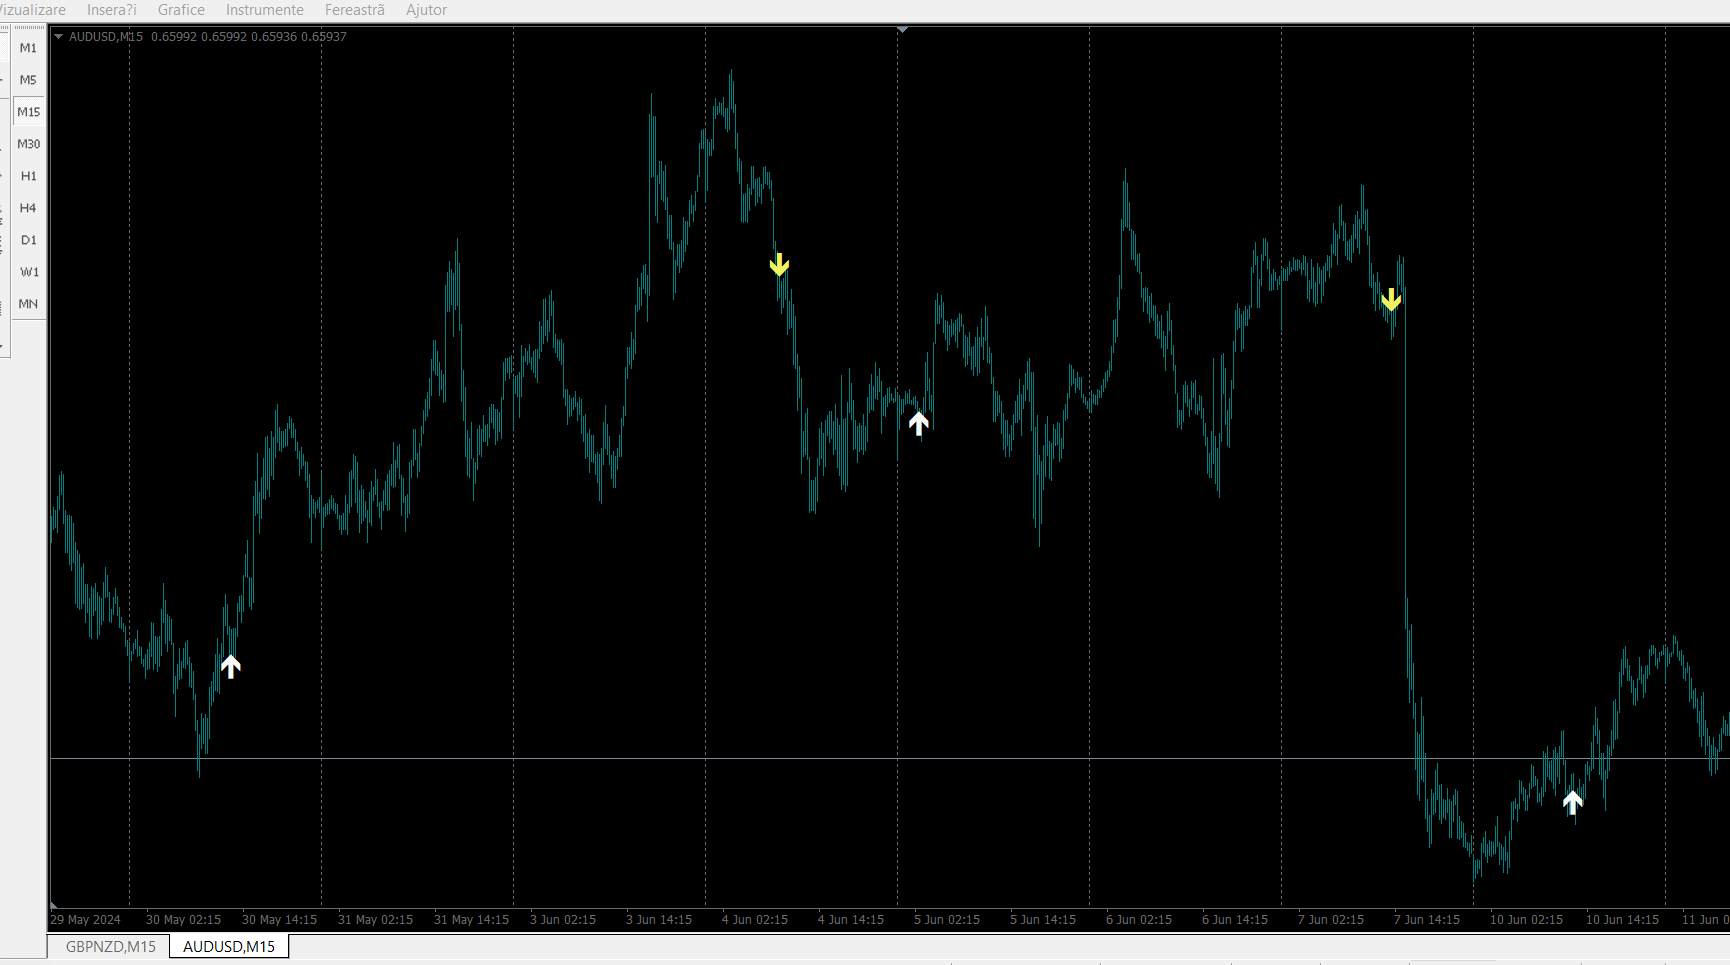
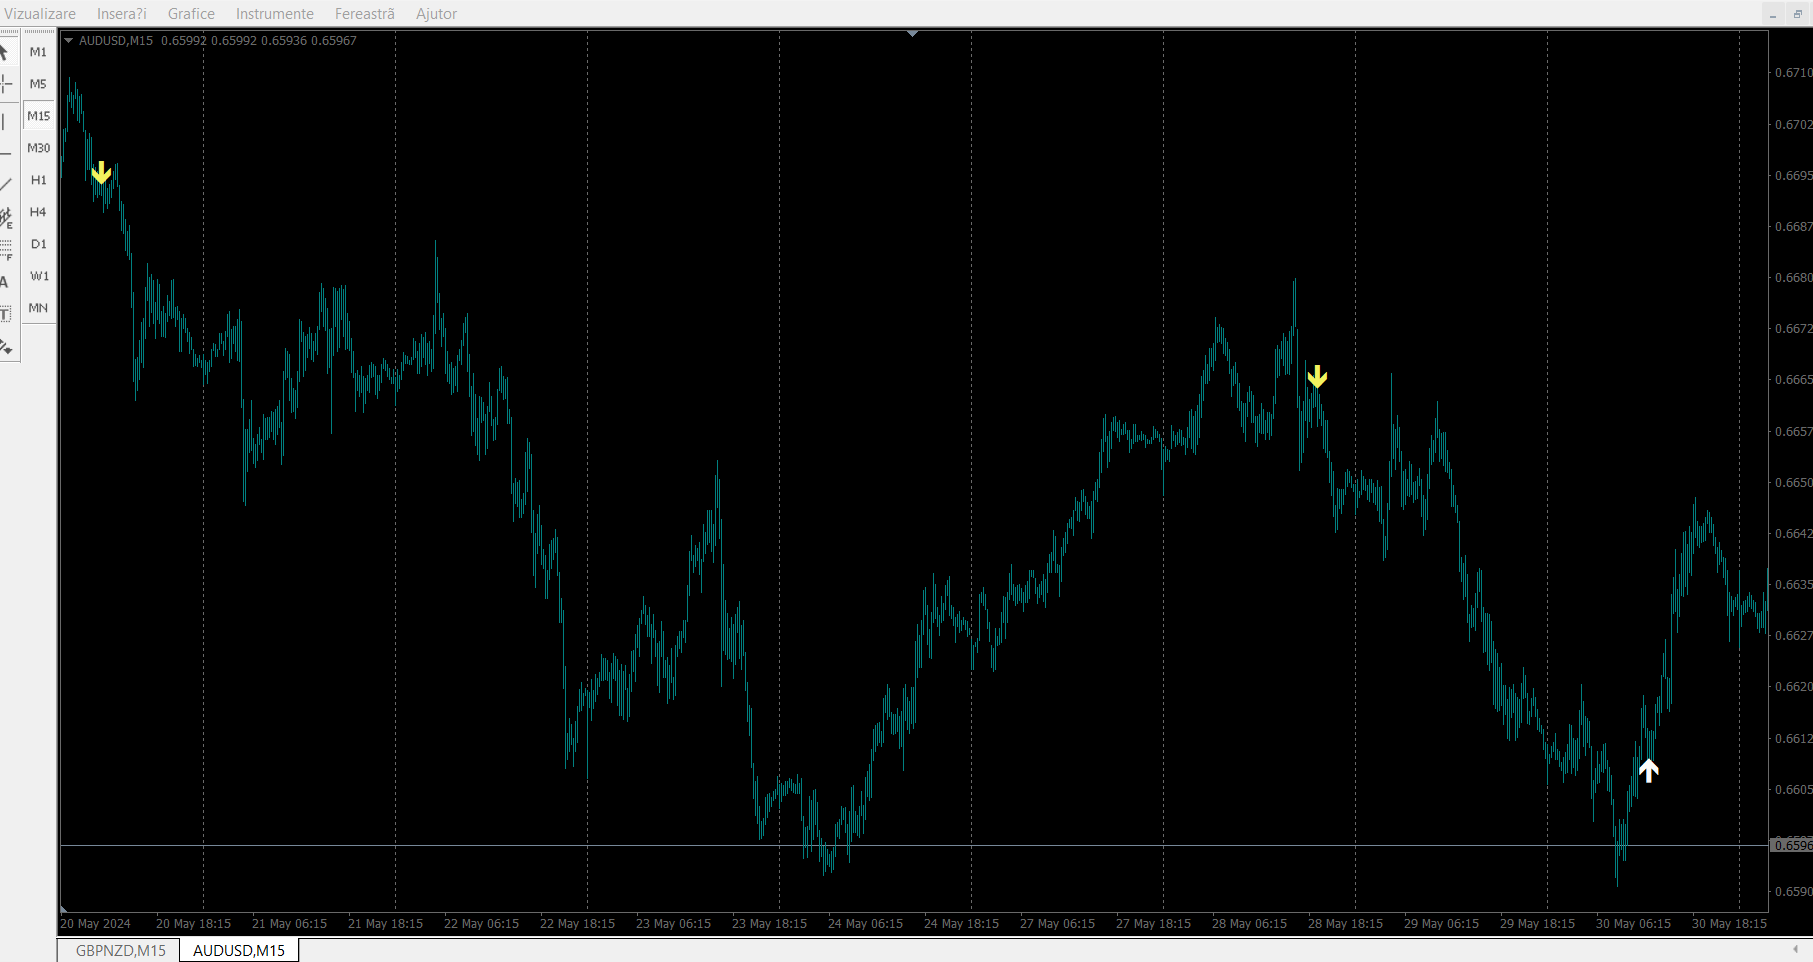
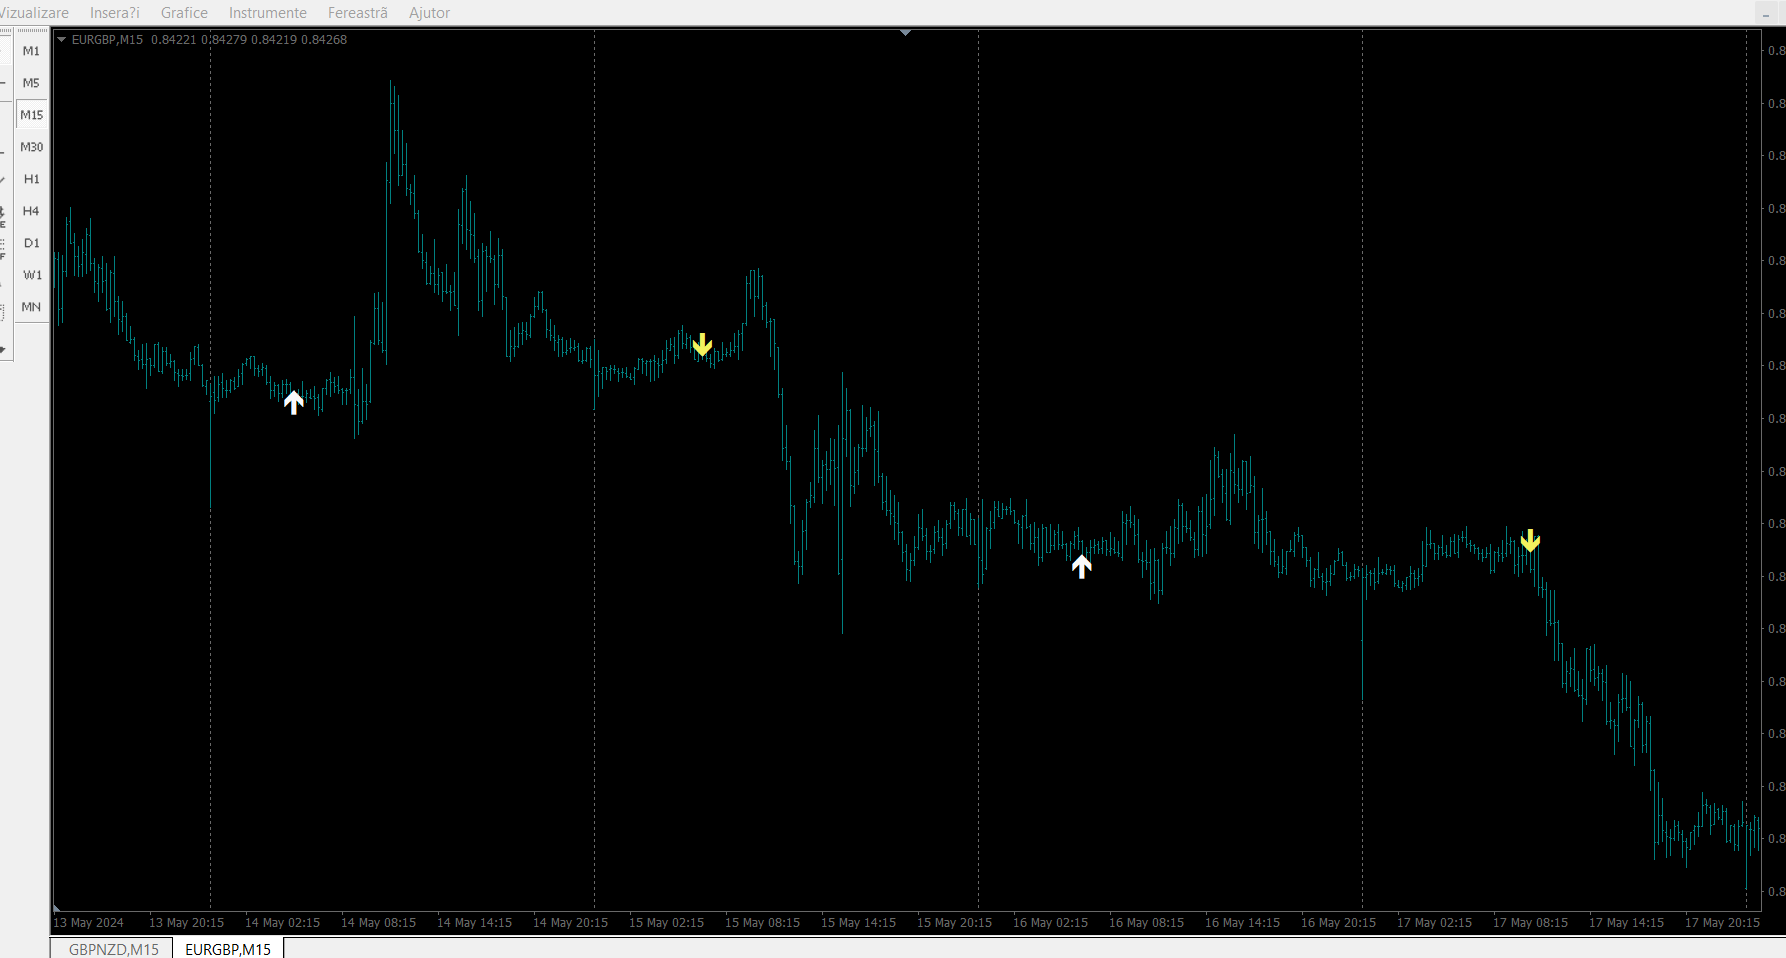
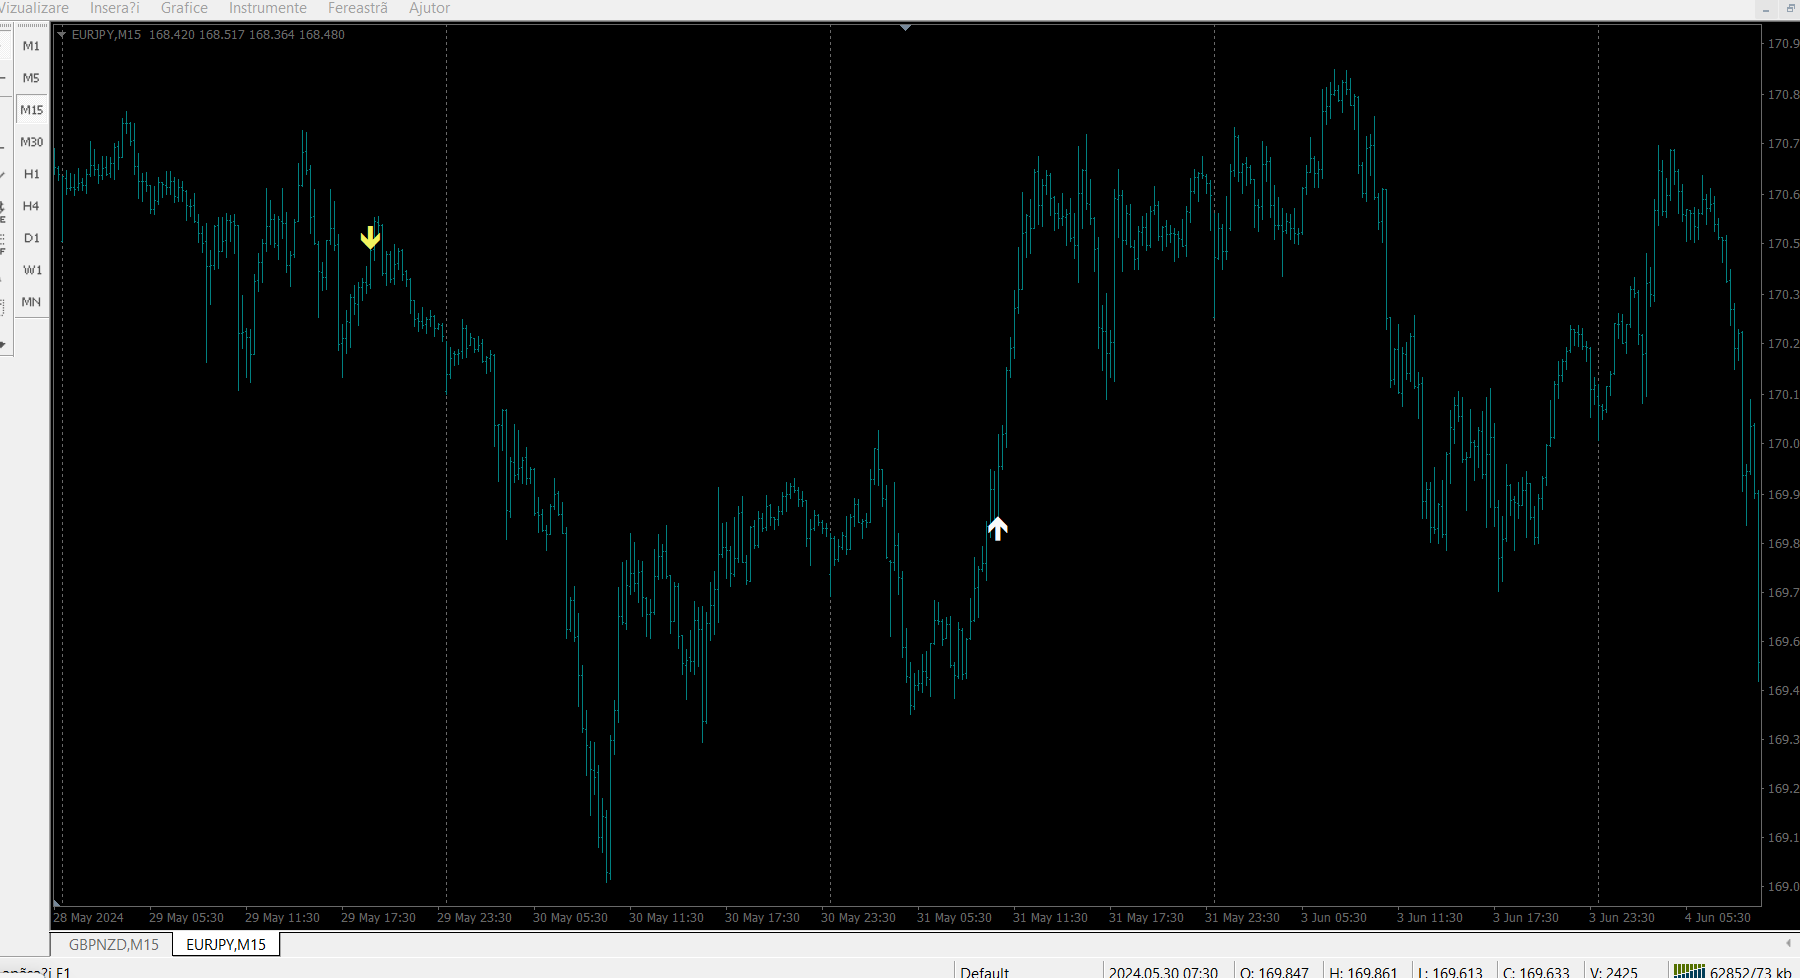
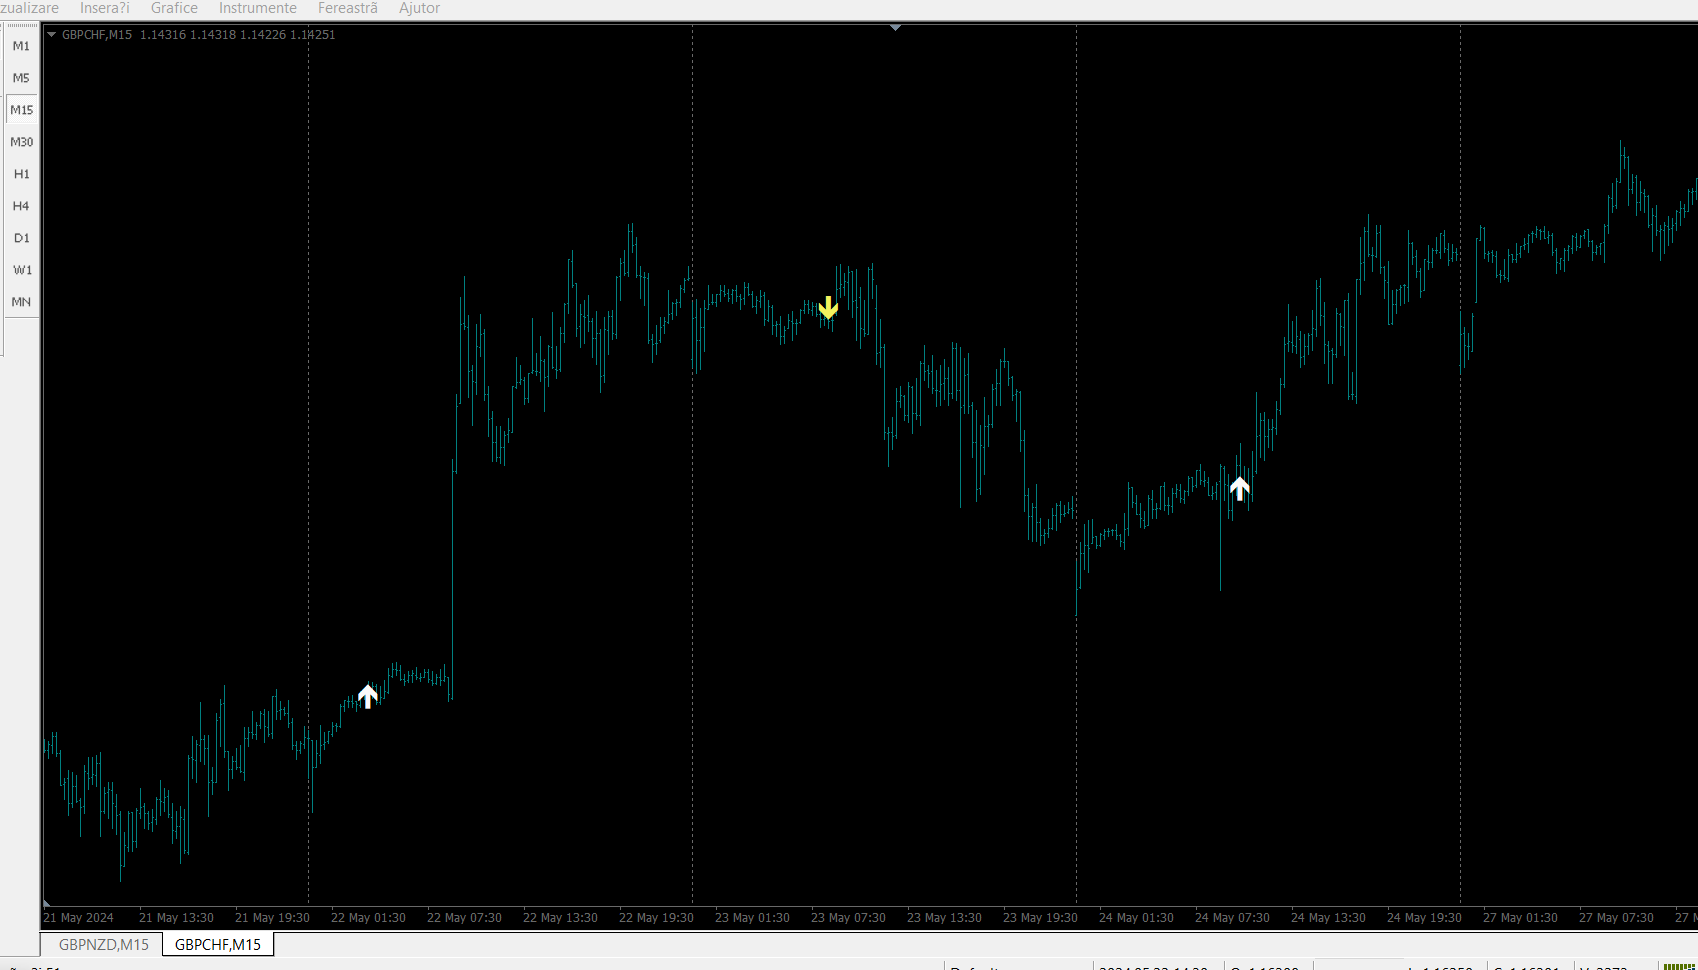
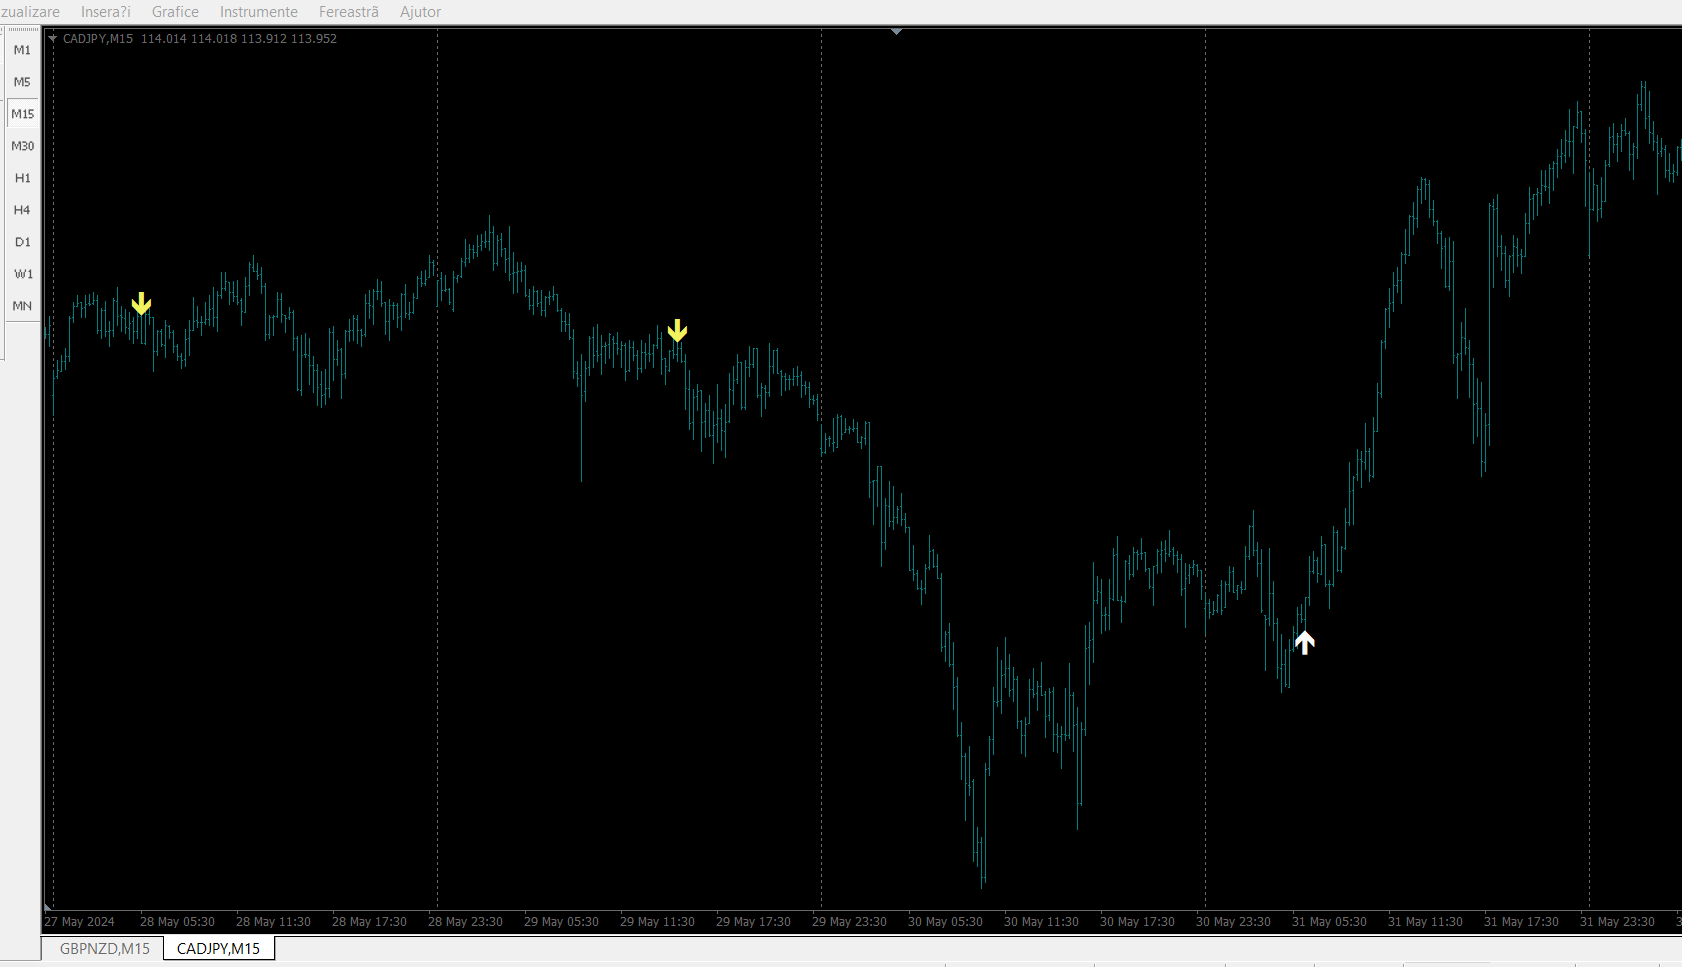
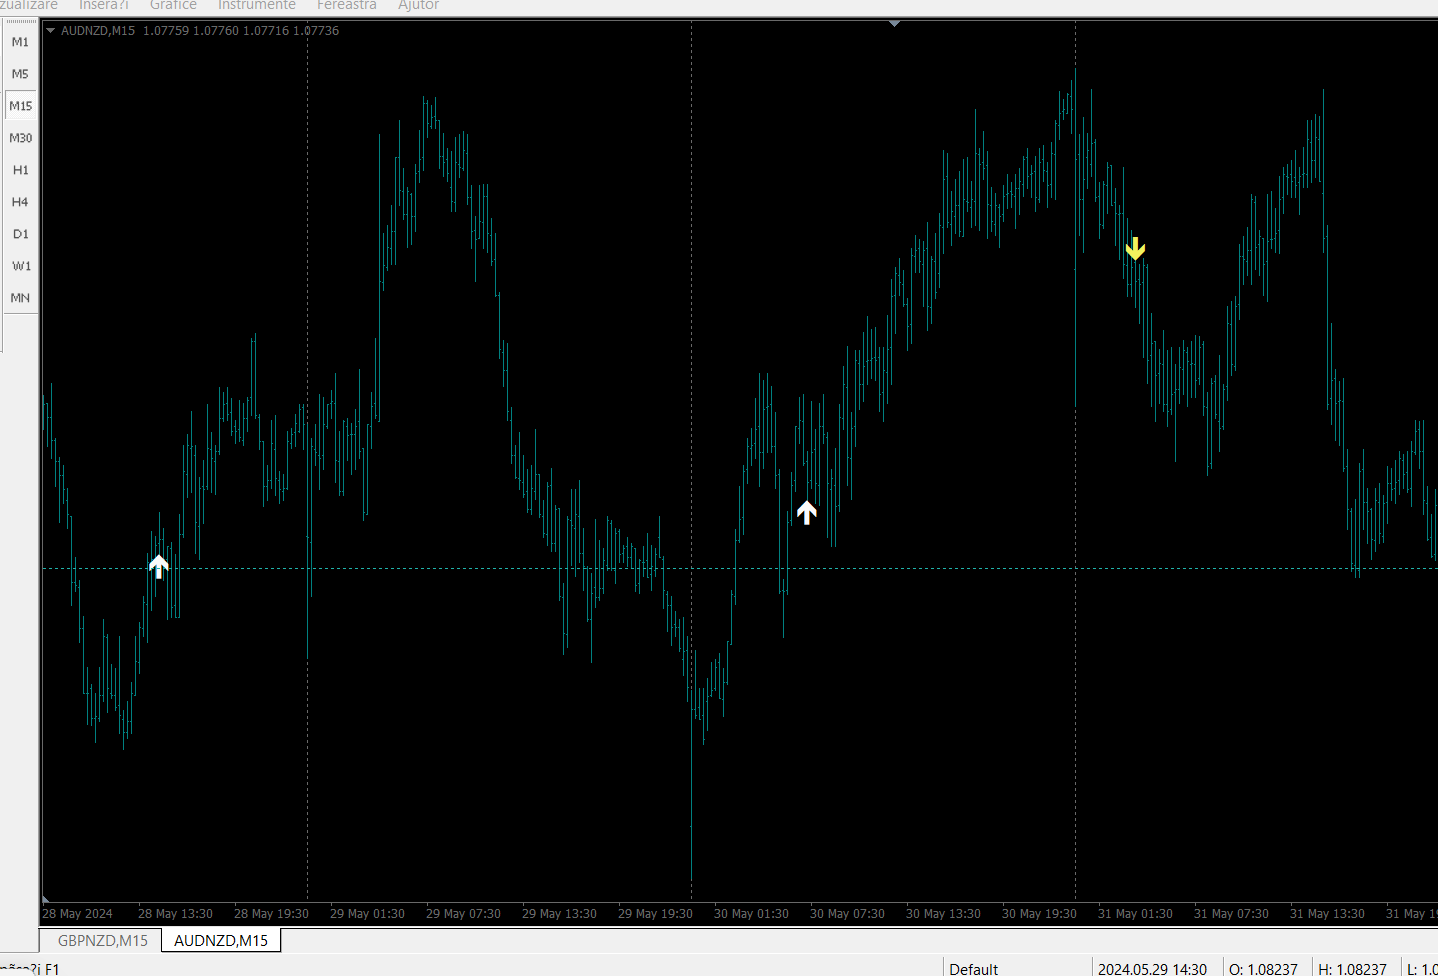
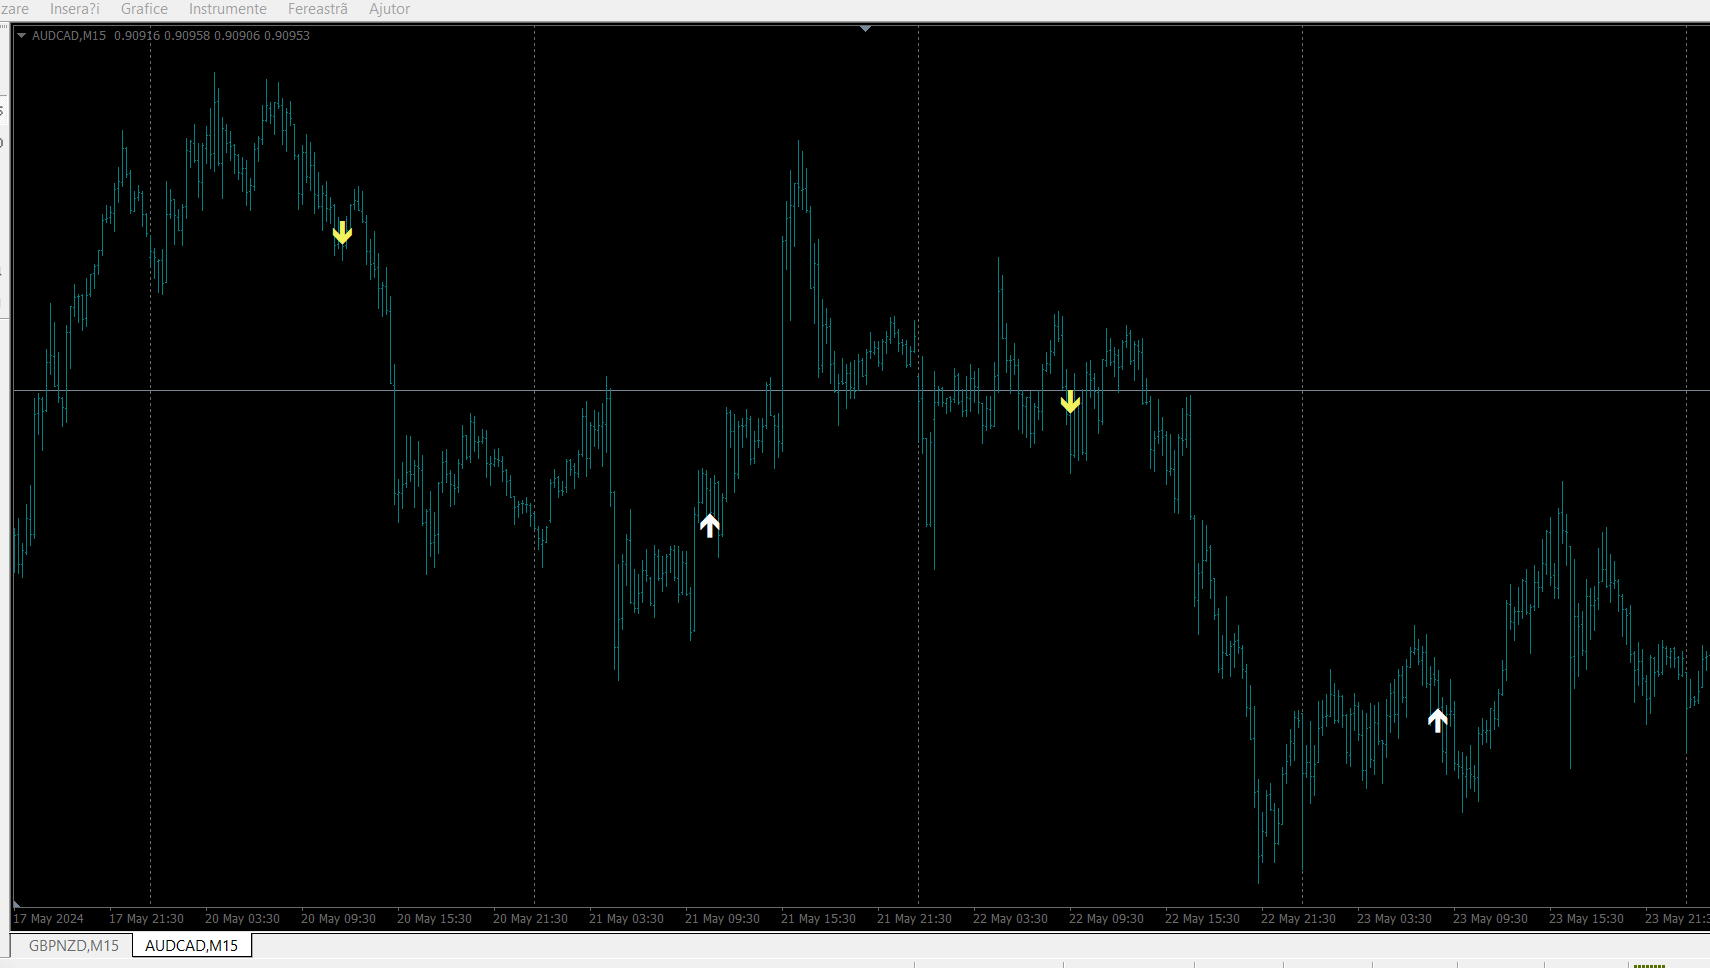
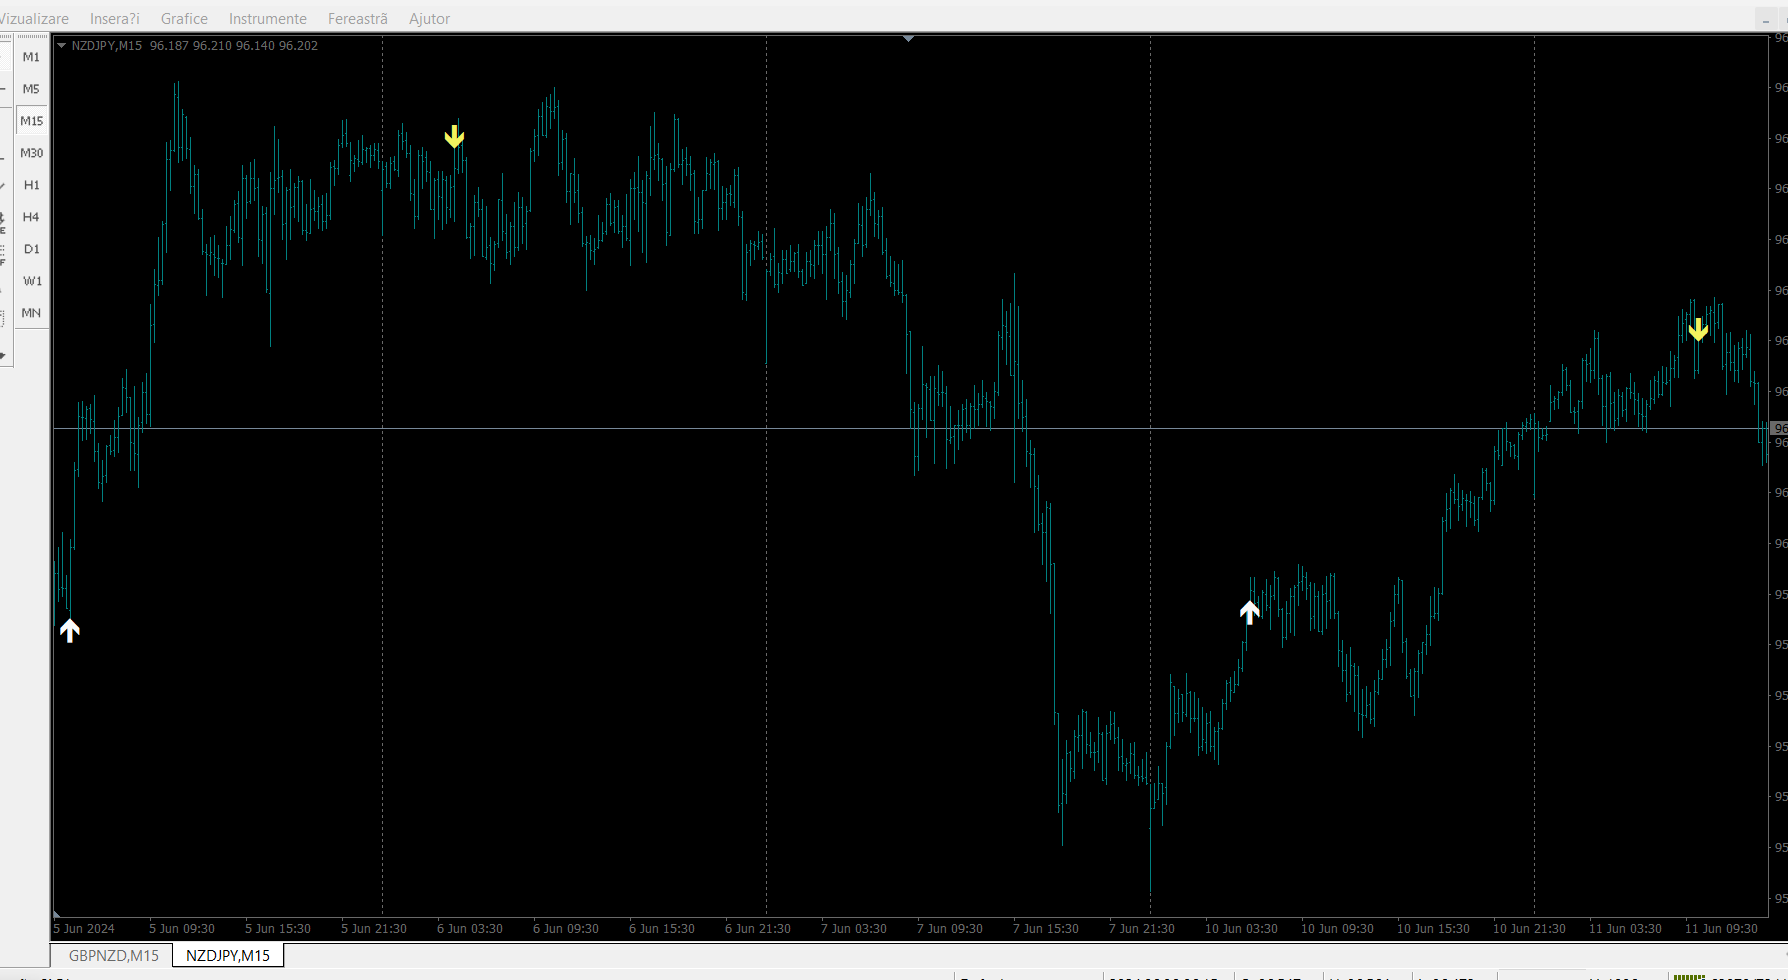
Buy Sell signal M15
Welcome back to our page.
Buy Sell signal M15 indicator works with better results on M15.
On longer time intervals the signals are rarer.
It is an oscillator type indicator.
I would recommend a profit target of 10 pips or at the first level of support or resistance, etc.
It can be used successfully on the M5.
Beware of Stop-Loss.
It should be placed so that it is not hit by random price movements.
Good luck!