SpreadChart
- 指标
- Zhao Ming Liu
- 版本: 1.0
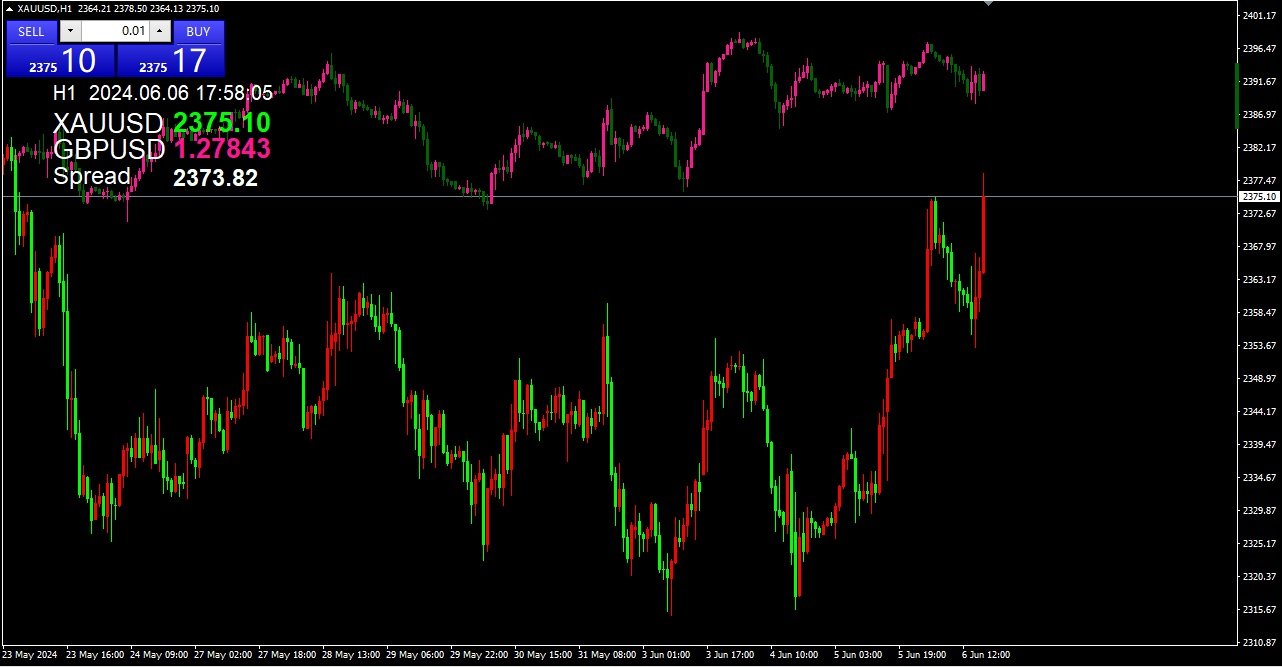
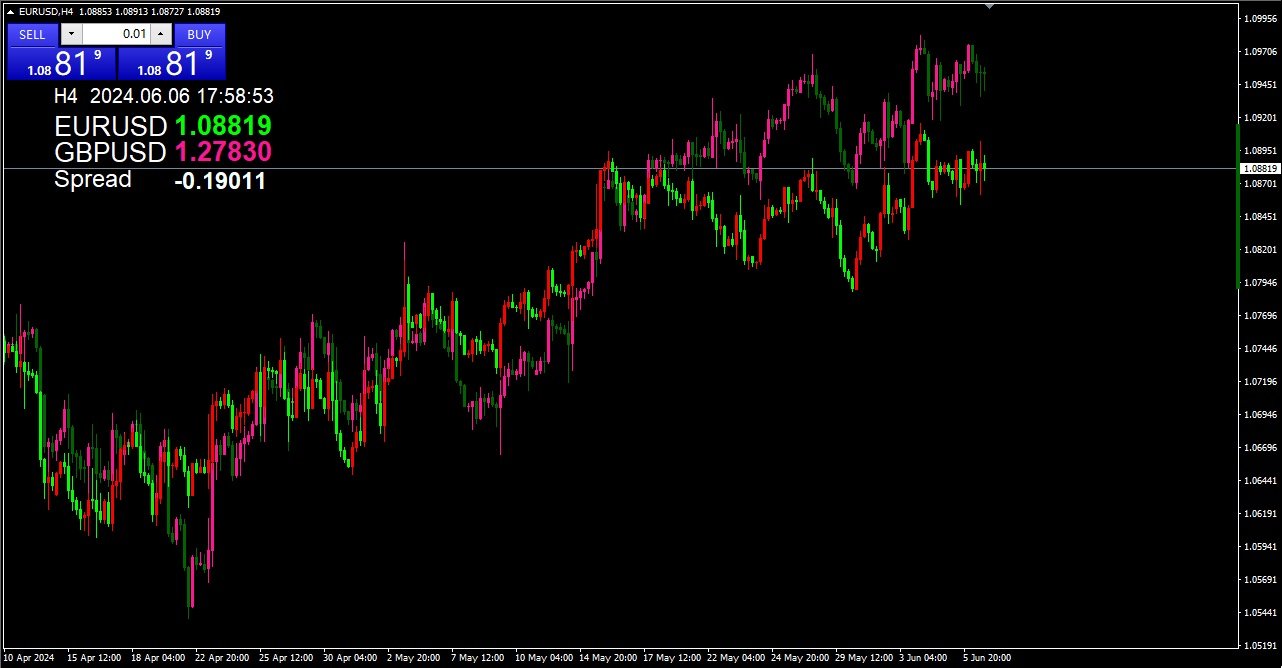
该指标可用于在当前品种的图表上添加另一个品种的K线图。
1.图表高低会自动调整
2.如果切换当前图标周期,另一品种的K也会切换到相应的周期
3.在图表的左上角会显示当前所用的周期,当前时间,以及两个标的的当前价格,价差。
4.当切换周期时,由于有大量数据调取,偶尔会比较慢,可以切换试试,或者稍等一会儿。
5.两个品种的价差尽量以左上角显示为准。
。。。。。。。。。。。。。。。。。。。。。。。。。。。。。。。。。。。。。。。
。。。。。。。。。。。。。。。。。。。。。。。。。。。。。。。。。。。。。。。。
。。。。。。。。。。。。。。。。。。。。。。。。。。。。。。。。。。。。。。。。
。。。。。。。。。。。。。。。。。。。。。。。。。。。。。。。。。。