• 概述
  • 评论
  • 评论
  • 新特性

Fair Value

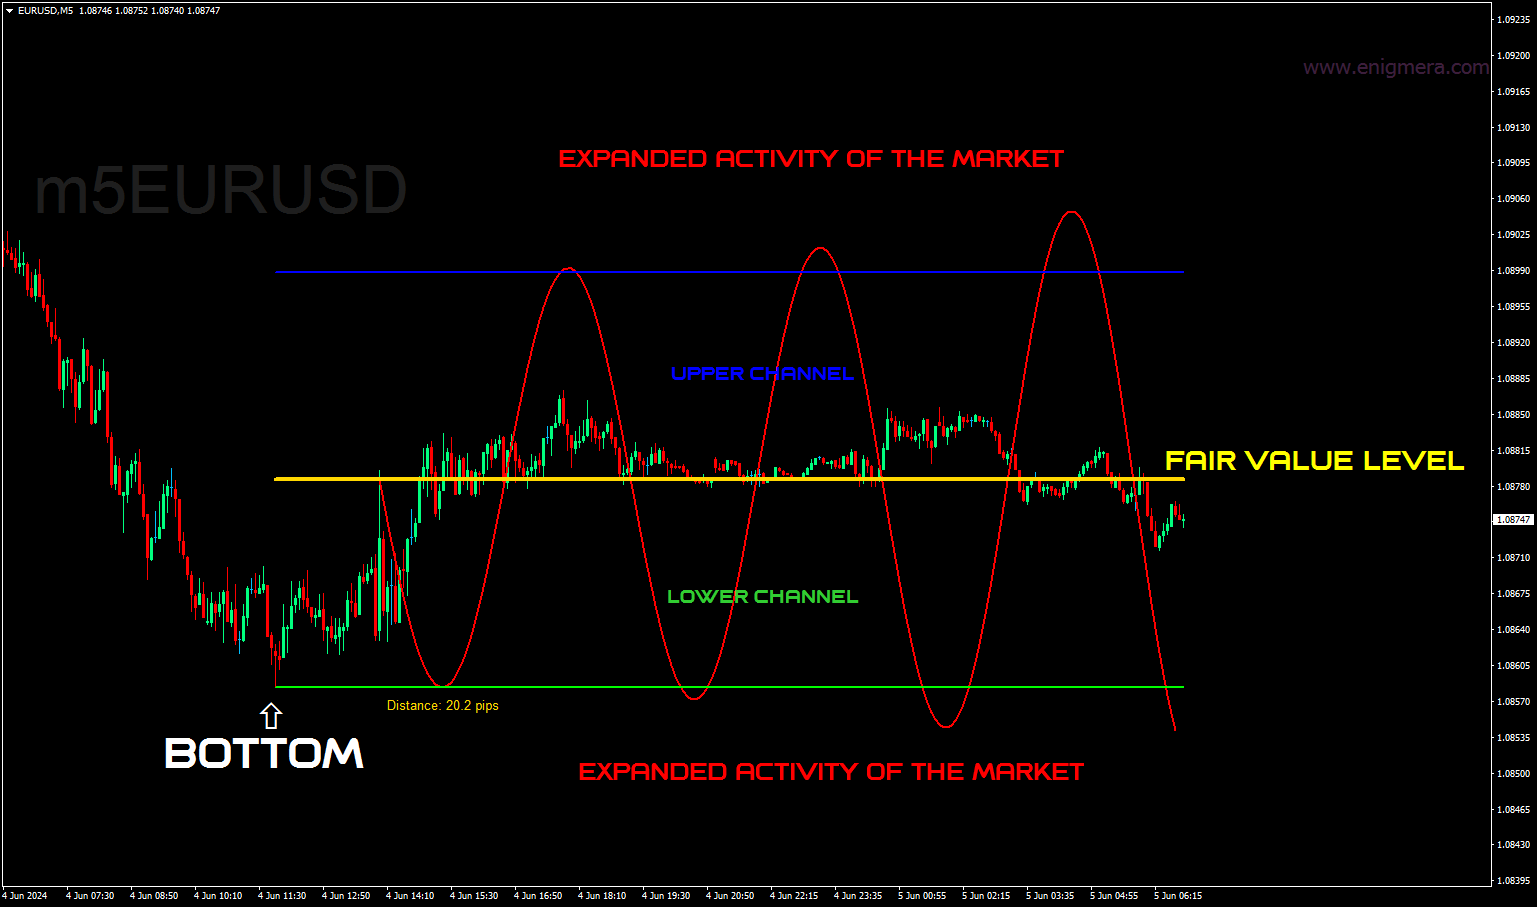
一旦市场触及重要顶部或底部,就会进入修正阶段,并找到其合理价值。

该指标可自动计算:

合理价值水平
修正通道
从公允价值到修正通道边界之间的距离(以点为单位
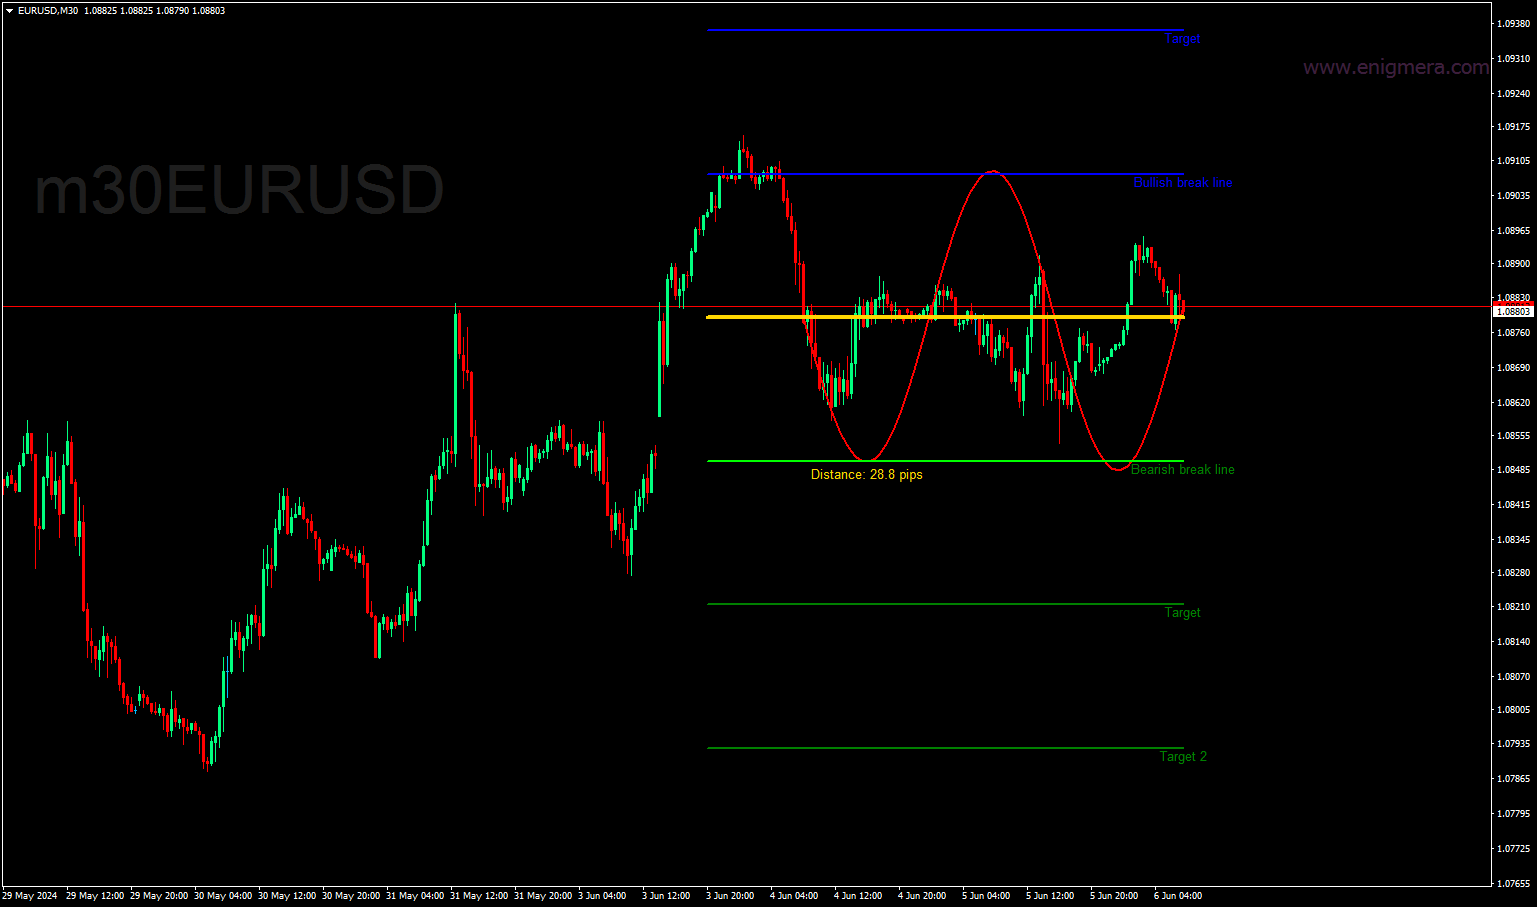
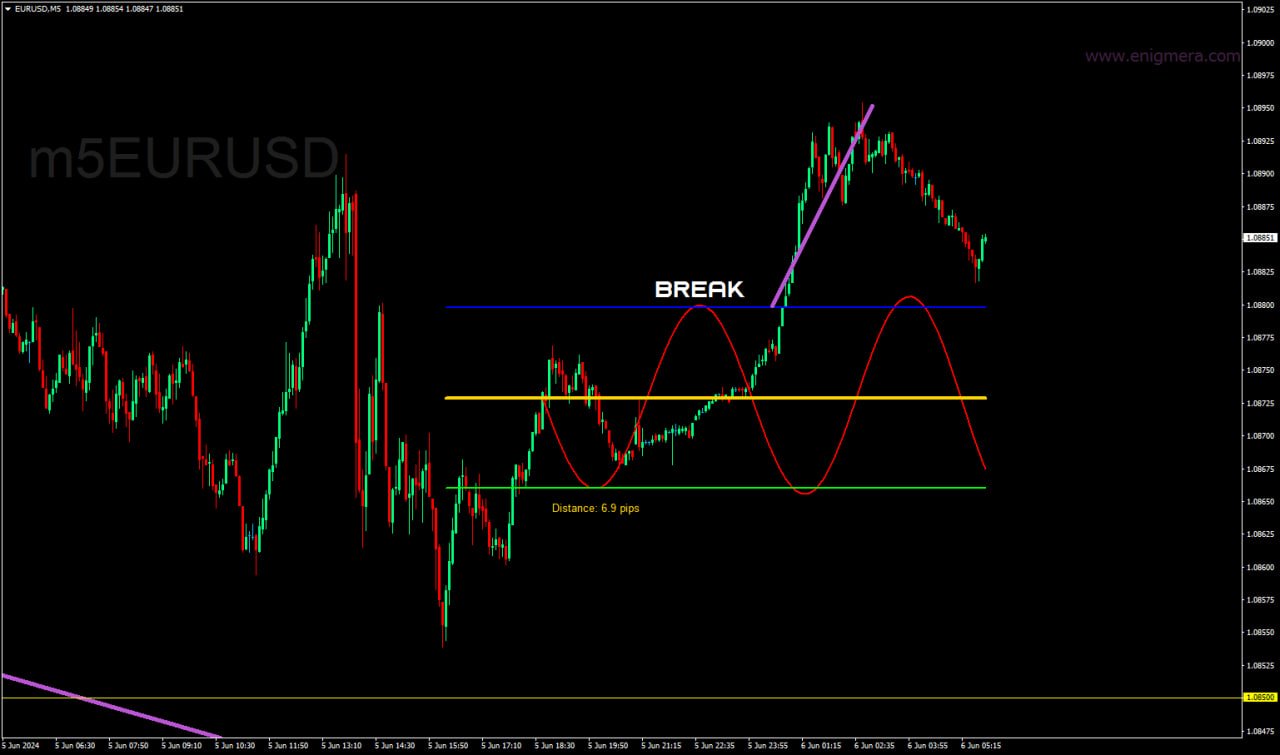
正弦波,从第一根公允价值水平蜡烛开始,随着时间的推移而扩展,显示突破前预期的最大调整扩展水平。
突破正弦波后会出现定向移动。如果没有突破,则可将其视为支撑/阻力位。在该指标中,您需要输入修正前的高点或低点的日期和时间。还有一个选项是自动跟踪最近的 120 根蜡烛。您可以随意更改这一数字。还有其他选项可以更改正弦:

步长
扩展
点数
大小
时移
斜率
不同时间框架显示的结果非常相似,因此可以认为该指标不依赖于时间框架。

直观但取决于用户

指标的有效性取决于用户的正确配置。不准确的设置会影响分析的精确性。用户必须透彻了解市场修正阶段,才能最大限度地发挥其性能。这种理解将导致有效的行动。

令人着迷的专业工具。
推荐产品
Forex Gump
Andrey Kozak
2.83 (6)
Forex Gump is a fully finished semi-automatic trading system. In the form of arrows, signals are displayed on the screen for opening and closing deals. All you need is to follow the instructions of the indicator. When the indicator shows a blue arrow, you need to open a buy order. When the indicator shows a red arrow, you need to open a sell order. Close orders when the indicator draws a yellow cross. In order to get the most effective result, we recommend using the timeframes H1, H4, D1. There
我们的 Basic Support and Resistance 指示器是提高技术分析所需的解决方案。该指标允许您在图表/ MT5版本 功能 斐波那契水平的集成: 可以选择显示斐波那契水平以及支持和阻力水平,我们的指标使您对市场行为和可能的逆转区域有更深入的了解。 性能优化: 只能在每个栏的打开时更新扩展线,我们的指标可确保最佳性能,而无需牺牲支持和阻力级别的准确性。 输入 主设置 Timeframe:   通过此输入,您可以选择在图表上显示较高时间范围的支撑线和阻力线。 Support/Resistance Strength [Number of Bars]:  使用此输入,您可以确定支撑和电阻的强度。数量越高,支持/阻力越强。 Price mode: 此参数允许您选择哪种价格将用于计算支持和电阻水平。它可以是收盘价,最高价格,最低价格等。取决于您的策略和偏好,您可以选择最适合您需求的价格。 显示设置 Display Fibonacci levels: 此参数确定是否将显示斐波那契水平以及图表上的支持和电阻级别。斐波那契水平是技术分析中使用的关键水平,并使用斐波那契序
MA Alignment Scanner
Benedict Jamora
5 (1)
This indicator scans and displays currency pairs that have recently aligned moving averages on a given timeframe. You can configure which pairs the indicator will scan. It also includes all types of alert options. Bullish MA Alignment =  MA1>MA2>MA3>MA4>MA5 Bearish MA Alignment =  MA1<MA2<MA3<MA4<MA5 Features Attach to one chart and scans all the currency pairs configured and visible in the Market Watch Window It can monitor all the available timeframes from M1 to MN1 and sends alerts on ever
Noize Absorption Index MT4
Ekaterina Saltykova
5 (1)
Noize Absorption Index - is the manual trading system that measures the difference of pressure between bears forces and bulls forces. Green line - is a noize free index that showing curent situation. Zero value of index shows totally choppy/flat market.Values above zero level shows how powerfull bullish wave is and values below zero measures bearish forces.Up arrow appears on bearish market when it's ready to reverse, dn arrow appears on weak bullish market, as a result of reverse expectation. S
TWO PAIRS SQUARE HEDGE METER INDICATOR Try this brilliant 2 pairs square indicator It draws a square wave of the relation between your two inputs symbols when square wave indicates -1 then it is very great opportunity to SELL pair1 and BUY Pair2 when square wave indicates +1 then it is very great opportunity to BUY pair1 and SELL Pair2 the inputs are : 2 pairs of symbols         then index value : i use 20 for M30 charts ( you can try other values : 40/50 for M15 , : 30 for M30 , : 10 for H1 ,
我们为您提供一个指标"蜡烛收盘台",它将成为您在贸易领域不可或缺的助手。 这就是为什么知道蜡烛何时关闭会有所帮助的原因: 如果你喜欢使用蜡烛花纹进行交易,你就会知道蜡烛何时关闭。 此指标将允许您检查是否形成了已知模式以及是否存在交易的可能性。 该指标将帮助您做好市场开放和市场关闭的准备。 可以设置一个计时器来创建计划新闻的预览,这样就可以检查市场对此的反应。 您可以设置指示灯,以便在蜡烛关闭前几秒钟发送警报/警告。 通知/警报/警报可以发送到: 屏幕警报 电子邮件 移动应用 MT4烛台计时器指示器为什么有用 那么烛台计时器什么时候有用呢?如果你长期交易,你可能不需要蜡烛计时器指示器,因为你的参赛不会受到一分钟或一小时的太大影响。但是,如果你在短时间内是黄牛或交易员,那么你知道时机非常重要。 外汇市场24小时开放,只在周末关门,有些策略可能会受到您入仓时出现错误时机的严重影响。 MT4蜡烛计时器指示器可以显示当前蜡烛中的剩余时间,以便为下一次蜡烛打开做好准备。 可以从这一指标中受益的一些情况例子有: 预定消息传出 地理市场开闭 预定发生的事件,通常是金融、经济或
Currency Quote
Bott Consulting Group
Real-time trend, pricing, and volume details in the corner of the current chart. This indicator displays useful trend, pricing, and volume information in the corner of the current chart. With this indicator, you get real-time market trend, pricing (Ask, Bid, spread, Open, High, Low, change from previous bar Close), and volume (current, High, average). After the indicator is executed, you will see this real-time data in the upper right-hand corner of the chart or an alert indicating that an error
If you are tired of jumping from chart to chart or loading up a 1000 of currency pairs on restricted MetaTrader 4 terminal to see what are the best trading opportunities out of the Asian Session, then Sessions Indicator Scanner may be the perfect indicator for you. Based on Steve Mauro's Forex training, the Sessions Indicator was developed to scan the entire Forex market at the opening of the London Session and the closing of the Asian Session. This can also be used for those who incorporate bre
This tool will perform Trailing stop loss and Break even management for orders. Helps you limit or reduce the time spend watching orders on the screen, especially when you need to go to sleep. Just add this EA to 1 chart, you can manage all pairs. You can filter orders by comment, magic number, and symbol. When Breakeven it can add shift/offset pips (to cover the commission...). You can try in strategy tester before purchase. The EA will add Buy and Sell alternately, so you can check the oper
The indicator displays the data of the Stochastic oscillator from a higher timeframe on the chart. The main and signal lines are displayed in a separate window. The stepped response is not smoothed. The indicator is useful for practicing "manual" forex trading strategies, which use the data from several screens with different timeframes of a single symbol. The indicator uses the settings that are identical to the standard ones, and a drop-down list for selecting the timeframe. Indicator Parame
VR Cub
Vladimir Pastushak
VR Cub 这是获得高质量切入点的指标。该指标的开发是为了促进数学计算并简化对仓位入场点的搜索。多年来,该指标所针对的交易策略已被证明其有效性。交易策略的简单性是其巨大的优势,即使是新手交易者也能成功进行交易。 VR Cub 计算开仓点以及获利和止损目标水平,这显着提高了效率和易用性。查看使用以下策略进行交易的屏幕截图,了解简单的交易规则。 设置、设置文件、演示版本、说明、问题解决,可以从以下位置获取 [博客] 您可以在以下位置阅读或撰写评论 [关联] 版本为 [MetaTrader 5] 计算入场点的规则 开仓 要计算入场点,您需要将 VR Cub 工具从最后一个高点拉伸到最后一个低点。 如果第一个点在时间上早于第二个点,交易者等待柱线收于中线上方。 如果第一个点在时间上晚于第二个点,交易者等待柱线收于中线下方。 根据上述条件,严格在 柱线收盘 后建仓。 换句话说,如果我们在小时图上进行交易,那么从最高点到最低点的时间距离必须超过24小时,最高点和最低点之间的点数必须大于或等于平均价格变动每天。 维持和改变市场地位 可以有多个未平仓头寸;每个头寸都可以单独修改。 VR Cu
To get access to MT5 version please click here . - This is the exact conversion from TradingView: "Stochastic Momentum Index" By "UCSgears". - This is a popular version of stochastic oscillator on tradingview. - This is a light-load processing and non-repaint indicator. - Buffers are available for the lines on chart. - You can message in private chat for further changes you need. Thanks for downloading
Binary Options Assistant (BOA) Multi Currency Dashboard for Binary Options (MT4) . You can use any of the BOA Signals Indicators with the dashboard. Just change the BOA Signals Indicator Name in the dashboard settings to the indicator you want to get signals from. For example: CHILL. BOA_BURN_Indicator_v1   Strategy :   Ana Trader Binary Options Strategy (MACD & Stochastic) BOA_COLD_Indicator_v1   Strategy :  Amalia Trader Binary Options Strategy (Keltner & Stochastic) BOA_CHILL_Indicator_
Now, you have your own AUTO-CLOSE program ! Once your account target or drawdown hits, all open orders will be closed automatically. ========================================== INPUTS: Account target: Put the exact account target. Once the equity hits it or went above that, all orders closed. Please add buffer to consider slippage. Use fixed value or dynamic value: Choose whether you will need a fixed value or dynamic value for drawdown.  DYNAMIC SETTINGS: Equity-based or Balance-based drawdown:
MT4 to Discord Signal Provider 是一款用户友好、完全可定制的工具,专为直接向 Discord 发送交易信号而设计。这个工具将您的交易账户转变为一个高效的信号提供者。 自定义消息格式以适应您的风格!为了方便使用,您可以从预先设计的模板中选择,并决定包括或排除哪些消息元素。 [ 演示 ] [ 手册 ] [ MT5 版本 ] [ Telegram 版本 ] 设置 遵循我们详细的 用户指南 进行简单设置。 不需要预先了解 Discord API;我们提供所有必要工具。 主要特性 为订阅者更新自定义订单详情。 实施分层订阅模型,如铜牌、银牌、金牌,每一层都提供不同级别的信号访问。 附加执行订单的图表截图。 在这些截图上显示已关闭的订单,以增加清晰度。 提供延迟发送新订单消息的选项,以便在发送前进行最后调整。 透明和详细的订单信息: 带截图的新市场订单。 订单修改(止损、获利)。 已关闭和部分关闭的订单。 新的和修改的挂起订单。 挂起订单的激活和删除。 关于历史订单的详细报告。 每个订单的可定制评论。 注意: * 截图包括图表上的任何对象,如指标。 ** 在报
Blahtech Market Profile
Blahtech Limited
4.61 (18)
Was: $249  Now: $99   Market Profile defines a number of day types that can help the trader to determine market behaviour. A key feature is the Value Area, representing the range of price action where 70% of trading took place. Understanding the Value Area can give traders valuable insight into market direction and establish the higher odds trade. It is an excellent addition to any system you may be using. Blahtech Limited presents their Market Profile indicator for the MetaTrader community. Ins
HMA Trend Professional MT4
Pavel Zamoshnikov
4.57 (7)
Improved version of the free HMA Trend indicator (for MetaTrader 4) with statistical analysis. HMA Trend is a trend indicator based on the Hull Moving Average (HMA) with two periods. HMA with a slow period identifies the trend, while HMA with a fast period determines the short-term movements and signals in the trend direction. The main differences from the free version: Ability to predict the probability of a trend reversal using analysis of history data. Plotting statistical charts for analyz
EZT Trade History This is a great tool to analyze past trades or follow current ongoing trades, especially when you using an EA to manage your transactions. You will see the exact candle where the trade was opened and closed. Collapsible floating panel on the chart, free to move anywhere with your mouse. When you using multiple EA’s with different magic numbers, you have 5 options to separate those trades, so you will know which EA opened specific transactions. You can set the day limits how fa
Strong Retracement Points Pro demo edition! SRP (Strong Retracement/Reversal Points) is a powerful and unique support and resistance indicator. It displays the closest important levels which we expect the price retracement/reversal! If all level are broken from one side, it recalculates and draws new support and resistance levels, so the levels might be valid for several days depending on the market! If you are still hesitating to start using this wonderful tool, you can check this link to see h
NEW check the FULL Version Including the private ICT tools limited so far until the release of the full 2016 Mentorship Core Content to the public. Indicator type: Money Management Calculator; Forex Position Size Calculator; Fixed or ATR value for Stop Loss and Take Profit levels; Average Position Size Indicator (True Average Price); Acc ount Information; Stop-out Level, Margin and Risk Exposure Warning, Forex Sessions; Institutional Levels Grid; Major Highs and Lows, Detailed Account Report an
斐波那契折返和扩展画线工具 适用于MT4平台的斐波那契折返和扩展画线工具,适合于使用黄金分割交易的交易者 优点:没有多余的线,没有过长的线,易于观察发现交易的机会 试用版: https://www.mql5.com/zh/market/product/35884 主要功能: 1.可以直接画出多组斐波那契折返,可以看出重要折返点之间的关系; 2.可以画出斐波那契扩展,比率有三种0.618,1,1.618 3.画出的斐波那契折返和扩展均可左右移动,有数值显示,方便观察 4.可通过数字键切换周期 使用指南和功能键: 1.按 [ 或R画折返,按需要画折返,最多云持8组折返; 2.按 ] 或E画扩展; 3.按 \ 删除当前周期下的所有扩展和折返,其余周期的不受影响 4.如何左右移动折返和扩展 (1)点击第一组折返的F5字符,可以左右移动折返; (2)点击COP的字符 ,可以左右移动扩展; 5. (1)点击第一组折返的F5字符,按del 可以删除这组折返; (2)点击COP的字符, 按del 可以删除这组扩展; 6.修改折返和扩展(随着市场的运行
Binary Option Signal
Yaroslav Varankin
Indicator for binary options arrow is easy to use and does not require configuration works on all currency pairs, cryptocurrencies buy signal blue up arrow sell signal red down arrow tips do not trade during news and 15-30 minutes before their release, as the market is too volatile and there is a lot of noise it is worth entering trades one or two candles from the current period (recommended for 1 candle) timeframe up to m 15 recommended money management fixed lot or fixed percentage of the depo
Point61 Indicator
Evgeniy Machok
5 (1)
The Point61 indicator is the result of many years of monitoring of price behavior of currency pairs and metals. It is not a secret, that in times of uncertainty, traders are looking for possible levels of support and resistance - the point, where price should stop its movement. There are 2 possible scenarios at these points: 1. Reverse (correction) to the opposite direction; 2. Breakthrough to continue movement. Very often these points are used to set stop orders - TakeProfit or
MT 2ma Cross Count
Issara Seeboonrueang
Please feel free to contact me if you need any further information. Please let me know if you have any questions. I hope the above is useful to you. MT 2ma Cross Count : is a moving average with 2 lines crossing but the strategy is to focus on the desired number of history bars and count signals that occur. Suitable for traders specialize in martingale strategy or traders specialize in technical ... etc. Traders with the ability to do fundamental analysis have an advantage. Because it will ma
Master scalping M1
Nataliia Marchuk
Master Scalping M1 is an innovative indicator that uses an algorithm to quickly and accurately determine the trend.The indicator calculates the time of opening and closing positions, the indicator's algorithms allow you to find the ideal moments to enter a deal (buy or sell an asset), which increase the success of transactions for most traders. Benefits of the indicator: Easy to assemble, does not overload the chart with unnecessary information. Can be used as a filter for any strategy. Works on
AnyChart MT4
Irek Gilmutdinov
AnyChart is a multifunctional tool allowing you to work with non-standard charts in MetaTrader 4. It includes collector of ticks and generator of charts for trading (hst files) and testing (fxt files). Supported chart types are second, tick and renko ones. Settings Starting Date - start date for chart plotting. Ending Date - end date for chart plotting. Chart Type - chart type: Time - time chart, each bar contains a certain time interval; Tick - volume chart, each bar contains a certain number
Description: Please tick "Show object descriptions" in chart properties to enable hrays views That utility converts a trendline into a horizontal ray known as tool for drawing supply and demand zones. Simply create a trendline on a chart and once selected, it will get converted. Ray remains horizontal while dragging.  Quick ray plot: press "R" key to create horizontal ray. It will be snapped to the nearest OHLC value Further versions will be improved. For feature request please post new c
Laguerre SuperTrend Clouds adds an Adaptive Laguerre averaging algorithm and alerts to the widely popular SuperTrend indicator. As the name suggests, Laguerre SuperTrend Clouds (LSC) is a trending indicator which works best in trendy (not choppy) markets. The SuperTrend is an extremely popular indicator for intraday and daily trading, and can be used on any timeframe. Incorporating Laguerre's equation to this can facilitate more robust trend detection and smoother filters. The LSC uses the impro
Shark Deal Book
Philip Pankaj Suthagar
4 (3)
Term  "shark"  in the business world denotes a high volume investor who just made a good investment in a highly Potential business deal.So, sharks are the ones who make the market move. In our case, if an American shark bought a Japanese company, he/she has to convert American dollars into Japanese yen to make the deal. So, the demand for the Japanese yen will increase sharply. Thus USD/JPY will go short rapidly if the deal was from the shark. Another example, In the case of forex, if fed increa
The Best One Scalping Trade Panel functional manual trade panel with risk reward, auto SL by candle ( original solution), lot size calculation, one-click trading, scale in and out of trades (partial close),  Works with all symbols not just currency pairs, perfect works on DAX, NASDAQ, GOLD, ...... I earn every day during live stream on ZakopiecFX - join Me Risk by lot Risk by percent SL by points SL by Candle, Renko, RangeBar ( original solution) TP by point TP by Risk/Reward Auto Trailing b
该产品的买家也购买
Gann Made Easy
Oleg Rodin
4.93 (85)
Gann Made Easy 是一个专业且易于使用的外汇交易系统,它基于使用先生理论的最佳交易原则。 W.D.江恩。该指标提供准确的买入和卖出信号,包括止损和获利水平。您甚至可以使用推送通知在旅途中进行交易。 购买后请联系我!我将免费与您分享我的交易技巧和丰厚的红利指标! 您可能已经多次听说过江恩交易方法。通常 Gann 的理论不仅对于新手交易者而且对于那些已经有一定交易经验的人来说都是非常复杂的东西。这是因为江恩的交易方法在理论上并不那么容易应用。我花了几年时间来完善这些知识,并将最好的原则应用到我的外汇指标中。 该指标非常易于应用。您所需要的只是将其附加到您的图表并遵循简单的交易建议。该指标不断进行市场分析工作并寻找交易机会。当它检测到一个好的入口点时,它会为您提供一个箭头信号。该指标还显示止损和获利水平。 换句话说,当您像先生一样进行交易时,该指标会为您提供最佳江恩建议。江恩亲自告诉你此时此刻该做什么。但最好的部分是您不需要了解任何有关江恩交易原则的知识,因为该指标会为您完成整个市场分析工作。
Scalper Inside PRO
Alexey Minkov
4.75 (59)
An exclusive indicator that utilizes an innovative algorithm to swiftly and accurately determine the market trend. The indicator automatically calculates opening, closing, and profit levels, providing detailed trading statistics. With these features, you can choose the most appropriate trading instrument for the current market conditions. Additionally, you can easily integrate your own arrow indicators into Scalper Inside Pro to quickly evaluate their statistics and profitability. Scalper Inside
目前八折优惠! 对任何新手或专家交易者来说都是最好的解决方案! 这个仪表板软件适用于28种货币对。它基于我们的两个主要指标(高级货币强度28和高级货币冲动)。它对整个外汇市场提供了一个伟大的概述。它显示高级货币强度值,货币运动速度和28个外汇对在所有(9)时间段的信号。想象一下,当你可以使用图表上的单一指标观察整个市场,以确定趋势和或剥头皮的机会时,你的交易将得到改善 我们已经在这个指标中建立了一些功能,使你更容易识别强势和弱势货币,同时识别和确认潜在的交易。该指标以图形方式显示货币的强势或弱势是增加还是减少,以及它在所有时间段的表现。 增加的新功能是动态市场斐波那契水平,它适应当前的市场条件变化,这是一个已经在我们的高级货币强度28和高级货币冲动指标中使用的成熟的加分项。 在交易时,总是将弱势货币和强势货币配对,这个新指标将帮助你做到这一点。 用户手册:点击这里  https://www.mql5.com/en/blogs/post/708783 特点  显示每个时间段的ACS28和GAP-speed(冲动)的货币强度值。 列:颜色代码以7种颜色
TPSpro RFI Levels
Roman Podpora
4.86 (21)
Reversal First Impulse levels (RFI)    INSTRUCTIONS        RUS       -       ENG              R ecommended to use with an indicator   -   TPSpro  TREND PRO -  Version MT5 A key element in trading is zones or levels from which decisions to buy or sell a trading instrument are made. Despite attempts by major players to conceal their presence in the market, they inevitably leave traces. Our task was to learn how to identify these traces and interpret them correctly. Main functions: Displaying activ
AT Forex Indicator MT4
Marzena Maria Szmit
5 (2)
The AT Forex Indicator MT4 is a sophisticated trading tool designed to provide traders with a comprehensive analysis of multiple currency pairs. This   powerful indicator   simplifies the complex nature of the forex market, making it accessible for both novice and experienced traders. AT Forex Indicator uses   advanced algorithms   to detect trends, patterns and is an essential tool for traders aiming to enhance their forex trading performance. With its robust features, ease of use, and reliabl
TPSproTREND PrO
Roman Podpora
4.78 (18)
TPSpro TRENDPRO  - is a trend indicator that automatically analyzes the market and provides information about the trend and each of its changes, as well as giving signals for entering trades without redrawing! The indicator uses each candle, analyzing them separately. referring to different impulses - up or down impulse. Exact entry points into transactions for currencies, crypto, metals, stocks, indices!  -  Version MT5               DETAILED DESCRIPTION                R ecommended to use with
FX Power MT4 NG
Daniel Stein
5 (11)
通过 mql5 和 Telegram 上 的晨间简报获取每日市场更新,包括详细信息和屏幕截图 ! FX Power MT4 NG 是我们长期以来非常受欢迎的货币强度计算器 FX Power 的下一代产品。 这款下一代强度计算器能提供什么?您所喜爱的原版 FX Power 的所有功能 附加功能 黄金/XAU 强度分析 更精确的计算结果 可单独配置的分析周期 可自定义计算限制,以获得更好的性能 为希望查看更多信息的用户提供特殊的多实例设置 无尽的图形设置,可在每个图表中设置您最喜欢的颜色 无数的通知选项,让您再也不会错过任何重要信息 采用 Windows 11 和 macOS 风格的全新圆角设计 神奇的移动指标面板 FX Power 主要功能 所有主要货币的完整强势历史 所有时间框架内的货币强弱历史 所有经纪商和图表的计算结果完全相同 100% 可靠的实时计算 -> 无重绘 可通过下拉列表选择分析时段 通过自定义模式单独配置分析时段 可在一个图表中使用多个实例 可移动 FX Power 显示屏(通过拖放) 适用于高分辨率 QHD、UHD 和 4K 显示器 自动终端配置 针对平板电脑
Indicator : RealValueIndicator Description : RealValueIndicator is a powerful tool designed specifically for trading on the EURUSD pair. This indicator analyzes all EUR and USD pairs, calculates their real currency strength values, and displays them as a single realistic value to give you a head start on price. This indicator will tell you moves before they happen if you use it right. RealValueIndicator allows you to get a quick and accurate overview of the EURUSD currency pair tops and bottoms,
TrendMaestro
Stefano Frisetti
5 (3)
note: this indicator is for METATRADER4, if you want the version for METATRADER5 this is the link:  https://www.mql5.com/it/market/product/108106 TRENDMAESTRO ver 2.4 TRENDMAESTRO recognizes a new TREND in the bud, he never makes mistakes. The certainty of identifying a new TREND is priceless. DESCRIPTION TRENDMAESTRO identifies a new TREND in the bud, this indicator examines the volatility, volumes and momentum to identify the moment in which there is an explosion of one or more of these data a
FX Volume
Daniel Stein
4.61 (36)
通过 mql5 和 Telegram 上 的 " 晨间简报 "获取每日市场更新,包括详细信息和屏幕截图 ! 外汇交易量(FX Volume)是第一个也是唯一一个从经纪商角度真正洞察市场情绪的交易量指标。 直接在您的图表上看到这些信息是真正改变游戏规则和突破性的交易解决方案。 受益于独特的市场数据洞察,如 比率(Ratios )显示货币多头和空头头寸的比率(百分比 比率变化 显示所选时间段内的多头比率及其百分比变化 总交易量 显示货币的总交易量(多头和空头),以手为单位 多头 交易量显示货币所有多头头寸的交易量 空头 交易量显示所有货币空头头寸的交易量 净多头 显示净多头交易量,即所有多头头寸减去所有空头头寸(以手为单位)。 净多头百分比 显示货币净多头交易量的变化 请阅读我们的基本教程 -> "如何使用外汇交易量进行交易 " 获取更多信息,如常见问题、交易技巧和教程视频,请访问我们的 外汇交易量公共信息频道 请 安装并运行 SI Connect 以建立与我们数据中心的持续连接 背景信息 我们都知道,外汇是一个分散的市场。这就是为什么我们必须打破常规思维,开发一个独
Quantum Trend Sniper Indicator MT4
Bogdan Ion Puscasu
4.6 (40)
介绍   量子趋势狙击指标 ,突破性的 MQL5 指标,正在改变您识别和交易趋势反转的方式!由拥有超过13年交易经验的资深交易员团队开发,     量子趋势狙击指标   旨在通过其创新的方式以极高的准确度识别趋势反转,将您的交易之旅推向新的高度。 ***购买量子趋势狙击指标,即可免费获得量子突破指标!*** 当量子突破指标识别出趋势反转时,它会向您发出警报和信号箭头,并建议您三个止盈水平。 它既适合新手交易者,也适合专业交易者。 量子 EA 通道:       点击这里 MT5版本:       点击这里 建议: 时间范围:  所有时间范围。为了获得最佳结果,我们建议在 M15、M30 和 H1 时间范围内使用它。 货币对:欧元兑美元、英镑兑美元、澳元兑美元、欧元兑英镑, EURAUD, XAUUSD 账户类型:ECN、Raw 或 Razor,点差极低 经纪时间:任意 经纪商:IC Markets、Pepperstone with Raw 和 Razor 的点差最低 建议止损:50 点 建议止盈水平:20 点、50 点和 1
Advanced Supply Demand
Bernhard Schweigert
4.92 (313)
现在优惠 33%! 任何新手或专业交易者的最佳解决方案! 该指标是一款独特、高质量、且价格合理的交易工具,因为我们已经整合了许多专有功能和新公式。 依据此更新,您将能够显示双重时间帧区域。 您不仅可以显示一个较高的时间帧,还可以同时显示图表时间帧,加上更高的时间帧:显示嵌套时区。 供需双方所有交易者都会喜欢它。 :) 重要信息披露 高级供需的最大潜力,请访问 https://www.mql5.com/zh/blogs/post/720245   想象您的交易如何得以改善,是因为您能够精准定位入场或目标位吗? 构建于新的底层算法,它可以更轻松地识别出买卖双方之间的潜在失衡。 这是因为它以图形方式展示供需最强劲区域,及其过去的表现(显示旧区域)。 这些功能旨在帮助您更轻松地发现最佳入场区域和价位。 现在您可以针对您的交易品种和时间帧来优化和编辑区域强度! 高级供需指标适用于所有产品和时间帧。 它是一个新的公式,非常新的功能是两个区域强度函数可由用户输入进行调整! 这在交易中是一大优势。 当您学习如何使用专有功能,例如带有价格游离最小 X 因子的区域强度时,您能够判断该区域强劲与否。 供
Atomic Analyst
Issam Kassas
5 (3)
首先值得强调的是,该交易指标是非重绘、非延迟的指标,这使其成为手动和机器人交易的理想选择。 用户手册:设置、输入和策略。 Atomic Analyst是一种PA价格行动指标,利用价格的力量和动量来寻找市场上更好的机会。配备了高级过滤器,可帮助去除噪音和假信号,并提高交易潜力。使用多层复杂的指标,Atomic Analyst扫描图表,并将复杂的数学计算转化为任何初学者都能理解并用来做出一致交易决策的简单信号和颜色。 “Atomic Analyst”是专为新手和经验丰富的交易者量身定制的综合交易解决方案。它将高级指标和一流功能融合为一体的交易策略,使其成为所有类型交易者的多功能选择。 日内交易和剥头皮策略:专为快速准确的日内交易和短期交易而设计。 日内和摆动交易策略:可用作追求价格大幅波动的日内和摆动交易者的可靠工具。 多货币和市场:凭借其可靠的精度,在不同的工具和市场上运作。 多个时间框架:可在多个时间框架上使用,性能良好。 稳定性:所有指标均不重绘、不重绘和不滞后,确保可靠的信号。 信号清晰度:提供箭头信号,用于清晰的入场和出场点。 实时警报:通过交易入场、SL和TP警报通知交
Advanced Currency Strength28 Indicator
Bernhard Schweigert
4.91 (665)
目前26%的折扣 任何新手或专家交易者的最佳解决方案! 这个指标是一个独特的、高质量的、可负担得起的交易工具,因为我们纳入了一些专有的功能和一个新的公式。只需一个图表,你就可以读出28个外汇对的货币强度!想象一下,你的交易将如何得到改善,因为你的交易是在你的手中进行的。想象一下,你的交易将如何改善,因为你能够准确地确定新趋势或剥头皮机会的触发点? 用户手册:点击这里  https://www.mql5.com/en/blogs/post/697384 这是第一本,原版的! 不要买一个毫无价值的崇拜者的克隆品。 特别的 子窗口中的箭头显示强劲的货币势头GAP将指导你的交易! 当基础货币或报价货币处于超卖/超买区域(外盘斐波那契水平)时,在个人图表的主窗口中出现警告信号。 当货币力量从外围区间回落时,回撤/反转警报。 十字星模式的特别警报 可选择多个时间框架,以快速查看趋势! 货币强度线在所有的时间框架中都非常平稳,当使用较高的时间框架来识别总体趋势,然后使用较短的时间框架来确定精确的入口时,效果非常好。你可以根据自己的意愿选择任何时间框架。每个时间框架都由其自身进
M1 Arrow
Oleg Rodin
5 (14)
M1 Arrow - 基于市场的两个基本原则的盘中策略。 该算法基于使用附加过滤器对交易量和价格波动的分析。该指标的智能算法仅在两个市场因素合二为一时才会发出信号。该指标使用较高时间框架的数据计算 M1 图表上某个范围的波浪。为了确认波浪,该指标使用了成交量分析。 从理论上讲,该指标可以与其他时间框架一起使用,但您需要考虑到该指标最初是为在 M1 上交易而开发的这一事实。 该指标是一个现成的交易系统。交易者所需要的只是跟随信号。此外,该指标可以成为您自己的交易系统的基础。交易仅在分钟图表上进行。 尽管指标使用 MTF 原理,但指标算法尽可能稳定。 购买后,一定要写信给我!我将与您分享我的交易设置和建议!祝您交易成功!感谢您的关注!
Quantum Breakout Indicator PRO
Bogdan Ion Puscasu
4.96 (26)
介绍     Quantum Breakout PRO   ,突破性的 MQL5 指标,正在改变您交易突破区域的方式!   Quantum Breakout PRO 由拥有超过 13 年交易经验的经验丰富的交易者团队开发,旨在通过其创新和动态的突破区域策略将您的交易之旅推向新的高度。 量子突破指标将为您提供带有 5 个利润目标区域的突破区域的信号箭头,以及基于突破框的止损建议。 它既适合新手交易者,也适合专业交易者。 量子 EA 通道:       点击这里 MT5版本:   点击这里 重要的!购买后请私信我领取安装手册。 建议: 时间范围:M15 货币对:GBPJPY、EURJPY、USDJPY、NZDUSD、XAUUSD 账户类型:ECN、Raw 或 Razor,点差极低 经纪商时间:GMT +3 经纪商:IC Markets、Pepperstone with Raw 和 Razor 的点差最低 规格: 不重漆! 最多 5 个建议利润目标区域 建议止损水平 可定制的盒子。您可以设置自己的 Box Time Start 和 Box Time E
NAM Order Blocks
NAM TECH GROUP, CORP.
5 (1)
MT4多時限訂單塊檢測指示器。 特徵 -在圖表控制面板上完全可自定義,提供完整的交互。 -隨時隨地隱藏和顯示控制面板。 -在多個時間範圍內檢測OB。 -選擇要顯示的OB數量。 -不同的OB用戶界面。 -OB上的不同過濾器。 -OB接近警報。 -ADR高低線。 -通知服務(屏幕警報|推送通知)。 概括 訂單塊是一種市場行為,它指示從金融機構和銀行收取訂單。著名的金融機構和中央銀行帶動了外匯市場。因此,交易者必須知道他們在市場上正在做什麼。當市場建立訂單塊時,它會像發生大多數投資決策的範圍一樣移動。 訂單建立完成後,市場將朝著上升和縮小的方向發展。訂單大宗交易策略的關鍵術語是它包括機構交易者正在做的事情。由於它們是主要的價格驅動因素,因此包括機構交易在內的任何策略都可以。 您將在任何時間範圍內實時看到訂單塊,使用我們的控制面板,您將能夠在所選的歷史記錄週期內檢測常規,拒收和未大寫的訂單塊。 現在您可以接收到訂單塊接近警報,我們在MT4上顯示屏幕通知,並將通知推送到您的手機!
Currency Strength Wizard
Oleg Rodin
4.91 (46)
货币强度向导是一个非常强大的指标,为您提供成功交易的一体化解决方案。该指标使用多个时间范围内所有货币的数据来计算这个或那个外汇对的力量。此数据以易于使用的货币指数和货币电力线的形式表示,您可以使用它们来查看这种或那种货币的力量。 您所需要的只是将指标附加到您要交易的图表上,该指标将向您显示您交易的货币的真实强度。该指标还向您显示买卖量压力的极值,您可以在顺势交易时利用这些压力。该指标还显示了基于斐波那契的可能目标。该指标可用于各种交易时间范围。该指标支持各种货币对的交易。 该指标为您提供所有类型的警报,包括推送通知。 购买后请联系我。我将与您分享我的交易技巧,并免费为您提供丰厚的红利指标! 祝您交易愉快,获利丰厚!
Legacy of Gann
Pavel Zamoshnikov
4.85 (13)
The indicator very accurately determines the levels of the possible end of the trend and profit fixing. The method of determining levels is based on the ideas of W.D.Gann, using an algorithm developed by his follower Kirill Borovsky. Extremely high reliability of reaching levels (according to K. Borovsky  - 80-90%) Indispensable for any trading strategy – every trader needs to determine the exit point from the market! Precisely determines targets on any timeframes and any instruments (forex, met
Enigmera
Ivan Stefanov
5 (4)
ENIGMERA:市场核心 https://www.enigmera.com 简介 该指标和交易系统是金融市场的一种非凡方法。ENIGMERA 利用分形周期精确计算支撑位和阻力位。它能显示真实的累积阶段,并给出方向和目标。 该系统无论在趋势中还是在修正中都能发挥作用。 它是如何运行的? ENIGMERA 由三条线组成:支撑/阻力线、目标线和偏离线。与一般市场指标将过去的数据推断为现在和未来的情况不同,该系统能提供当前的完整情况。如果你处于支撑位,这意味着真正的支撑;如果你处于阻力位,这意味着真正的阻力。如果突破某一水平,则表示趋势发生变化。没有重绘。 由于市场在不断变化,ENIGMERA 不断调整其评估工具,定期修改策略。  这保证了每种情况都能得到全面评估。这一市场指标的独特性显而易见,其能力不言而喻。  ENIGMERA 为金融分析师和咨询师提供服务,他们需要可靠的见解与客户分享,也为投资者提供服务,他们需要最精确和最可靠的保证。 该系统能够达到最佳精度,使交易者能够自信、清晰地评估他们的选择。 ENIGMERA 将 20 年的交易专长和知识整合到一个综合软件
TrendDecoder Premium
Christophe Pa Trouillas
5 (6)
确定范围和下一步可能的走势   |  获得早期信号和趋势强度   |  在反转之前获得明确的退出   |  了解价格将测试哪些斐波水平 非重绘、非延迟指标 - 手动和自动交易的理想选择 - 适用于所有资产和所有时间单位 限时优惠 >>   50% OFF 购买后,  请联系我的频道  获取推荐设置 MT5   版本: 点击此处 使用   BladeSCALPER   和   PowerZONES   获取我们的完整方法 它是什么? TrendDECODER 集多种创新于一身,使趋势监测变得简单易行。 投射趋势线(Projective TrendLine)--快速参考即将到来的趋势 实时趋势线(RealTime TrendLine)与投射趋势线(Projective TrendLine)的对比 - 与之前的同方向走势相比,市场是加速还是放缓? 实时趋势线交叉 - 趋势正在偏离轨道 使用 GreyBox - 市场不再是趋势并进入新的过渡序列 使用 DecoderSignals 和 Blue/Orange Clouds - 利用作为动态支撑/阻力的 Blue/Orange
TakePropips Donchian Trend Pro
Eric John Pajarillaga Aldana
4.61 (18)
TakePropips Donchian Trend Pro   (MT4) 是一款功能强大且有效的工具,可使用 Donchian 通道自动检测趋势方向,并为您提供进场和退场交易信号! 这个多功能指标包括趋势扫描器、交易信号、统计面板、筛选器、交易时段和警报历史仪表板。它旨在为您提供交易信号并节省您分析图表的时间! 您可以在我们的博文中下载用户手册和安装指南:   https   :// www.mql5.com/en/blogs/post/751368 今天立减 50%!价格从 98 美元降到 49 美元! 您可以在 Strategy Tester 上测试该指标(启用可视模式) 视频教程也可在说明下方获得更多详细信息。 如果您有任何问题或需要任何帮助,请与我联系。 TakePropips Donchian Trend Pro 指标适用于所有外汇对、金属、商品、指数和加密货币。 主要特点 交易信号 - 检测多个时间范围内所有货币对的买卖机会。它将为您提供警报并在图表上绘制交易信号,最多 3 个止盈价和一个止损价。 Trend Scanner   - 用于快速扫描和识别跨多个时间
All in One Trade
Alexey Minkov
4.48 (27)
The All-in-One Trade Indicator (AOTI) determines daily targets for EURUSD, EURJPY, GBPUSD, USDCHF, EURGBP, EURCAD, EURAUD, AUDJPY, GBPAUD, GBPCAD, GBPCHF, GBPJPY, AUDUSD, and USDJPY. All other modules work with any trading instruments. The indicator includes various features, such as Double Channel trend direction, Price channel, MA Bands, Fibo levels, Climax Bar detection, and others. The AOTI indicator is based on several trading strategies, and created to simplify market analysis. All-in-One
Entry Points Pro
Yury Orlov
4.7 (226)
这是一款 MT4 的趋势指标,可提供准确的入场交易信号,且无重绘或延迟。 它可应用在任何金融资产:外汇、加密货币、贵金属、股票、指数。 最好的结果出现在 M15+ 的时间帧内。 指标的 MT5 版本 重要! 购买后请联系我,以便获取详细指南和奖励。 视频 (6:22) - 一个信号赢取的利润等于指标价格的三倍。 视频 (4:44) - 它如何在测试器中工作,我的提示和技巧。 视频 (1:44) - 有关它如何处理加密货币和指数的几句话。 大多数交易者在 Entry Points Pro 指标的帮助下,在第一个交易周内就改善了他们的交易结果。 Entry Points Pro 指标的益处 入场信号无重绘或延迟 如果信号出现,并得到确认(如果信号所在烛条已收盘),则它不会再消失;不像是重绘指标,它会导致重大的财产损失,因为它们可以在显示信号后再将其删除。 无差错开仓 指标算法可令您找到入场交易(买入或卖出资产)的理想时机,从而提高每位交易者的成功率。 Entry Points Pro 可操作任何资产 它允许您在 MT4 平台上交易任何经纪商提供的加密货币、股票、
PTS Precision Index Oscillator V2
PrecisionTradingSystems
5 (2)
精密指数振荡器(Pi-Osc)由Precision Trading Systems的Roger Medcalf开发 版本2经过精心重新编码,以在您的图表上加载速度非常快,还加入了一些其他技术改进,以提高体验。 Pi-Osc旨在提供准确的交易定时信号,旨在找到极端的耗尽点,这些点是市场被迫去触及,以清理每个人的止损单。 该产品解决了一个古老的问题,即知道极端点在哪里,这使得交易员的生活变得更加简单。 这是一个高度复杂的共识指标,与行业标准的振荡器相比,具有一些强大的区别。 它使用的一些特征包括需求指数、资金流动、RSI、随机指标、模式识别、成交量分析、标准偏差极端点以及不同长度上述各种变化的分歧。 乍一看,对于未经培训的人来说,它似乎与任何其他振荡器没有什么不同,但当与其他振荡器(如RSI或动量等)相对比时,这个指标的真正威力开始显现。 据我所知,没有其他振荡器可以频繁地精确指出顶部和底部,具有相同的定期效率。 精密指数振荡器由许多不同的数学方程组成,用于测量多个时间框架采样中的价格和成交量变动,从而高度准确地预测趋势可能发生转折的位置。 PTS P
Pro SMC Tool
The Anh Pham
Welcome to the world of SMC (Smart Money Concepts) Trading, where we empower traders with the tools and knowledge to make smarter trading decisions. Our latest addition to our suite of trading tools is the SMC Trading Pro indicator, version 1.0. Key Features: Major Market Structure Identification with BODY break. Order Block must be in Major Swing ( not Small Swing ). Order Block with Fair Value Gap Detection. Order Block in Discount | Premium zone. Filter for only Bullish, Bearish or All Order
ICT, SMC, SMART MONEY CONCEPTS, SMART MONEY, Smart Money Concept, Support and Resistance, Trend Analysis, Price Action, Market Structure, Order Blocks, BOS/CHoCH,   Breaker Blocks ,  Momentum Shift,   Supply&Demand Zone/Order Blocks , Strong Imbalance, HH/LL/HL/LH,    Fair Value Gap, FVG,  Premium  &   Discount   Zones, Fibonacci Retracement, OTE, Buy Side Liquidity, Sell Side Liquidity, BSL/SSL Taken, Equal Highs & Lows, MTF Dashboard, Multiple Time Frame, BigBar, HTF OB, HTF Market Structure, 
PRO Renko System
Oleg Rodin
5 (25)
PRO Renko Arrow Based System for trading renko charts.  准确的信号交易任何外汇工具. 另外,我将免费提供系统的附加模块! PRO Renko系统是RENKO图表上高度准确的交易系统。该系统是通用的。 该交易系统可应用于各种交易工具。 该系统有效地中和了所谓的市场噪音,打开了获得准确反转信号的通道。 该指标易于使用,只有一个参数负责产生信号。 您可以很容易地使算法适应您感兴趣的交易工具和renko酒吧的大小。 我很乐意通过提供任何咨询支持来帮助所有客户有效地使用该指标。 祝您交易成功!购买后,立即写信给我! 我将与您分享我的建议和我的renko发电机。 另外,我将免费提供系统的附加模块!
Advanced Currency IMPULSE with ALERT
Bernhard Schweigert
4.91 (495)
目前31%的折扣!! 对任何新手或专家交易者来说都是最好的解决方案! 这个指标是一个独特的、高质量的、负担得起的交易工具,因为我们已经纳入了一些专有的功能和一个秘密的公式。只需一张图表,它就能给出所有28种货币对的警报。想象一下,你的交易将如何改善,因为你能够准确地确定新趋势或剥头皮机会的触发点 建立在新的基础算法上,它使识别和确认潜在交易变得更加容易。这是因为它以图形方式显示了一种货币的强势或弱势是否正在加速,并测量了这种加速的速度--把它想象成你汽车中的速度表。当你加速时,事情显然会发生得更快,这在外汇市场上也是一样的,即如果你配对的货币正在向相反的方向加速,你就会发现一个潜在的有利可图的交易。 货币动量的垂直线和箭头将指导你的交易! 动态的市场斐波那契23水平被用作警报触发器,将适应市场活动。如果冲动触及黄色触发线,您将在MetaTrader或您的电子邮件或推送警报中收到警报。然后你就知道作为一个交易员应该做什么。货币对和方向已经给出。只要点击警报按钮,就可以切换到该货币对或打开一个新的图表,以便进一步分析。警报级别可以通过用户输入来改变,可以选择3个敏感度级别
Cycle Sniper
Elmira Memish
4.41 (37)
NEW YEAR SALE PRICE FOR LIMITED TIME!!! Please contact us after your purchase and we will send you the complimentary indicators to complete the system Cycle Sniper is not a holy grail but when you use it in a system which is explained in the videos, you will feel the difference. If you are not willing to focus on the charts designed with Cycle Sniper and other free tools we provide, we recommend not buying this indicator. We recommend watching the videos about the indiactor and system before pu
作者的更多信息
Enigmera
Ivan Stefanov
5 (4)
ENIGMERA:市场核心 https://www.enigmera.com 简介 该指标和交易系统是金融市场的一种非凡方法。ENIGMERA 利用分形周期精确计算支撑位和阻力位。它能显示真实的累积阶段,并给出方向和目标。 该系统无论在趋势中还是在修正中都能发挥作用。 它是如何运行的? ENIGMERA 由三条线组成:支撑/阻力线、目标线和偏离线。与一般市场指标将过去的数据推断为现在和未来的情况不同,该系统能提供当前的完整情况。如果你处于支撑位,这意味着真正的支撑;如果你处于阻力位,这意味着真正的阻力。如果突破某一水平,则表示趋势发生变化。没有重绘。 由于市场在不断变化,ENIGMERA 不断调整其评估工具,定期修改策略。  这保证了每种情况都能得到全面评估。这一市场指标的独特性显而易见,其能力不言而喻。  ENIGMERA 为金融分析师和咨询师提供服务,他们需要可靠的见解与客户分享,也为投资者提供服务,他们需要最精确和最可靠的保证。 该系统能够达到最佳精度,使交易者能够自信、清晰地评估他们的选择。 ENIGMERA 将 20 年的交易专长和知识整合到一个综合软件
这是最赚钱的指标。它的表现非常出色。无论市场上有什么兴趣,你都能看到。 几乎在所有情况下,它都只会给你一个长期的市场观点,但不要被愚弄,以为它是受事件约束的。不是这样的。它能找到市场上最大的利益所在,并将其展示给你。别忘了,最大的资金(利益)每天都不会在市场上出现。这是您没有遇到过的情况。月租金可能会给您一到两个信号,仅此而已。但当我们谈论大资金时,他们就是这样行事的。 如果您想了解更多,请点击这里。 这是最赚钱的指标。它的表现非常出色。无论市场上有什么兴趣,你都能看到。 几乎在所有情况下,它都只会给你一个长期的市场观点,但不要被愚弄,以为它是受事件约束的。不是这样的。它能找到市场上最大的利益所在,并将其展示给你。别忘了,最大的资金(利益)每天都不会在市场上出现。这是您没有遇到过的情况。月租金可能会给您一到两个信号,仅此而已。但当我们谈论大资金时,他们就是这样行事的。 如果您想了解更多,请点击这里。
Two Snakes
Ivan Stefanov
5 (1)
Levelss
Ivan Stefanov
LEVELSS 指标显示 - 每日看涨和看跌区域。每天从 00:00 至 23:59 都可以看到。 - 周线看涨和看跌区域。每周从周一 0:00 至周五 23:59。 - 从特定时间框架特别计算的通道,显示在所有其他时间框架上。默认情况下,这是 4 小时时间框架,您可以将其更改为您希望交易的任何其他时间框架。它是不间断计算的。 屏幕左上方显示区域和通道是看涨、看跌还是中性。当三个区域都看涨时,当前蜡烛上会出现一个绿点。当三个区域都看跌时,则出现粉红色。 该指标没有任何限制。 LEVELSS 指标显示 - 每日看涨和看跌区域。每天从 00:00 至 23:59 都可以看到。 - 周线看涨和看跌区域。每周从周一 0:00 至周五 23:59。 - 从特定时间框架特别计算的通道,显示在所有其他时间框架上。默认情况下,这是 4 小时时间框架,您可以将其更改为您希望交易的任何其他时间框架。它是不间断计算的。 屏幕左上方显示区域和通道是看涨、看跌还是中性。当三个区域都看涨时,当前蜡烛上会出现一个绿点。当三个区域都看跌时,则出现粉红色。 该指标没有任何限制。
该指标基于实际经验。 输入顶部/底部的日期/时间。 它会计算从顶部/底部到当前时刻访问次数最多的级别。 每根新蜡烛都会自动更新。 您可以针对不同的趋势和时间框架同时使用多个指标。 长度总是从您的时间段开始绘制到现在。 实用的专业工具。 该指标基于实际经验。 输入顶部/底部的日期/时间。 它会计算从顶部/底部到当前时刻访问次数最多的级别。 每根新蜡烛都会自动更新。 您可以针对不同的趋势和时间框架同时使用多个指标。 长度总是从您的时间段开始绘制到现在。 实用的专业工具。 该指标基于实际经验。 输入顶部/底部的日期/时间。 它会计算从顶部/底部到当前时刻访问次数最多的级别。 每根新蜡烛都会自动更新。 您可以针对不同的趋势和时间框架同时使用多个指标。 长度总是从您的时间段开始绘制到现在。 实用的专业工具。
Trend Angle 45
Ivan Stefanov
在交易领域,45 度角的趋势被认为是可持续的。 然而,由于没有明确的方法说明,准确测量这个关键角度仍然是一个挑战。交易者只能猜测它是如何计算的,应该有多少根蜡烛,以及适当的图表缩放比例是多少。 我们已经解决了这个问题,并从逻辑上定义了所有条件,现在向您介绍趋势角 45。这是一款基于对支撑、目标和整体走势等各种市场因素的复杂分析,将 45 度趋势线可视化的工具。 尽管 45 度趋势线通常被视为交易神话和民间传说,但 Trend Angle 45 现在已成为我们交易武器库中的一个宝贵工具,而且非常有效。它能够反映趋势的细微差别,并预测趋势开始和结束时的变化。 使其成为理想的评估工具。 时间真的很神奇! 您将面对不同市场趋势的深刻而准确的分析。 在市场周期中,价格会在 45 度线上方或下方移动,表明周期的不同阶段。 在趋势开始时,价格会在该线下方移动。在趋势过程中,价格可能沿着该线移动,在趋势结束时,甚至可能出现高于该线的极端值。除了最初的趋势阶段,其他阶段的顺序可能会有所不同。 这是一种评估外汇、股票和指数趋势的有用工具,尤其是对长期趋势而言,评估运动强度可能具有挑战
筛选:
无评论
回复评论
版本 1.1 2024.06.06
- Target levels added