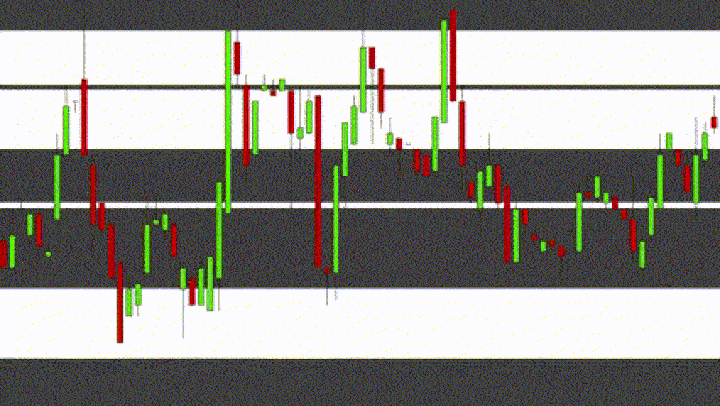
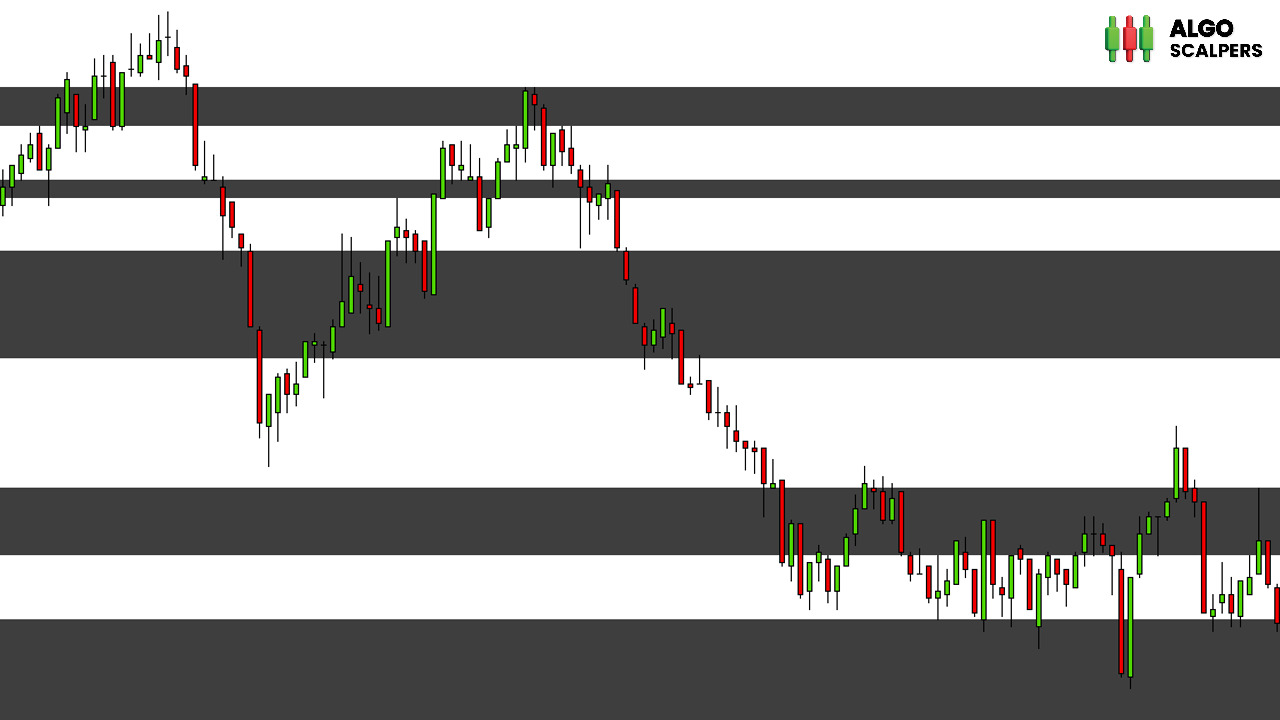
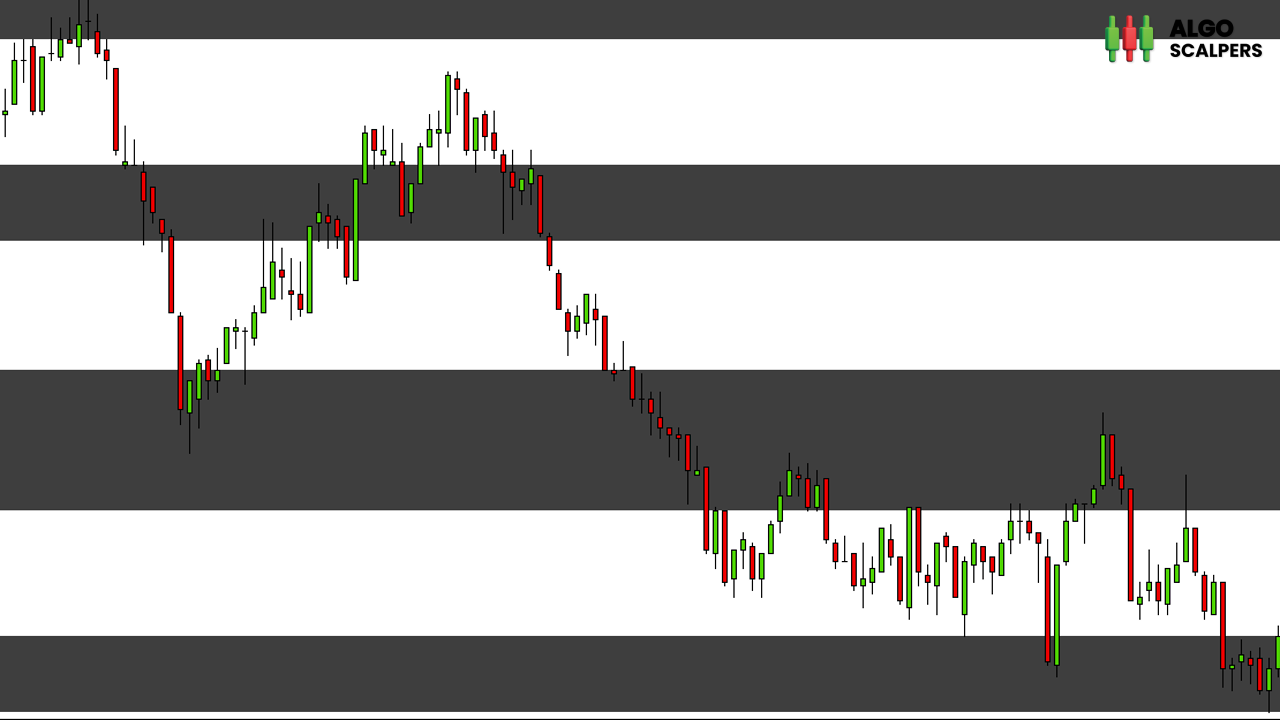
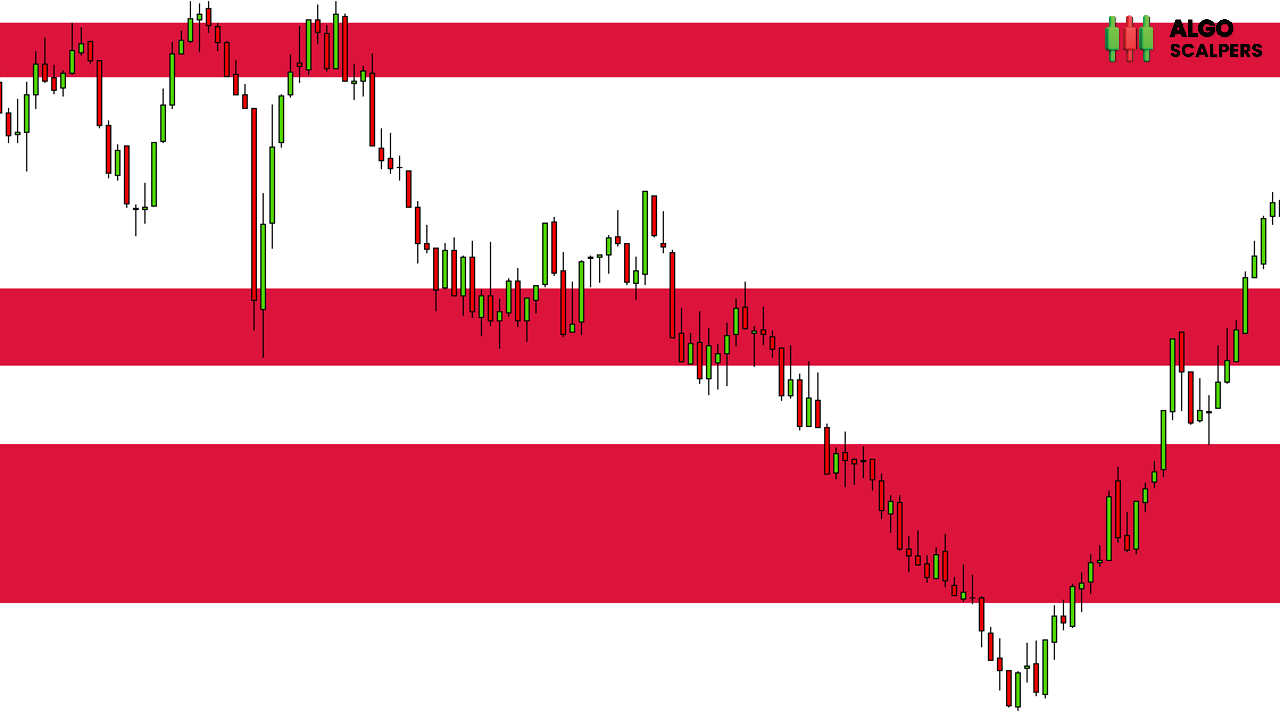
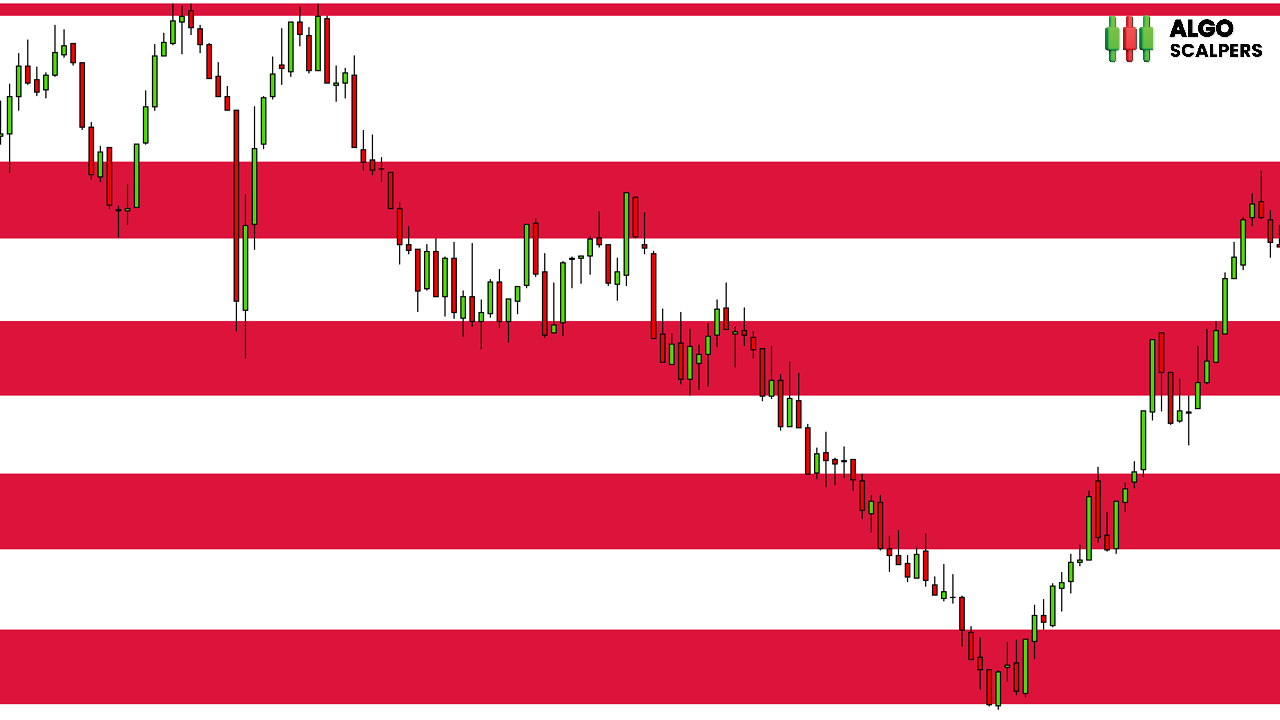
KMeans Price Zones Detector
欢迎使用 KMeans Price Zones Detector,这是一款创新的 MetaTrader 指标,利用机器学习的强大功能来识别关键的价格区间。该工具使用 KMeans 聚类算法动态检测价格数据中的中心点,突出显示价格更可能遇到支撑、阻力或整合的区域。
创新的 KMeans 算法
KMeans Price Zones Detector 之所以出众,是因为它先进地使用了 KMeans 聚类算法,这是一种在模式识别中以其效率和准确性而著称的机器学习技术。通过分析历史价格数据,指标识别代表显著价格水平的集群或中心点。然后利用这些中心点计算支撑和阻力区,为交易者提供关于潜在价格反转、突破和整合的重要信息。
主要特点
- 动态区域检测:指标根据最新的市场数据不断更新价格区域,确保交易者始终掌握最相关的信息。
- 适用于所有时间框架:无论您是在 1 分钟图表上进行短线交易还是在日线图表上进行长期投资,KMeans Price Zones Detector 都能无缝适应,提供准确的区域检测。
- 兼容所有外汇对:该指标设计用于任何外汇对,为交易多种货币的交易者提供了灵活性和多功能性。
- 全面的 ATR 集成:通过结合平均真实范围 (ATR),指标根据市场波动性调整区域的宽度,提供潜在价格走势的真实视图。
- 用户友好的可视化:指标直接在图表上绘制清晰的彩色区域,使交易者易于解释和使用这些数据。
- 自定义选项:交易者可以调整中心点数量、KMeans 迭代次数和 ATR 影响等参数,定制指标以适应他们的具体交易策略和偏好。
工作原理
- 初始化:指标通过使用历史价格数据设置中心点进行初始化。
- KMeans 聚类:KMeans 算法迭代调整中心点,最小化价格数据点与其最近中心点之间的距离,确保准确的区域检测。
- ATR 计算:计算平均真实范围 (ATR) 以确定每个区域的波动性调整宽度。
- 区域计算:根据中心点和 ATR 计算支撑和阻力区,并在图表上进行可视化显示。
- 持续更新:随着新价格数据的出现,指标不断更新区域,保持其在动态市场条件下的相关性和准确性。
为什么选择 KMeans Price Zones Detector?
- 精确性和可靠性:KMeans 算法提供精确和可靠的区域检测,帮助交易者做出明智的决定。
- 机器学习的力量:利用先进的机器学习技术在市场中获得优势。
- 适应性:适用于任何交易风格,无论是日间交易、波段交易还是长期投资。
使用 KMeans Price Zones Detector 改变您的交易策略,体验机器学习在识别关键价格区间中的强大功能。提升您的交易决策,利用这一前沿工具始终领先市场。