Market Noise MT4
- 指标
- Ivan Butko
- 版本: 1.2
- 更新: 29 五月 2024
- 激活: 10
Market Noise
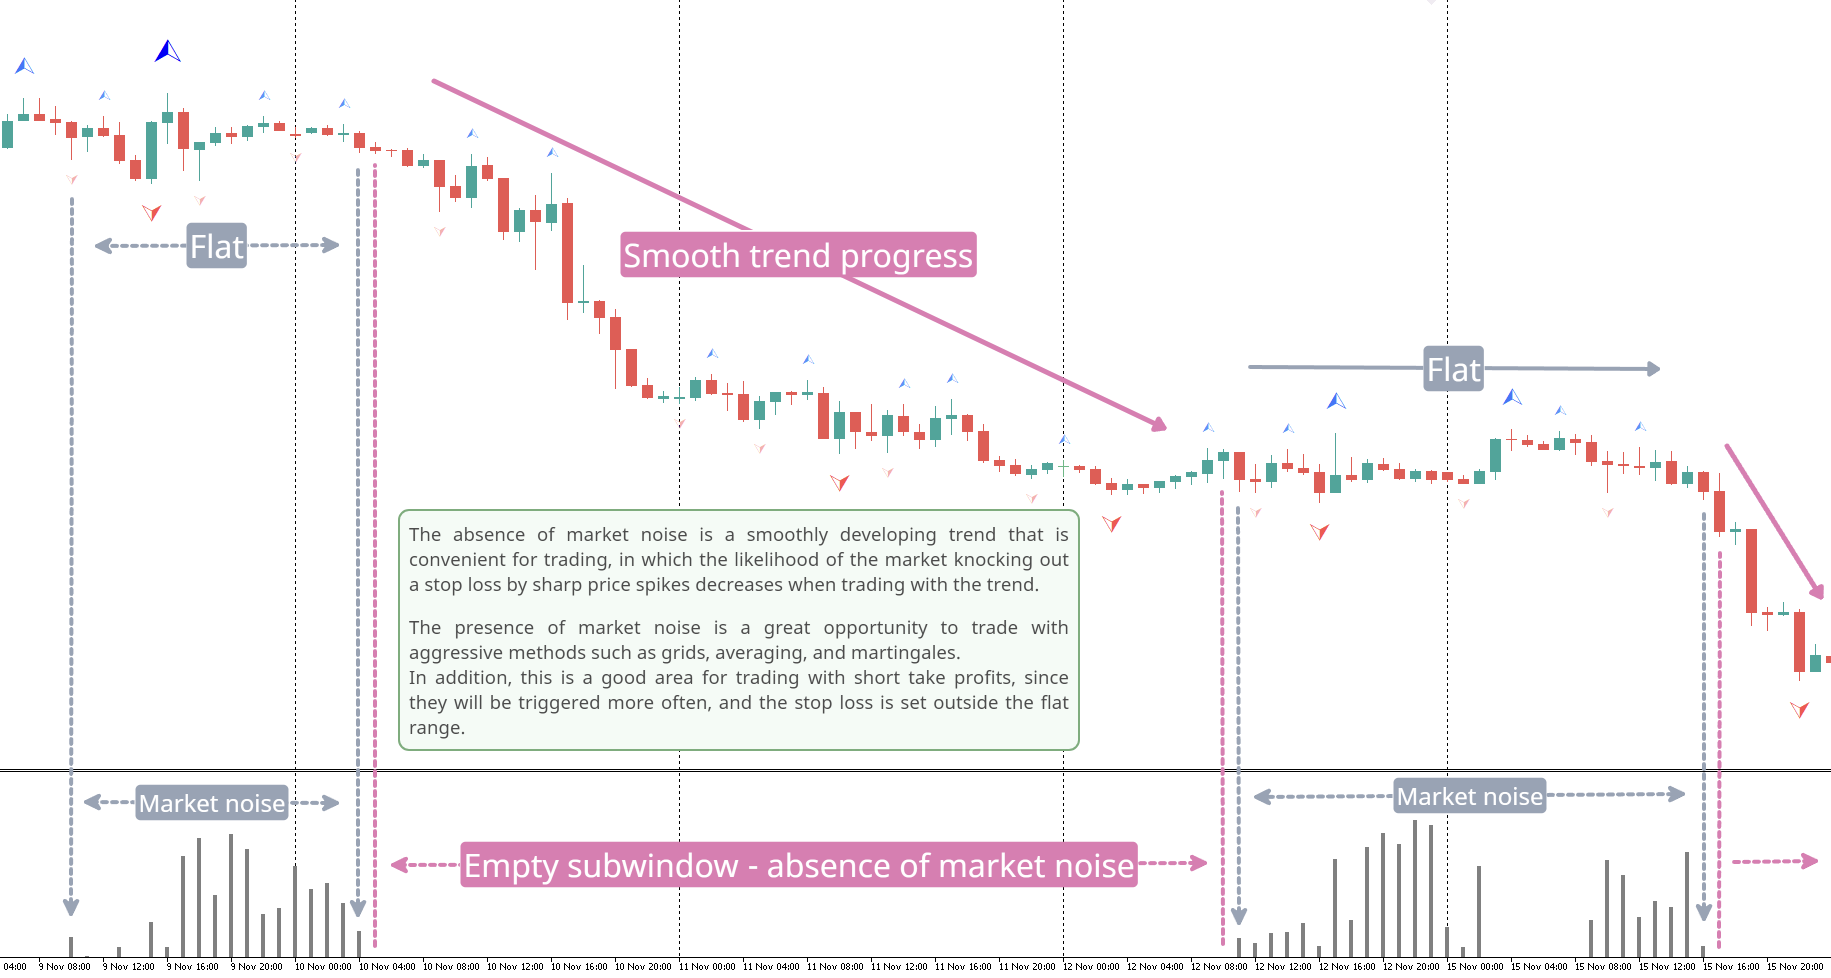
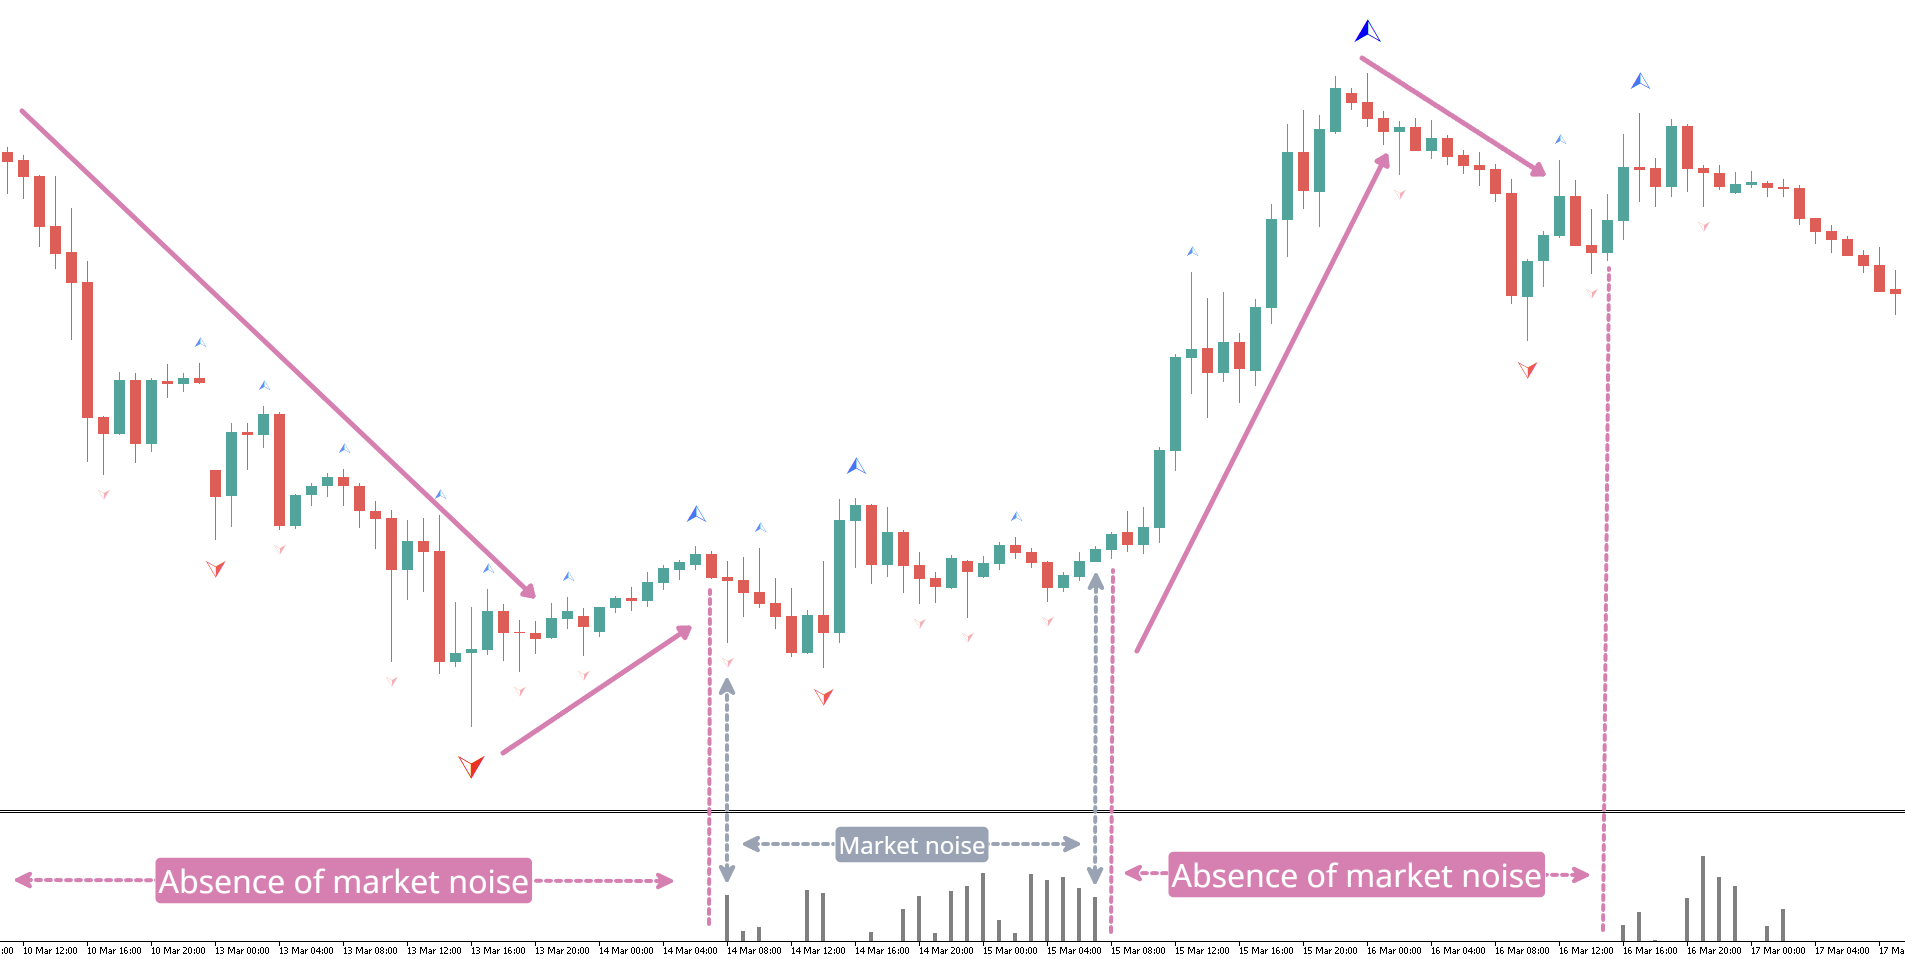
市場噪音是確定價格圖表上的市場階段的指標,並且還可以在累積或派發階段發生時區分清晰平滑的趨勢運動和嘈雜的平坦運動。
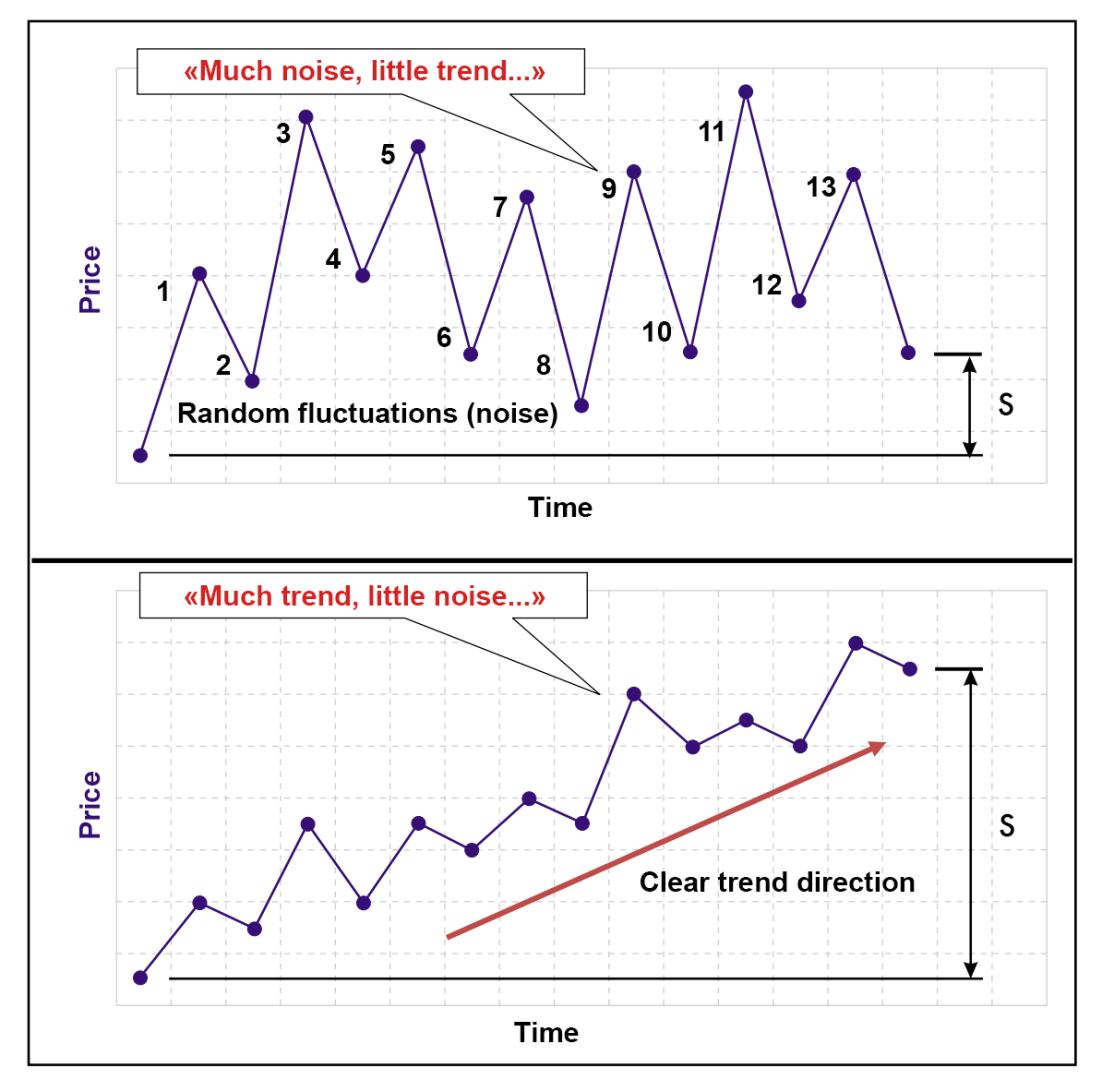
每個階段都適合自己的交易類型:趨勢適合趨勢追蹤系統,平坦適合激進型交易。 當市場噪音開始時,您可以決定退出交易。 同樣,反之亦然,一旦噪音結束,您就需要關閉激進的交易系統。 有人可以使用兩種類型的交易策略進行交易,從一種策略切換到另一種策略。 因此,該指標在交易決策領域中扮演了好助手的角色。 任何價格變動都可以分為兩個部分 - 選定時間段內的總體價格變動以及該時間段內以價格波動形式出現的噪音。 同時,不同時期的不同市場可以表現出噪音和趨勢成分之間廣泛的相互關係(圖1)。 價格變動的噪音水平越高,辨別潛在趨勢的方向和強度就越困難。 因此,在這種情況下有必要使用較慢的趨勢識別方法。 另一方面,在低噪音水平的市場中,主要趨勢很容易確定,並且更快的確定趨勢的方法是合理的,確保價格方向變化的交易訊號的滯後最小。 為了確定市場狀態,使用高級效率比 (ER),該比率基於特定時期內總價格變動與噪音市場變動總和的指數比較。效率比 (ER) 可以變化從0到1。當市場沒有定向運動,只有噪音時,ER值將為零。 當市場朝一個方向移動且完全沒有雜訊時,ER 值將等於 1。
優點
- 為趨勢交易系統定義清晰的趨勢
- 激進系統(網格、平均、馬丁格爾、靜坐)或具有高止損和低止盈的交易系統的平坦確定
- 設定很少 - 僅以柱計算週期
使用市場噪音指標作為您交易系統的補充
МТ5 - https://www.mql5.com/ru/market/product/107899
使用連結嘗試我在市場上的其他產品 https://www.mql5.com/ru/users/capitalplus/seller
祝您在交易中獲得豐厚的利潤!


Respects for the maker of this indicator: It functions as describes. There is a scenario where if I have too many indicators in the window or act fast, suddenly the data feed slows down or the indicator doesn't show in the subwindow. Overall, the indicator displays in each timeframe, filtering out the neutral side ranging market moments, revealing and leaving open space for trend taking opportunities.