• 概述
  • 评论
  • 评论

WH XDashboard MT5

Achieve the full potential of your trading indicator with XDashboard MT5, the ultimate dashboard indicator for MetaTrader 5.

Designed for traders who demand precision and efficiency, XDashboard MT5 offers an unparalleled view of any indicator across multiple symbols and timeframes,

all from a single, customizable interface.

This price is for limited time 

Features:

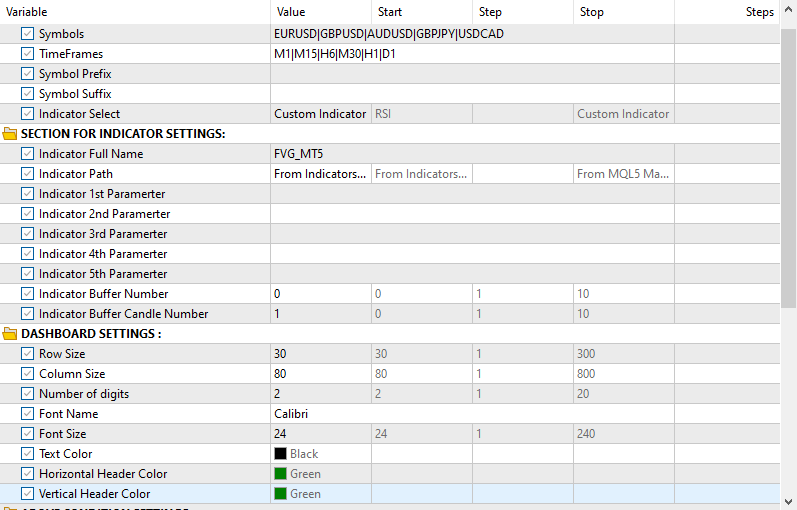
  • Custom Indicator Integration

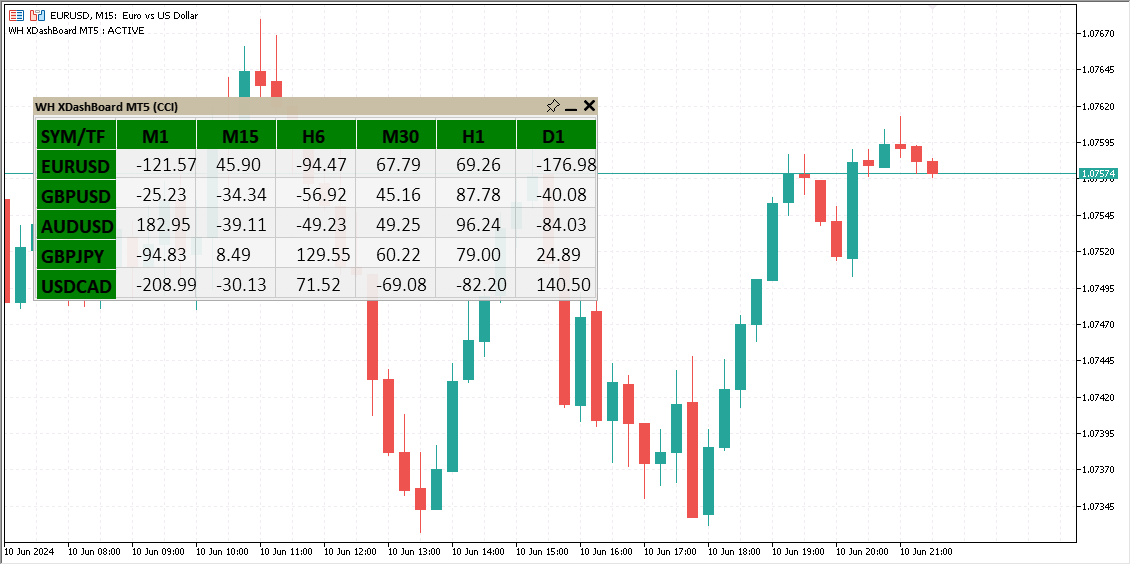
  • Comprehensive Multi-Symbol Monitoring

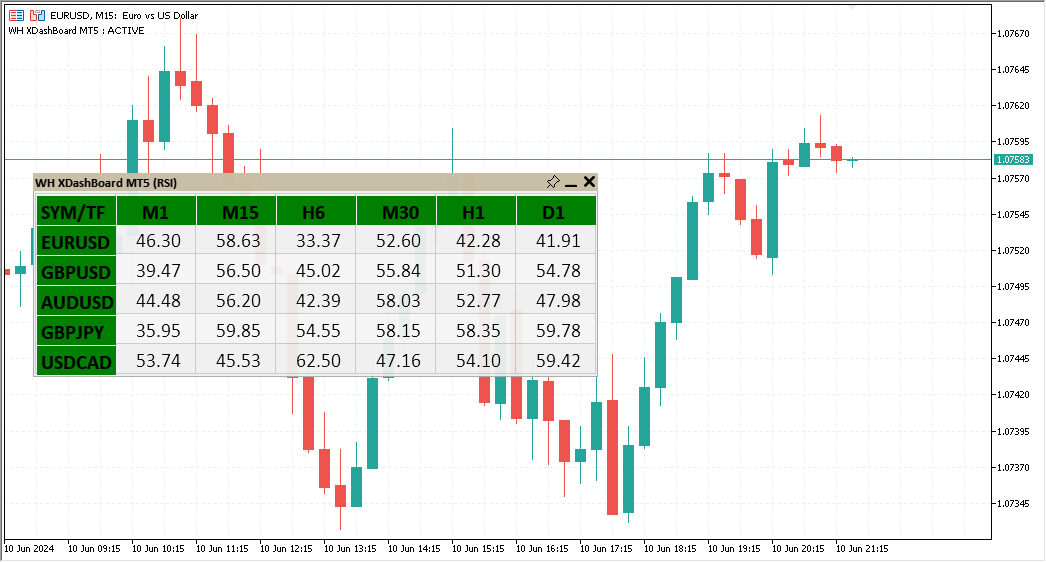
  • Multi-Timeframe Analysis 

  • User-Friendly Interface

  • Real-Time Updates

  • Flexible Alert System

  • Performance Optimization


XDashboard MT5 is not just an indicator; it’s a powerful tool that enhances your trading efficiency and effectiveness.
By providing a holistic view of the market, it allows you to make informed decisions with confidence.
Whether you are a beginner trader or a seasoned professional, indicator dashboard (XDashboard MT5) adapts to your needs and elevates your trading experience.


推荐产品
Owl Smart Levels MT5
Sergey Ermolov
4.38 (37)
MT4版本  |   FAQ Owl Smart Levels Indicator 是一個完整的交易系統,包含 Bill Williams 的高級分形、構建正確的市場波浪結構的 Valable ZigZag 以及標記準確入場水平的斐波那契水平等流行的市場分析工具 進入市場和地方獲利。 策略的详细说明 指示灯使用说明 顾问-贸易猫头鹰助手助理 私人用户聊天 ->购买后写信给我,我会将您添加到私人聊天中,您可以在那里下载所有奖金 力量在於簡單! Owl Smart Levels 交易系統非常易於使用,因此適合專業人士和剛開始研究市場並為自己選擇交易策略的人。 策略和指標中沒有隱藏的秘密公式和計算方法,所有策略指標都是公開的。 Owl Smart Levels 允許您快速查看進入交易的信號,突出顯示下訂單的水平並向您發送有關已出現信號的通知。 優點很明顯: 清楚地顯示主要和更高時間框架的趨勢方向。 指示儀器信號的出現。 標記開單、止損設置和固定利潤的水平。 沒有多餘的,只有必要的結構! ZigZag 表示全球趨勢的方向,因此也表示貿易方向。 市場反轉點的短線清楚地表明在什麼水平上構建斐波
MACDivergence MTF MT5
Pavel Zamoshnikov
4.17 (6)
Advanced ideas of the popular MACD indicator: It detects and displays classic and reverse divergences (two methods of detecting divergences). It uses different color to highlight an uptrend and a downtrend. Two methods of determining a trend: а) MACD crosses the 0 level (classic signal); б) MACD crosses its own average (early signal). This is a multi-timeframe indicator: it can display MACD data from other timeframes. Two methods of drawing: classic histogram and line. It generates sound and vis
Noize Absorption Index
Ekaterina Saltykova
Noize Absorption Index - is the manual trading system that measures the difference of pressure between bears forces and bulls forces. Green line - is a noize free index that showing curent situation. Zero value of index shows totally choppy/flat market.Values above zero level shows how powerfull bullish wave is and values below zero measures bearish forces.Up arrow appears on bearish market when it's ready to reverse, dn arrow appears on weak bullish market, as a result of reverse expectation.
Antique Trend
Nadiya Mirosh
The Antique Trend Indicator is a revolutionary trend trading and filtering solution with all the important features of a trend tool built into one tool! The Antique Trend indicator is good for any trader, suitable for any trader both for Forex and binary options. There is no need to configure anything, everything has been perfected by time and experience, it works great during flats and trends. The Antique Trend indicator is a tool for technical analysis of financial markets, reflecting curre
Supertrend indicator uses a combination of a moving average and average true range to detect the trend of a trading instrument. Supertrend indicator for MetaTrader 5 easily shows the trend as a line following the price. Triple SuperTrend Histo indicator  calculate  three supertrends to show the trend as a histogram. Changing the color from red to green means you can BUY , from green to red means you can SELL . Description of the method of drawing a histogram. The price is above the EMA 20
HMA Trend Professional MT5
Pavel Zamoshnikov
4.5 (6)
Improved version of the free HMA Trend indicator (for MetaTrader 4) with statistical analysis. HMA Trend is a trend indicator based on the Hull Moving Average (HMA) with two periods. HMA with a slow period identifies the trend, while HMA with a fast period determines the short-term movements and signals in the trend direction. The main differences from the free version: Ability to predict the probability of a trend reversal using analysis of history data. Plotting statistical charts for analyz
Double HMA MTF for MT5
Pavel Zamoshnikov
3.67 (3)
This is an advanced multi-timeframe version of the popular Hull Moving Average (HMA) Features Two lines of the Hull indicator of different timeframes on the same chart. The HMA line of the higher timeframe defines the trend, and the HMA line of the current timeframe defines the short-term price movements. A graphical panel with HMA indicator data from all timeframes at the same time . If the HMA switched its direction on any timeframe, the panel displays a question or exclamation mark with a tex
Trend Monitor MT5
Pavel Zamoshnikov
3.67 (3)
The indicator generates early signals basing on ADX reading data combined with elements of price patterns. Works on all symbols and timeframes. The indicator does not redraw its signals. You see the same things on history and in real time. For better visual perception signals are displayed as arrows (in order not to overload the chart). Features The best results are obtained when the indicator works on two timeframes. For example: M30 – the indicator shows the main trend; M5 – the indicator ge
Buy CTS scalping indicator, provide buying and selling signals, automatic channeling and sending signals to mobile phones Using technical analysis and price action methods and modern methods, CTS indicator can draw price channels and recognize price trends with high accuracy and issue entry and exit signals according to them. Traders can easily fluctuate using this indicator in different time frames and in different markets. With the CTS indicator, you can signal in different ways. This indicat
Gekko MACD Plus
Rodrigo Galeote
3 (3)
Type: Oscillator This is Gekko's Cutomized Moving Average Convergence/Divergence (MACD), a customized version of the famous MACD indicator. Use the regular MACD and take advantage of several entry signals calculations and different ways of being alerted whenever there is potential entry point. Inputs Fast MA Period: Period for the MACD's Fast Moving Average (default 12); Slow MA Period: Period for the MACD's Slow Moving Average (default 26); Signal Average Offset Period: Period for the Signal
Paula Bollinger Bands Strategy
Francisco Gomes Da Silva
4 (2)
Bollinger bands out/in strategy A strategy created by Joe Ross, and very useful for finding trades when the market is overloaded. Indicator You don't need to find where there are entries on the chart, this indicator shows them for you. The entrance The trade is confirmed when the price closes outside the bollinger bands on a candle and the candle after the price closes inside the bands. comment I want to improve this indicator, so you can help me sending me your reviews and comments, thanks :).
FREE
Stochastic R
Antony Augustine
Stochastic  Reversal  allows you to recognize reversals professionally. Stochastic Indicator: This technical indicator was developed by George Lane more than 50 years ago. The reason why this indicator survived for so many years is because it continues to show consistent signals even in these current times. The Stochastic indicator is a momentum indicator that shows you how strong or weak the current trend is. It helps you identify overbought and oversold market conditions within a trend.  Rules
TrendDetect
Pavel Gotkevitch
The Trend Detect indicator combines the features of both trend indicators and oscillators. This indicator is a convenient tool for detecting short-term market cycles and identifying overbought and oversold levels. A long position can be opened when the indicator starts leaving the oversold area and breaks the zero level from below. A short position can be opened when the indicator starts leaving the overbought area and breaks the zero level from above. An opposite signal of the indicator can
用於確定平面和趨勢的指標。 如果價格低於兩條直方圖和兩條線(紅色和藍色)中的任何一條,則這是一個賣出區域。 購買此版本的指標時,一個真實賬戶和一個模擬賬戶的 MT4 版本 - 作為禮物(收到,給我寫私信)! 如果價格高於兩條直方圖和兩條線(紅色和藍色)中的任何一條,則這是一個買入區域。 MT4 版本: https://www.mql5.com/en/market/product/3793 如果價格在兩條線之間或在任何直方圖的區域內,那麼市場就沒有明確的趨勢。簡單地說,市場是平的。 指標的工作在屏幕截圖中更清楚地顯示。 該指標可用作獨立的交易系統。該指標可用於獲取領先數據或確定當前趨勢的方向。對於任何級別的交易者來說,這都是一個很好的工具!
PZ Trend Trading MT5
PZ TRADING SLU
3.67 (3)
许多盈利交易者不仅知道如何识别市场趋势,而且也能把握趋势建立后的交易机会。 Pz 趋势交易 指标设计用来在趋势行情中尽可能的赚取利润。 已建立的趋势提供了一揽子交易机会,但大多数趋势交易指标完全忽视了它们,让交易者在趋势行情时完全不知道该如何做!一般趋势指标只通知有关的趋势变化,但根本不足以得到卓越的回报. Pz 趋势交易 指标比一般趋势指标显示多达 20 倍的交易 , 因为它注重所谓的市场时机。它不仅显示当前的市场趋势,也有回调,内柱线的突破和调整。它令您在趋势回调之后介入,安全的柱线内突破金字塔加仓,以及发现潜在的反转,和已知的调整。 趋势改变 一个趋势改变在市场方向变化时发生。趋势变化在图表上用带数字的彩色圆圈显示。蓝色 (1) 信号为上涨开始, 而红色 (1) 信号为下跌开始。趋势变化并非评估当前价格动作的结果, 它意味着交易设置是不定时地。如果您正确使用本指标, 在趋势变化时, 您将将已经入场 (参看下面的调整)。 回调 但凡趋势在运动中,行情上下抖动,盈利者收割利润,且其它参与者入场。趋势回调代表好的买入机会,通常是由主力获利离场导致。如果行情在回调后回归上行, 指
This scanner shows the trend values of the well known indicator SuperTrend for up to 15 instruments and 21 time frames. You can get alerts via MT5, Email and Push-Notification as soon as the direction of the trend changes. Important Information You have many possibilities to use the scanner. Here are two examples: With this scanner you can trade a top-down approach easily. If two higher time frames e.g. W1 and D1 are already showing green values (upward trend) but the H12 time frame shows a re
Rainbow EA MT5
Jamal El Alama
Description : Rainbow EA MT5 is a simple Expert advisor based on   Rainbow MT5 indicator witch is based on Moving average with period 34. The indicator is incorporated in the EA, therefore, it is not required for the EA to operate, but if you wish, you can download it from   my product page . The Expert Advisor settings are as follows : Suitable for Timeframes up to H1 The parameters below can be set according to your trading rules. StopLoss ( Stop Loss in pips) TakeProfit ( Take Profit in pi
Riko Trend mt5
Nadiya Mirosh
The Riko Trend indicator is a revolutionary trend trading and filtering solution with all the important features of a trend tool built into one tool! The Riko Trend indicator is good for any trader, suitable for any trader for both forex and binary options. You don’t need to configure anything, everything is perfected by time and experience, it works great during a flat and in a trend. The Riko Trend indicator is a technical analysis tool for financial markets that reflects the current price
How to use Pair Trading Station Pair Trading Station is recommended for H1 time frame and you can use it for any currency pairs. To generate buy and sell signal, follow few steps below to apply Pair Trading Station to your MetaTrader terminal. When you load Pair Trading Station on your chart, Pair Trading station will assess available historical data in your MetaTrader platforms for each currency pair. On your chart, the amount of historical data available will be displayed for each currency pai
Gekko RSI Plus
Rodrigo Galeote
This is Gekko's Cutomized Relative Strength Index (RSI), a customized version of the famous RSI indicator. Use the regular RSI and take advantage two entry signals calculations and different ways of being alerted whenever there is potential entry or exit point. Inputs Period: Period for the RSI calculation; How will the indicator calculate entry (swing) signals: 1- Produces Exit Signals for Swings based on RSI entering and leaving Upper and Lower Levels Zones; 2- Produces Entry/Exit Signals fo
Big Black Shark MT5
Yaroslav Varankin
Tool for Identifying Potential Reversal Points and Trend Direction This tool is excellent for identifying potential reversal points and trend direction in the market. It works well with confirming indicators such as MACD, Stochastic, RSI - standard indicators available on all MT5 platforms. Together with them, it forms a reliable strategy. In the settings, you can adjust the channel distance and period. It is recommended to enter a trade when the signal line crosses the upper channel bounda
To download MT4 version please click here . - This is the exact conversion from TradingView: "Trend Direction Force Index - TDFI [wm]" By "causecelebre". - This indicator uses multiple levels of averaging to detect trend strength. - You can optimize filter low and filter high levels to achieve best results. - You have access to buffers to use in EAs. - This is a light-load processing and non-repaint indicator. - You can message in private chat for further changes you need.
This indicator combines double bottom and double top reversal chart patterns together with detection of divergences between the price chart and the MACD oscillator. Features Easily detect strong reversal signals Allows to use double top/bottom and MACD divergence signals combined or independently Get email and/or push notification alerts when a signal is detected Custom colors can be used The indicator is not repainting Can easily be used in an EA (see below) Inputs ENABLE Double Top - Botto
Point Black
Ignacio Agustin Mene Franco
Black Card Pack indicator 5/1 point black It has the strategy of professional bollingers where each arrow gives you a different entry signal. It is used to operate in m1 and in d1 It is used for scalping and intraday, modified for forex markets ! suitable for all pairs modified for synthetic index markets suitable for all pairs! Ideal for volatility and jumps!
This indicator obeys the popular maxim that: "THE TREND IS YOUR FRIEND" It paints a Blue line for BUY and also paints a RED line for SELL. (you can change the colors). It gives alarms and alerts of all kinds. IT DOES NOT REPAINT COLOR and can be used for all currency pairs and timeframes. Yes, as easy and simple as that. Even a newbie can use it to make great and reliable trades. https://www.mql5.com/en/market/product/115553
Renko System
Marco Montemari
This indicator can be considered as a trading system. It offers a different view to see the currency pair: full timeless indicator, can be used for manual trading or for automatized trading with some expert advisor. When the price reaches a threshold a new block is created according to the set mode. The indicator beside the Renko bars, shows also 3 moving averages. Features renko mode median renko custom median renko 3 moving averages wicks datetime indicator for each block custom notificatio
DYJ超级趋势波是一个高度准确的波峰波谷交易系统。 这个指标在进出市场时寻找蜡烛线的最高点和最低点。 入口价格在最高点或者最低点附近. 信号的通知类型已被添加到DYJ超级趋势波。 当产生多空间信号时, 可以使用以下类型的通知信号: Alert mailSend MobilePush 参数 InpSignalPeriod = 10 BarDistance = 24 InpIsAlert = true ========================== DYJ SuperTrendWave is a highly accurate trading system. This indicator looks for the highest and lowest points of candles as entering and leaving the market. The notification type of signal has been added to the dyj supertrend. When a multi-space signal is generated, T
Renko Gold
Ignacio Agustin Mene Franco
Renko Gold! clearly indicates the floors and ceilings where it goes from 4 lines, the line below that marks the floor in green confirming with the thinnest line clarifies the purchase entry, the same is for sale, the top line marks the ceiling and the thinnest red line marks the sale, This indicator works for all temporalities! For Forex and Synthetic Indices markets! It also works for crypto markets! Good profit! World Investor.
Golden Swings
Arnold Byarufu
"GoldenSwing" is a comprehensive MetaTrader 5 indicator meticulously crafted by Southern Star Trading, designed to enhance your trading strategies with precision swing high and swing low identification. Harnessing the power of swing analysis, this indicator provides traders with invaluable insights into market reversals and trend continuations, enabling them to make informed trading decisions. With its advanced algorithm, GoldenSwing detects significant swing highs and swing lows in real-time
该产品的买家也购买
Atomic Analyst MT5
Issam Kassas
5 (14)
首先值得强调的是,该交易指标是非重绘、非延迟的指标,这使其成为手动和机器人交易的理想选择。 用户手册:设置、输入和策略。 Atomic Analyst是一种PA价格行动指标,利用价格的力量和动量来寻找市场上更好的机会。配备了高级过滤器,可帮助去除噪音和假信号,并提高交易潜力。使用多层复杂的指标,Atomic Analyst扫描图表,并将复杂的数学计算转化为任何初学者都能理解并用来做出一致交易决策的简单信号和颜色。 “Atomic Analyst”是专为新手和经验丰富的交易者量身定制的综合交易解决方案。它将高级指标和一流功能融合为一体的交易策略,使其成为所有类型交易者的多功能选择。 日内交易和剥头皮策略:专为快速准确的日内交易和短期交易而设计。 日内和摆动交易策略:可用作追求价格大幅波动的日内和摆动交易者的可靠工具。 多货币和市场:凭借其可靠的精度,在不同的工具和市场上运作。 多个时间框架:可在多个时间框架上使用,性能良好。 稳定性:所有指标均不重绘、不重绘和不滞后,确保可靠的信号。 信号清晰度:提供箭头信号,用于清晰的入场和出场点。 实时警报:通过交易入场、SL和TP警报通知交
首先,值得强调的是,这个交易系统是一个非重绘、非重画和非滞后的指标,这使得它非常适合手动和机器人交易。 在线课程,手册和下载预设。 “智能趋势交易系统 MT5”是专为新手和经验丰富的交易者量身定制的综合交易解决方案。它结合了超过 10 个优质指标,具有 7 多个强大的交易策略,使其成为适用于各种市场条件的多功能选择。 趋势跟随策略:提供精确的入场和止损管理,以有效地跟随趋势。 反转策略:识别潜在的趋势反转,使交易者能够利用区域市场的机会。 剃头策略:专为快速准确的日内交易和短期交易而设计。 稳定性:所有指标都不会重绘、不会重画和不会滞后,确保可靠的信号。 定制:支持自定义策略,以满足个人交易偏好。超过 7 种策略和组合可帮助您找到最佳策略。 信号清晰度:提供箭头信号,以指示清晰的入场和退出点。 实时警报:通过交易进出警报使交易者保持了解。 深入分析:提供更高时间框架的趋势分析和实时交易监控。 自适应颜色编码:利用蜡烛颜色编码来显示成交量、趋势和反转蜡烛信号。通过蜡烛颜色分析市场方向。 “智能趋势交易系统 MT5”赋予交易者必要的工具,以便在各种市场条件下做出明智和战略性的交易决策。无论
Quantum Trend Sniper
Bogdan Ion Puscasu
4.91 (43)
介绍   量子趋势狙击指标 ,突破性的 MQL5 指标,正在改变您识别和交易趋势反转的方式!由拥有超过13年交易经验的资深交易员团队开发,     量子趋势狙击指标   旨在通过其创新的方式以极高的准确度识别趋势反转,将您的交易之旅推向新的高度。 ***购买量子趋势狙击指标,即可免费获得量子突破指标!*** 当量子突破指标识别出趋势反转时,它会向您发出警报和信号箭头,并建议您三个止盈水平。 它既适合新手交易者,也适合专业交易者。 量子 EA 通道:       点击这里 MT4版本:       点击这里 建议: 时间范围: 所有时间范围。为了获得最佳结果,我们建议在 M15、M30 和 H1 时间范围内使用它。 货币对:欧元兑美元、英镑兑美元、澳元兑美元、欧元兑英镑、, EURAUD,  XAUUSD 账户类型:ECN、Raw 或 Razor,点差极低 经纪时间:任意 经纪商:IC Markets、Pepperstone with Raw 和 Razor 的点差最低 建议止损:50 点 建议止盈水平:20 点、50 点和
FX Power MT5 NG
Daniel Stein
5 (5)
通过 mql5 和 Telegram 上 的晨间简报获取每日市场更新,包括详细信息和屏幕截图 ! FX Power MT5 NG 是我们长期以来非常受欢迎的货币强度计算器 FX Power 的下一代产品。 这款下一代强度计算器能提供什么?您所喜爱的原版 FX Power 的所有功能 附加功能 黄金/XAU 强度分析 更精确的计算结果 可单独配置的分析周期 可自定义计算限制,以获得更好的性能 为希望查看更多信息的用户提供特殊的多实例设置 无尽的图形设置,可在每个图表中设置您最喜欢的颜色 无数的通知选项,让您再也不会错过任何重要信息 采用 Windows 11 和 macOS 风格的全新圆角设计 神奇的移动指标面板 FX Power 主要功能 所有主要货币的完整强势历史 所有时间框架内的货币强弱历史 所有经纪商和图表的计算结果完全相同 100% 可靠的实时计算 -> 无重绘 可通过下拉列表选择分析时段 通过自定义模式单独配置分析时段 可在一个图表中使用多个实例 可移动 FX Power 显示屏(通过拖放) 适用于高分辨率 QHD、UHD 和 4K 显示器 自动终端配置 针对平板电脑
首先,值得强调的是,这个交易工具是非重绘、非重画和非滞后的指标,非常适合专业交易。 在线课程,用户手册和演示。 智能价格行动概念指标是一个非常强大的工具,既适用于新手,也适用于经验丰富的交易者。它将超过20个有用的指标合并到一个指标中,结合了高级交易思想,如内圈交易员分析和智能资金概念交易策略。该指标侧重于智能资金概念,提供有关大型机构交易方式的见解,帮助预测它们的动向。 它在流动性分析方面尤其擅长,有助于理解机构的交易方式。它擅长预测市场趋势,并仔细分析价格波动。通过将您的交易与机构策略对齐,您可以更准确地预测市场走向。该指标多才多艺,擅长分析市场结构,识别重要的订单区块,并识别各种模式。 它擅长识别BOS和CHoCH等模式,理解动量的转变,并突出显示供需强劲的关键区域。它还擅长发现强大的不平衡,并分析价格创造更高高点或更低低点的模式。如果您使用斐波那契回撤工具,该指标可以满足您的需求。它还可以识别相等的高点和低点,分析不同的时间框架,并通过仪表板显示数据。 对于使用更高级策略的交易者,该指标提供了工具,如公平价值差指标和优惠和折扣区域的识别。它特别关注高时间框架订单
Trend Screener Pro MT5
STE S.S.COMPANY
4.88 (64)
使用趋势筛选指标释放趋势交易的力量:由模糊逻辑和多货币系统提供支持的终极趋势交易解决方案! 使用趋势筛选器(由模糊逻辑提供支持的革命性趋势指标)提升您的趋势交易。 它是一个强大的趋势跟踪指标,结合了超过 13 种高级工具和功能以及 3 种交易策略,使其成为使您的 Metatrader 成为趋势分析器的多功能选择。 限时优惠:趋势筛选指标终身仅需 50 美元。 ( 原价 125$ ) (优惠延长) 体验趋势筛选器 100% 无需重新绘制的准确性,确保您的交易决策不受过去价格变化的影响。 释放多时间框架和多货币功能的多功能性,使您能够以无与伦比的信心在外汇、商品、加密货币和指数领域进行交易。 利用 Trend Screener 的综合策略套件增强您的交易: - 趋势跟踪策略和趋势延续策略 :趋势筛选器的趋势跟踪策略提供清晰的趋势延续信号,让您有效捕捉趋势走势并管理风险。 - 反转策略和早期入场点策略 :趋势筛选器的反转策略可检测市场方向的潜在变化,使您能够预测趋势反转并利用疲弱的市场趋势。通过早期入场点,您可以在潜在的趋势变化之前定位自己 获取可观的利润。 - 倒卖策略: 趋势筛选器的倒卖
FX Volume MT5
Daniel Stein
4.94 (17)
通过 mql5 和 Telegram 上 的 " 晨间简报 "获取每日市场更新,包括详细信息和屏幕截图 ! 外汇交易量(FX Volume)是第一个也是唯一一个从经纪商角度真正洞察市场情绪的交易量指标。 直接在您的图表上看到这些信息是真正改变游戏规则和突破性的交易解决方案。 受益于独特的市场数据洞察,如 比率(Ratios )显示货币多头和空头头寸的比率(百分比 比率变化 显示所选时间段内的多头比率及其百分比变化 总交易量 显示货币的总交易量(多头和空头),以手为单位 多头 交易量显示货币所有多头头寸的交易量 空头 交易量显示所有货币空头头寸的交易量 净多头 显示净多头交易量,即所有多头头寸减去所有空头头寸(以手为单位)。 净多头百分比 显示货币净多头交易量的变化 请阅读我们的基本教程 -> "如何使用外汇交易量进行交易 " 获取更多信息,如常见问题、交易技巧和教程视频,请访问我们的 外汇交易量公共信息频道 请 安装并运行 SI Connect 以建立与我们数据中心的持续连接 背景信息 我们都知道,外汇是一个分散的市场。这就是为什么我们必须打破常规思维,开发一个独
TPSpro RFI Levels MT5
Roman Podpora
5 (8)
Reversal First Impulse levels (RFI)      INSTRUCTIONS        RUS       -       ENG              R ecommended to use with an indicator   -   TREND PRO -  Version MT4                 A key element in trading is zones or levels from which decisions to buy or sell a trading instrument are made. Despite attempts by major players to conceal their presence in the market, they inevitably leave traces. Our task was to learn how to identify these traces and interpret them correctly. Main functions:: Di
Bill Williams Advanced
Siarhei Vashchylka
5 (5)
Bill Williams Advanced is designed for automatic chart analysis using Bill Williams' "Profitunity" system. The indicator analyzes four timeframes at once. Manual (Be sure to read before purchasing) Advantages 1. Automatically analyzes the chart using the "Profitunity" system of Bill Williams. The found signals are placed in a table in the corner of the screen. 2. Equipped with a trend filter based on the Alligator indicator. Most of the system signals are recommended to be used only accordi
Entry Points Pro for MT5
Yury Orlov
4.55 (159)
这款指标用于 MT5,可提供准确的入场交易信号,且无重绘。 它可应用在任何金融资产:外汇、加密货币、贵金属、股票、指数。 它将提供极其精准的评估,并告诉您何时开仓和平仓的最佳时机。 观看 视频 (6:22),其中包含一个仅处理单一信号的示例,该信号即可值回指标购价! 大多数交易者在 Entry Points Pro 指标的帮助下,在第一个交易周内即改善了他们的交易结果。 订阅我们的 Telegram 群 ! Entry Points Pro 指标的益处。 入场信号无重绘 如果信号出现,并得到确认,则它不会再消失;不像是重绘指标,它会导致重大的财产损失,因为它们可以在显示信号后再将其删除。 无差错开仓 指标算法可令您找到入场交易(买入或卖出资产)的理想时机,从而提高每位交易者的成功率。 Entry Points Pro 可操作任何资产 它允许您在 MT5 平台上交易任何经纪商的加密货币、股票、贵金属、指数、大宗商品和货币。 提供任何方向的信号 Entry Points Pro 指标提供针对任意价格走势的入场交易信号 - 上涨、下跌或横盘(横向)。
ICT, SMC, SMART MONEY CONCEPTS, SMART MONEY, Smart Money Concept, Support and Resistance, Trend Analysis, Price Action, Market Structure, Order Blocks, BOS/CHoCH,   Breaker Blocks ,  Momentum Shift,   Supply&Demand Zone/Order Blocks , Strong Imbalance,   HH/LL/HL/LH,    Fair Value Gap, FVG,  Premium  &   Discount   Zones, Fibonacci Retracement, OTE, Buy Side Liquidity, Sell Side Liquidity, BSL/SSL Taken, Equal Highs & Lows, MTF Dashboard, Multiple Time Frame, BigBar, HTF OB, HTF Market Structure
成為突破者,隨著價格反轉,市場結構會改變利潤。 訂單突破者指示器可以識別趨勢或價格走勢何時接近枯竭並準備好逆轉。它會提醒您市場結構的變化,通常會在發生逆轉或重大回調時發生。 該指標使用專有計算來確定突破和價格動能。每當在可能的耗盡點附近形成新的高點時,指標就會繪製最後一個生成該高點的順序塊。然後,它將隨價格移動隨價格跟隨定單。然後,當價格轉向相反方向並突破該訂單塊時,它會提醒您,從而創建新的市場結構並開始趨勢或重大回調的可能逆轉。 訂單塊是在創建高/低之前的最後一個相反的彩色蠟燭,並且當價格跌破這些關鍵區域以下時,這表明趨勢可能會發生短期或長期反轉。 特徵 提醒您關鍵耗盡點的市場結構變化 價格接近耗盡水平時自動提取訂單塊 在一個方向繼續移動時,在價格後面跟踪定單,以提醒您最佳的反轉輸入 將顏色更改為純色塊,以顯示何時發生市場結構中斷。 適用於所有交易品種和時間範圍 內置集成的彈出窗口和電子郵件警報 策略和如何與定單破壞者指標進行交易 當斷路器塊發生時,您有兩個選擇。 看左邊!我們正在尋求供應/需求或支撐/阻力位嗎?市場結構轉變(逆轉)通常發生在價格重新測試舊水平或
The 1 2 3 Pattern Scanner MT5
Reza Aghajanpour
5 (14)
** All Symbols x All Timeframes scan just by pressing scanner button ** ***Contact me after purchase to send you instructions and add you in "123 scanner group" for sharing or seeing experiences with other users. After 17 years of experience in the markets and programming, Winner indicator is ready. I would like to share with you! Introduction The 123 Pattern Scanner indicator with a special enhanced algorithm is a very repetitive common pattern finder with a high success rate . Interestingly,
介绍     Quantum Breakout PRO   ,突破性的 MQL5 指标,正在改变您交易突破区域的方式!由拥有超过13年交易经验的资深交易员团队开发,     量子突破 PRO     旨在通过其创新和动态的突破区域策略将您的交易之旅推向新的高度。 量子突破指标将为您提供带有 5 个利润目标区域的突破区域的信号箭头,以及基于突破框的止损建议。 它既适合新手交易者,也适合专业交易者。 量子 EA 通道:       点击这里 重要的!购买后请私信我领取安装手册。 建议: 时间范围:M15 货币对:GBPJPY、EURJPY、USDJPY、NZDUSD、XAUUSD 账户类型:ECN、Raw 或 Razor,点差极低 经纪商时间:GMT +3 经纪商:IC Markets、Pepperstone with Raw 和 Razor 的点差最低 规格: 不重漆! 最多 5 个建议利润目标区域 建议止损水平 可定制的盒子。您可以设置自己的 Box Time Start 和 Box Time End。 接触 如果您有任何疑问或需要帮
AW Trend Predictor MT5
AW Trading Software Limited
4.78 (58)
一个系统中趋势和故障水平的组合。先进的指标算法过滤市场噪音,确定趋势、进入点以及可能的退出水平。指标信号记录在统计模块中,您可以选择最合适的工具,显示信号历史的有效性。该指标计算获利和止损标记。 手册和说明 ->   这里 / MT4 版本 ->   这里 如何使用指标进行交易: 使用趋势预测器进行交易只需三个简单的步骤: 第 1 步 - 开仓 收到买入信号,成功率超过 70% 第 2 步 - 确定止损 通过相反的信号选择中继线 第 3 步 - 定义止盈策略 策略一:达到 TP1 时平仓 策略 2:达到 TP1 时平仓 50%,达到 TP2 时平仓剩余 50% 策略三:在趋势反转时平仓 好处: 从不重绘结果,信号严格位于蜡烛收盘时 它可以在顾问中使用 获利和止损标记 对交易策略或独立策略的重要补充 市场噪音过滤算法 适用于任何工具 统计模块: 为了更好地选择配对,请使用内置的统计计算。 计算交易 - 给出统计数据的信号总数 成功评级 - 达到 TP1 的信号百分比,或反转那些正获利的信号时的百分比 TakeProfit1 Hit - 达到 TP1 的信号百分比 TakeProfit2
IX Power MT5
Daniel Stein
5 (3)
IX Power 终于将 FX Power 的无与伦比的精确性带到了非外汇交易符号中。 它能准确判断您喜爱的指数、股票、商品、ETF 甚至加密货币的短期、中期和长期趋势强度。 您可以 分析 终端提供的 一切 。试试吧,体验一下您在交易时如何把握 时机 。 IX Power 主要功能 100% 精确的非重绘计算结果 - 适用于您终端中的所有交易符号 下拉式选择预配置以及可单独配置的强度分析周期 通过电子邮件、消息和手机通知的无数种通知选项 可访问的 EA 请求缓冲区 可自定义计算限制,以获得更好的性能 为希望查看更多信息的用户提供特殊的多实例设置 无尽的图形设置,让您在每个图表中都能找到最喜欢的颜色 采用 Windows 11 和 macOS 风格的圆角新面板设计 神奇的移动指标面板,可在子窗口和主图表之间无缝移动 适用于高分辨率 QHD、UHD 和 4K 显示器,并针对平板电脑和触摸屏进行了优化 IX Power 参数 最重要的参数不言自明,但我们很快会在另一篇文章中为您提供所有 IX Power 参数的完整说明。 使用别名 "参数可为技术交易符号
XQ Indicator MetaTrader 5
Marzena Maria Szmit
5 (1)
Step into the realm of Forex trading with confidence and precision using XQ, a cutting-edge Forex indicator designed to elevate your trading game to unprecedented heights. Whether you're a seasoned trader or just stepping into the world of currency exchange, XQ Forex Indicator empowers you with the insights and signals needed to make informed trading decisions. The signal conditions are a combination of three indicators, and XQ Forex Indicator only display  medium and long-term trends . The ind
Golden Gate Algo MT5
James David Lane
4 (6)
40% 圣诞优惠!价格将于1月1日涨至$250! 推出GoldenGate Entries:前沿交易解决方案! 发现与GoldenGate Entries(GGE)一同进行交易的革命性方法,这是一款设计用于提升您交易体验的先进指标。GGE提供了一套全面的功能,以赋予用户在交易决策中的精准和信心。 交易对:任意(外汇 - 商品 - 股票 - 股票 - 加密货币) 时间框架:15分钟至H1 主要特点: 买入和卖出箭头指示:接收伴随弹出警报的买入和卖出箭头指示,确保您随时保持了解。 GoldenGate_Algo:通过GoldenGate_Algo深入了解市场状况,这是一款强大的工具,用于评估市场是否处于“超卖”或“超买”状态。 当前趋势分析:通过访问您正在查看的时间框架上的当前趋势,保持领先地位,使您能够将交易与市场当前方向对齐。 内置枢轴点:使用内置的枢轴点轻松识别关键市场点,提供有价值的支撑和阻力水平。 蜡烛扫描器:分析蜡烛形态和图案,找到最佳的入场点并过滤掉低概率的入场。 完全定制:通过完整的定制选项,完全掌控您的交易体验,允许您个性化从
"Piranha" - an autonomous trading system that determines overbought and oversold levels on the chart. Red and blue zones represent overbought and oversold levels respectively. Entry points are marked with arrows: a downward arrow in the red zone for "sell" and an upward arrow in the blue zone for "buy". The Take profit level is indicated by the green moving average. Key features: Adjusting the Take profit level as the green moving average changes position. Averaging ability when a new market e
Quantum Heiken Ashi PRO MT5
Bogdan Ion Puscasu
4.5 (8)
Quantum Heiken Ashi PRO 简介 Heiken Ashi 蜡烛旨在提供对市场趋势的清晰洞察,以其过滤噪音和消除虚假信号的能力而闻名。告别令人困惑的价格波动,迎接更流畅、更可靠的图表表示。 Quantum Heiken Ashi PRO 的真正独特之处在于其创新公式,它将传统烛台数据转换为易于阅读的彩色条。红色和绿色条分别优雅地突出了看跌和看涨趋势,让您能够以非凡的精度发现潜在的进入和退出点。 量子 EA 通道:       点击这里 MT4版本:       点击这里 这一卓越的指标具有以下几个关键优势: 增强清晰度:通过平滑价格波动,Heiken Ashi 金条可以更清晰地反映市场趋势,使您更容易识别有利的交易机会。 减少噪音:告别经常导致错误信号的不稳定价格变动。 Quantum Heiken Ashi 指标可过滤噪音,使您能够做出更明智的交易决策 无缝集成:Heiken Ashi 指标专为 MetaTrader 开发,可无缝集成到您的交易平台中。它用户友好、高度可定制,并且与您的其他交易指标和过滤器兼容 无论您是寻求新优势的经验丰富的交易者,
Easy Buy Sell Signal Alert
Franck Martin
4.86 (7)
Easy By Sell is a market indicator for opening and closing positions. It becomes easy to track market entries with alerts. It indicates trend reversal points when a price reaches extreme values ​​and the most favorable time to enter the market. it is as effective as a Fibonacci to find a level but it uses different tools such as an algorithm based on ATR indicators and Stochastic Oscillator. You can modify these two parameters as you wish to adapt the settings to the desired period. My othe
Advanced Supply Demand MT5
Bernhard Schweigert
4.53 (15)
任何新手或专业交易者的最佳解决方案! 该指标是一款独特、高质量、且价格合理的交易工具,因为我们已经整合了许多专有功能和新公式。 依据此更新,您将能够显示双重时间帧区域。 您不仅可以显示一个较高的时间帧,还可以同时显示图表时间帧,加上更高的时间帧:显示嵌套时区。 供需双方所有交易者都会喜欢它。 :) 重要信息披露 高级供需的最大潜力,请访问 https://www.mql5.com/zh/blogs/post/720245   想象您的交易如何得以改善,是因为您能够精准定位入场或目标位吗? 构建于新的底层算法,它可以更轻松地识别出买卖双方之间的潜在失衡。 这是因为它以图形方式展示供需最强劲区域,及其过去的表现(显示旧区域)。 这些功能旨在帮助您更轻松地发现最佳入场区域和价位。 现在您可以针对您的交易品种和时间帧来优化和编辑区域强度! 高级供需指标适用于所有产品和时间帧。 它是一个新的公式,非常新的功能是两个区域强度函数可由用户输入进行调整! 这在交易中是一大优势。 当您学习如何使用专有功能,例如带有价格游离最小 X 因子的区域强度时,您能够判断该区域强劲与否。 供需区域用作警报触发器
Gartley Hunter Multi
Siarhei Vashchylka
5 (7)
Gartley Hunter Multi - An indicator for searching for harmonic patterns simultaneously on dozens of trading instruments and on all possible timeframes. Manual (Be sure to read before purchasing) | Version for MT4 Advantages 1. Patterns: Gartley, Butterfly, Shark, Crab. Bat, Alternate Bat, Deep Crab, Cypher 2. Simultaneous search for patterns on dozens of trading instruments and on all possible timeframes 3. Search for patterns of all possible sizes. From the smallest to the largest 4. A
ADR 反轉指標一目了然地顯示當前價格相對於其正常平均每日範圍的交易位置。當價格超過您選擇的平均範圍和高於它的水平時,您將通過彈出窗口、電子郵件或推送獲得即時警報,以便您可以快速跳入回調和反轉。該指標在圖表上在平均每日範圍極值處繪製水平線,並在這些水平之上延伸,這些水平附加了價格超過它們的數學概率。下面的更多細節...... ADR 警報儀表板補充指標並監控所有配對也可在此處獲得: https://www.mql5.com/en/market/product/66316 MT4 版本也可在此處獲得: https://www.mql5.com/en/market/product/62757 大約 60% 的時間價格在其正常的平均每日範圍 (ADR) 內交易並推高這些水平通常是價格急劇波動的指標,通常會出現回調(獲利了結)走勢。您可以通過交易從每日範圍的頂部或底部回落到最近的支撐位或阻力位來利用這些急劇波動。 收集了超過 20 年的歷史數據,以找出主要外匯對和一系列交叉盤的價格超出特定 ADR 水平的平均百分比。該數據表明價格僅在 3% 的時間內超過其 ADR 的 200%,
Trend Reversal Scanner MT5
Reza Aghajanpour
5 (3)
**   All Symbols   x   All Timeframes   scan just by pressing scanner button ** *** Contact me after the purchase to send you instructions and add you in "Trend Reversal group" for sharing or seeing experiences with other users. Introduction: Trendlines are the most famous technical analysis in trading . Trendlines continually form on the charts of markets across all the different timeframes providing huge opportunities for traders to jump in and profit on the action. In the other hand,  The tre
Advanced Currency Strength28 MT5
Bernhard Schweigert
5 (1)
任何新手或专家交易者的最佳解决方案! 这个指标是一个独特的、高质量的、可负担得起的交易工具,因为我们纳入了一些专有的功能和一个新的公式。只需一个图表,你就可以读出28个外汇对的货币强度!想象一下,你的交易将如何得到改善,因为你的交易是在你的手中进行的。想象一下,你的交易将如何改善,因为你能够准确地确定新趋势或剥头皮机会的触发点? 用户手册:点击这里  https://www.mql5.com/en/blogs/post/697384 这是第一本,原版的! 不要买一个毫无价值的崇拜者的克隆品。 特别的 子窗口中的箭头显示强劲的货币势头GAP将指导你的交易! 当基础货币或报价货币处于超卖/超买区域(外盘斐波那契水平)时,在个人图表的主窗口中出现警告信号。 当货币力量从外围区间回落时,回撤/反转警报。 十字星模式的特别警报 可选择多个时间框架,以快速查看趋势! 货币强度线在所有的时间框架中都非常平稳,当使用较高的时间框架来识别总体趋势,然后使用较短的时间框架来确定精确的入口时,效果非常好。你可以根据自己的意愿选择任何时间框架。每个时间框架都由其自身进行了优化。 建立在
Fractal Advanced MT5
Siarhei Vashchylka
5 (3)
Fractal Advanced - displays Fractal and Alligator indicators on the price chart. Has wide options for settings and customization. It is also equipped with alerts and a hotkey system. Manual (Be sure to read before purchasing) | Version for MT4 Advantages 1. The indicator does not fill the entire chart with fractals, but allows you to display only relevant signals. 2. The number of fractals is adjusted by scrolling the mouse while holding down the Shift key. 3. Instantly show/hide the Alligator
Legacy of Gann for MT5
Pavel Zamoshnikov
5 (6)
The indicator very accurately determines the levels of the possible end of the trend and profit fixing. The method of determining levels is based on the ideas of W.D.Gann, using an algorithm developed by his follower Kirill Borovsky. Extremely high reliability of reaching levels (according to K. Borovsky  - 80-90%) Indispensable for any trading strategy – every trader needs to determine the exit point from the market! Precisely determines targets on any timeframes and any instruments (forex, met
FxaccurateLS
Shiv Raj Kumawat
WHY IS OUR FXACCCURATE LS MT5 THE PROFITABLE ? PROTECT YOUR CAPITAL WITH RISK MANAGEMENT Gives entry, stop and target levels from time to time. It finds Trading opportunities by analyzing what the price is doing during established trends. POWERFUL INDICATOR FOR A RELIABLE STRATEGIES We have made these indicators with a lot of years of hard work. It is made at a very advanced level. Established trends provide dozens of trading opportunities, but most trend indicators completely ignore them!
作者的更多信息
WH Fair Value Gap MT5
Wissam Hussein
4.8 (15)
使用我们无与伦比的公允价值差距 MT5 指标 (FVG) 体验前所未有的交易体验 被誉为同类中最好的。该 MQL5 市场指标超越普通, 为交易者提供无与伦比的准确性和对市场动态的洞察力。 特征: 一流的公允价值缺口分析。 定制。 实时警报。 用户友好的完美 无缝兼容 好处: 无与伦比的精确度: 自信地做出决策,因为您知道绝对最佳的公允价值差距指标触手可及。 优化的风险管理: 利用资产的真实公允价值,以无与伦比的准确性识别市场调整并管理风险。 最佳的多功能性: 根据您喜欢的交易风格定制指标,无论是日内交易、波段交易还是长期投资。无缝适应不同的时间范围和工具。 久经考验的卓越性: 在严格的测试和积极的用户反馈记录的支持下,我们的公允价值差距指标在各种市场条件下始终优于竞争对手。 使用终极公允价值缺口指标将您的交易体验提升到新的高度。今天就为您的成功做出明智的选择! **你有任何问题请联系我**
FREE
WH Fair Value Gap MT4
Wissam Hussein
5 (7)
使用我们无与伦比的公允价值差距 MT4 指标 (FVG) 体验前所未有的交易体验 被誉为同类中最好的。该 MQL5 市场指标超越普通, 为交易者提供无与伦比的准确性和对市场动态的洞察力。 特征: 一流的公允价值缺口分析。 定制。 实时警报。 用户友好的完美 无缝兼容 好处: 无与伦比的精度:     自信地做出决策,因为您知道绝对最佳的公允价值差距指标触手可及。 优化风险管理:     利用资产的真实公允价值,以无与伦比的准确性识别市场调整并管理风险。 最佳的多功能性:     根据您喜欢的交易风格定制指标,无论是日间交易、波段交易还是长期投资。无缝适应不同的时间范围和工具。 久经考验的卓越性能:     凭借严格的测试和积极的用户反馈记录,我们的公允价值差距指标在各种市场条件下始终优于竞争对手。 使用终极公允价值缺口指标将您的交易体验提升到新的高度。今天就为您的成功做出明智的选择! **你有任何问题请联系我**
FREE
欢迎使用双峰指标 MT4 --(双顶/双底)-- 双顶底指标是一种技术分析工具,旨在识别市场中潜在的反转模式。 它确定了价格连续出现两个几乎相等高度的波峰或波谷,随后价格向相反方向移动的区域。 这种模式表明市场正在失去动力,可能已准备好趋势逆转。 特征: 自动图表注释:指标自动在图表上标记双顶底形态 易于使用:该指标用户友好,可以轻松应用于 MT5 平台中的任何图表。 可定制:指标具有可定制的设置。 警报系统。 适用于任何乐器。 该指标可与其他技术分析工具结合使用,以确定趋势方向和反转形态的潜在强度。 总的来说,双顶和双底指标是寻求识别市场潜在趋势逆转的交易者的强大工具。 其可定制的设置、警报和自动图表注释使其易于使用, 而其多时间框架分析和趋势确认功能为交易者提供了对潜在交易机会的宝贵见解。
WH Price Wave Pattern MT5
Wissam Hussein
3.82 (11)
FREE
WH DrawFib Pro MT5
Wissam Hussein
4.83 (6)
您是否厌倦了在图表上手动绘制斐波那契水平?您是否正在寻找一种方便有效的方法来确定交易中的关键支撑位和阻力位?别再犹豫了! 隆重推出 DrawFib Pro,这是一款可自动执行 ibonacci 水平的 终极 MetaTrader 5 指标   在图表上绘制,并在突破这些水平时及时发出警报。借助 DrawFib Pro,您可以增强交易策略、节省时间并做出更明智的决策。 我的基于斐波那契的指标:   Advanced Gartley Pattern MT5   ||    Price Wave Pattern MT5 主要特征: 自动 斐波那契绘图 . 可定制的 参数 . 准确 可靠. 实时 警报. 用户 友好的 界面 . 对于任何寻求高效、可靠且用户友好的方式在图表上自动绘制斐波那契的交易者来说,DrawFib Pro 是必备工具。 DrawFib Pro 能够提供实时警报并支持各种时间范围,使交易者能够做出更准确、更及时的决策。节省宝贵的时间和精力,同时提高您的交易绩效。立即使用 DrawFib Pro 释放自动斐波那契分析的力量!
FREE
欢迎使用高级加特利模式识别指标 该指标根据价格结构的 HH 和 LL 以及斐波那契水平检测加特利模式,当满足某些斐波那契水平时,指标将在图表上显示该模式。 MT4 版本 :   WH Advanced Gartley Pattern MT4 **该指标是 组合 Ultimate Harmonic Patterns MT5 的一部分,其中包括所有模式识别。** 特征 : 用于 高精度 检测伽利形态的先进算法。 非常 快 且资源 少 (对机器的要求较低)。 没有 延迟 ,也没有 重画 。 自定义 斐波那契水平 调整(您可以根据您的首选设置更改斐波那契水平)。 同时显示 看跌 和 看涨 模式(能够显示看跌或看涨设置的多种模式)。 显示 交易 水平线(具有可调整止损以及目标 1 和目标 2)。 适用于任何 交易品种 和任何 时间范围 。 未来还会有更多 功能 ! 参数: MaxBars   - 选择要回顾的最大条数。 XlegBarDepth   - 调整 HH 和 LL 深度。 ShowBearish   - 显示看跌加特利形态(True、False)。 ShowBullish
FREE
WH DrawFib Pro MT4
Wissam Hussein
5 (7)
您是否厌倦了在图表上手动绘制斐波那契水平?您是否正在寻找一种方便有效的方法来确定交易中的关键支撑位和阻力位?别再犹豫了! 隆重推出 DrawFib Pro,这是一款可自动执行 ibonacci 水平的 终极 MetaTrader 4 指标   在图表上绘制,并在突破这些水平时及时发出警报。借助 DrawFib Pro,您可以增强交易策略、节省时间并做出更明智的决策。 我的斐波那契指标:   WH Advanced Gartley Pattern MT4   ||  WH Price Wave Pattern MT4 主要特征: 自动化   斐波那契绘图. 可定制  参数 . 准确的   和   可靠的. 实时   警报. 用户 友好   接口 . 对于任何寻求高效、可靠且用户友好的方式在图表上自动绘制斐波那契的交易者来说,DrawFib Pro 是必备工具。 DrawFib Pro 能够提供实时警报并支持各种时间范围,使交易者能够做出更准确、更及时的决策。节省宝贵的时间和精力,同时提高您的交易绩效。立即使用 DrawFib Pro 释放自动斐波那契分析的力量!
FREE
WH Price Wave Pattern MT4
Wissam Hussein
5 (8)
Welcome to our   Price Wave Pattern   MT4 --(ABCD Pattern)-- The ABCD pattern is a powerful and widely used trading pattern in the world of technical analysis. It is a harmonic price pattern that traders use to identify potential buy and sell opportunities in the market. With the ABCD pattern, traders can anticipate potential price movements and make informed decisions on when to enter and exit trades. EA Version : Price Wave EA MT4 MT5 version : Price Wave Pattern MT5 Features :  Aut
FREE
WH Range BreakOut MT5
Wissam Hussein
5 (1)
使用我们先进的 MQL5 指标 Range BreakOut MT5 开启交易新维度 这个强大的工具旨在识别并利用价格突破既定范围的波动, 为您提供在动态的金融市场中蓬勃发展所需的精确性和信心。 MT4 版本 :   WH Range BreakOut MT4 特征: 准确的距离检测。 实时突破信号。 可定制的参数。 风险管理工具。 为什么选择我们的产品: 精准交易。 节省时间。 多功能性。 持续更新。 立即通过范围突破改变您的交易体验。 加入相信我们的指标能够驾驭复杂金融市场的成功交易者的行列。 提升您的交易游戏水平,立即下载 Range BreakOut! 立即通过范围突破改变您的交易体验。 加入相信我们的指标能够驾驭复杂金融市场的成功交易者的行列。 提升您的交易游戏水平,立即下载 Range BreakOut!
WH Trend Continuation MT5
Wissam Hussein
5 (4)
您是否厌倦了错过有利可图的市场趋势?您是否希望拥有一个可靠的工具,能够精确、准确地识别趋势的延续? 别再犹豫了!我们的趋势延续指标可以增强您的交易策略并帮助您保持领先地位。 趋势延续指标是一个强大的工具,专门为帮助交易者识别和确认各种金融市场的趋势延续模式而创建。 无论您是交易股票、货币、商品还是指数,该指标都是您增强交易决策的终极伴侣。 MT4版本: WH Trend Continuation MT4 特征: 准确的 趋势确认. 可定制的 参数. 易于 使用的界面. 实时 提醒. 全面 支持 . 利用 MT5 的趋势延续指标将您的交易策略提升到新的高度。拥抱趋势分析的力量,做出明智的交易决策,并释放利润潜力的世界。不要让机会溜走——立即开始使用趋势延续指标!
隆重推出 Auto Trendline,这是一款创新的 MT5 指标,可自动 在您的图表上绘制趋势线。告别繁琐且耗时的手动绘制趋势线任务, 让 Auto Trendline 为您代劳! *购买后联系我向您发送  说明和分步指南。 凭借其先进的算法,Auto Trendline 会自动检测并为您绘制趋势线, 从而节省您的时间和精力。只需将指标附加到您的图表,并观察它根据价格行为的高点和低点识别和绘制趋势线。 Auto Trendline 是高度可定制的,允许您调整指标的灵敏度以适合您的交易风格和偏好。 您还可以选择不同的线条样式和颜色,甚至可以设置警报以在趋势线被打破时通知您。 无论您是初学者还是经验丰富的交易者,自动趋势线都是识别和分析任何市场趋势的重要工具。 凭借其友好的用户界面和高级功能,该指标一定会提升您的交易体验并帮助您做出更明智的交易决策。 主要特征: 自动绘制趋势线 高度可定制的灵敏度设置 多种线条样式和颜色 破损趋势线的警报通知 用户友好的界面 立即试用自动趋势线,发现自动趋势线分析的好处! 相关产品 :   Auto TrendLine MT
隆重推出 Price Wave EA MT4 Expert Advisor – 一款专 为 MetaTrader 4 开发 的创新工具,旨在利用外汇市场中 ABCD 模式的力量 该 EA 利用我的 免费     Price Wave Pattern MT4   准确高效地识别利润丰厚的交易机会的指标。 ABCD 模式是一种众所周知且可靠的图表模式,专业交易者利用它来识别潜在的趋势反转或延续。 通过分析价格走势并识别这些模式的形成,交易者可以获得对市场动态的宝贵见解并做出明智的交易决策。 借助价格波动模式 MT4 EA,您可以根据 ABCD 模式自动化您的交易策略,让您实时抓住机会,利用市场波动获利。 EA 与价格波动模式 MT4 指标无缝集成,直接在您的 MetaTrader 4 平台上生成及时、准确的交易信号。 特征: 增强型   交易执行:Price Wave EA MT4 配备先进的算法,可以快速分析市场状况并在几分之一秒内执行交易。这确保您不会错过潜在的盈利机会。 可定制   参数:定制 EA 的设置以符合您的交易偏好和风险承受能力。调整手数、止损、止盈等参数以
Ultimate Fractals MT4
Wissam Hussein
5 (1)
该指标基于著名的分形指标,但具有很强的定制性 和灵活性, 这是识别趋势逆转并最大化您的利润潜力的强大工具。 凭借其先进的功能和用户友好的界面,它是各个级别交易者的最终选择。 MT5 版本: Ultimate Fractals MT5 特征 : 可定制的分形蜡烛数。 反转线。 可定制的设置。 用户友好的界面。 主要参数: 左侧蜡烛 - 左侧形成分形的条形数量。 右侧蜡烛 - 分形右侧的条形数量。 不要让市场的不确定性阻碍您。使用“终极分形”指标提升您的交易游戏。 加入依赖此工具做出自信决策并实现财务目标的成功交易者行列。 请随意定制此产品描述,以突出显示您的特定“Ultimate Fractals MT4”指标的任何独特功能或优点, 并向我询问有关产品的任何问题或建议。
FREE
该指标基于著名的分形指标,但具有很强的定制性 和灵活性, 这是识别趋势逆转并最大化您的利润潜力的强大工具。 凭借其先进的功能和用户友好的界面,它是各个级别交易者的最终选择。 MT4 版本: Ultimate Fractals MT4 特征 : 可定制的分形蜡烛数。 反转线。 可定制的设置。 用户友好的界面。 主要参数: 左侧蜡烛 - 左侧形成分形的条形数量。 右侧蜡烛 - 分形右侧的条形数量。 不要让市场的不确定性阻碍您。使用“终极分形”指标提升您的交易游戏。 加入成功交易者的行列,依靠此工具做出自信的决策并实现财务目标。 请随意定制此产品描述,以突出显示您的特定“Ultimate Fractals MT5”指标的任何独特功能或优点, 并向我询问有关产品的任何问题或建议。
FREE
欢迎使用高级加特利模式识别指标 该指标根据价格结构的 HH 和 LL 以及斐波那契水平检测加特利模式,当满足某些斐波那契水平时,指标将在图表上显示该模式。 MT5版本:   WH Advanced Gartley Pattern MT5 **该指标是 组合 的一部分     WH Ultimate Harmonic Patterns MT4   ,其中包括所有模式识别。** 特征 : 用于检测 Gartley 模式的高级算法   准确性 。 非常   快速地   和   低的   资源(对机器要求较低)。 不   落后   也不   重新粉刷 。 风俗     Fib 水平   调整(您可以根据您的首选设置更改斐波那契水平)。 展示   看跌   和   看涨   同时模式(能够显示看跌或看涨设置的多种模式)。 展示   贸易水平   线(带有可调节的停止点以及目标 1 和目标 2)。 适用于任何   象征   和任何   时间范围 。 更多的   特征   未来还会来! 参数: 最大条数     - 选择要回顾的最大条数。 XlegBar深度     - 调整 HH 和 LL
FREE
Unlock the power of synchronized chart analysis with Chart Sync, your ultimate solution for harmonizing technical objects across multiple charts on the same trading symbol, ChartsSync Pro MT5 is a groundbreaking MetaTrader 5 utility designed to streamline your trading workflow, enhance analysis precision, and amplify your trading decisions. Features: Effortless Object Synchronization. Multi-Chart Harmony. User-Friendly Interface. Real-Time Updates. Sync Objects Color,Width and Style.
FREE
三线打击指标   适用于 MetaTrader 4 (MT4)。此高级工具旨在帮助您轻松精准地识别市场中的潜在逆转。 无论您是初学者还是经验丰富的交易者,该指标都可以增强您的交易决策并最大化您的利润。 Contact me after purchase for guidance  主要特征: 准确的反转信号 :根据三线打击模式(技术分析中经过验证的蜡烛图形态)检测潜在的趋势反转。 可自定义的设置 :使用可调节的参数(例如,执行模式、时间范围和视觉偏好)来定制适合您的交易风格的指标。 实时警报 :当三线打击模式形成时立即收到通知,这样您就不会错过重要的市场机会。 用户友好界面 :直观的设计可以轻松解释信号并将其集成到您的交易策略中。 兼容性 :与您现有的 MT4 设置无缝集成,获得流畅、高效的交易体验。 为何选择三线走势指标? 提高您的交易绩效 :通过可靠、及时的反转信号增强您的决策能力。 节省时间和精力 :自动化您的分析并专注于执行有利可图的交易。 适合所有交易者 :无论您是日内交易者、波段交易者还是长期投资者,该指标都适合您的交易风格。 立即试用三线走势指标,让您的交易更上一层楼。
您准备好将您的交易提升到一个新的水平吗?隆重推出 WH   Divergence Pro MT5   , 先进的背离指标,让您可以从各种流行的技术指标中进行选择。 现在,您可以定制背离信号以匹配您独特的交易策略。 购买后联系我指导您完成整个过程 主要特征 : 指标选择 :从以下选项中选择您喜欢的指标: RSI(相对强度指数)。 很棒的振荡器。 CCI(商品通道指数)。 将添加更多指标。 精确信号 :根据您选择的指标,当出现背离或收敛时接收警报。 可定制的参数 :调整灵敏度、时间范围和其他设置以微调您的信号。 非重画 :信任准确的信号,无需担心重画。 怎么运行的 : 选择您的指标 :选择与您的交易风格产生共鸣的技术指标。 现货正常背离 :当所选指标和价格朝相反方向移动时,Divergence Pro 会检测到它。 现货隐藏背离 :当指标和价格朝同一方向移动时,Convergence Pro Plus 发出潜在回调的信号。 为什么使用 WH   Divergence Pro MT5   ? 指标自由度 :选择与您的分析相符的工具。 微调 :自定义参数以匹配您的风险承受能
您准备好将您的交易提升到一个新的水平吗?介绍     WH     分歧专业版 MT4   , 先进的背离指标,让您可以从各种流行的技术指标中进行选择。 现在,您可以定制背离信号以匹配您独特的交易策略。 购买后联系我指导您完成整个过程 主要特征 : 指标选择 :从以下选项中选择您喜欢的指标: RSI(相对强度指数)。 很棒的振荡器。 CCI(商品通道指数)。 将添加更多指标。 精确信号 :根据您选择的指标,当出现背离或收敛时接收警报。 可定制的参数 :调整灵敏度、时间范围和其他设置以微调您的信号。 非重画 :信任准确的信号,无需担心重画。 怎么运行的 : 选择您的指标 :选择与您的交易风格产生共鸣的技术指标。 现货正常背离 :当所选指标和价格朝相反方向移动时,Divergence Pro 会检测到它。 发现隐藏背离     :当指标和价格朝同一方向移动时,Convergence Pro Plus 发出潜在回调的信号。 为什么使用 WH   Divergence Pro MT4       ? 指标自由度 :选择与您的分析相符的工具。 微调 :自定义参数以匹配您的风险
欢迎使用双峰指标 MT5 --(双顶/双底)-- 双顶底指标是一种技术分析工具,旨在识别市场中潜在的反转模式。 它确定了价格连续出现两个几乎相等高度的波峰或波谷,随后价格向相反方向移动的区域。 这种模式表明市场正在失去动力,可能已准备好趋势逆转。 *购买后联系我,向您发送  说明和步骤指南。 特征: 自动图表注释:指标自动在图表上标记双顶底形态 易于使用:该指标用户友好,可以轻松应用于 MT5 平台中的任何图表。 可定制:指标具有可定制的设置 自定义警报 。   适用于任何乐器。 该指标可与其他技术分析工具结合使用,以确定趋势方向和反转形态的潜在强度。 总的来说,双顶和双底指标是寻求识别市场潜在趋势逆转的交易者的强大工具。 其可定制的设置、警报和自动图表注释使其易于使用, 而其多时间框架分析和趋势确认功能为交易者提供了对潜在交易机会的宝贵见解。 如果你有任何问题随时问。
欢迎使用终极谐波模式识别指标 加特利形态、蝙蝠形态和密码形态是交易者用来识别市场潜在反转点的流行技术分析工具。 我们的终极谐波模式识别指标是一个强大的工具,它使用先进的算法来扫描市场并实时识别这些模式。 借助我们的终极谐波模式识别指标,您可以根据这些流行模式快速轻松地识别潜在的交易机会。 *购买后联系我向您发送 说明和步骤指南。 MT5 版本: Ultimate Harmonic Patterns MT5 该指标在图表上绘制模式以及关键的斐波那契回撤水平,使您可以轻松识别潜在的进入和退出点。 我们的指标还包括一系列自定义选项,允许您微调指标以适合您的特定交易风格。 您可以调整指标的灵敏度,为图案和回撤水平选择不同的颜色, 和更多。 特征: 强大的 Gartley、Bat 和 Cypher 模式检测算法 实时扫描潜在交易机会 在图表上显示形态和关键斐波那契回撤水平 可定制的设置以适合您的交易风格 适用于任何交易品种和任何时间范围 无论您是初学者还是经验丰富的交易者,我们的   终极谐波模式   指标是您技术分析工具库中必备的工具。 不
WH Auto TrendLine MT4
Wissam Hussein
5 (1)
隆重推出 Auto Trendline,这是一种创新的 MT4 指标,可自动 在您的图表上绘制趋势线。告别繁琐且耗时的手动绘制趋势线任务, 让 Auto Trendline 为您完成这项工作! *购买后联系我向您发送  说明和分步指南。 凭借其先进的算法,Auto Trendline 会自动检测并为您绘制趋势线, 从而节省您的时间和精力。只需将指标附加到您的图表,并观察它根据价格行为的高点和低点识别和绘制趋势线。 Auto Trendline 是高度可定制的,允许您调整指标的灵敏度以适合您的交易风格和偏好。 您还可以选择不同的线条样式和颜色,甚至可以设置警报以在趋势线被打破时通知您。 无论您是初学者还是经验丰富的交易者,自动趋势线都是识别和分析任何市场趋势的重要工具。 凭借其友好的用户界面和高级功能,该指标一定会提升您的交易体验并帮助您做出更明智的交易决策。 主要特征: 自动绘制趋势线 高度可定制的灵敏度设置 多种线条样式和颜色 破损趋势线的警报通知 用户友好的界面 立即试用自动趋势线,发现自动趋势线分析的好处! 相关产品 :   Auto Trend
WH Trend Continuation MT4
Wissam Hussein
5 (1)
您是否厌倦了错过有利可图的市场趋势?您是否希望拥有一个可靠的工具,能够精确、准确地识别趋势的延续? 别再犹豫了!我们的趋势延续指标可以增强您的交易策略并帮助您保持领先地位。 趋势延续指标是一个强大的工具,专门为帮助交易者识别和确认各种金融市场的趋势延续模式而创建。 无论您是交易股票、货币、商品还是指数,该指标都是您增强交易决策的终极伴侣。 MT5版本: WH Trend Continuation MT5 特征: 准确的   趋势确认. 可定制   参数. 易于 使用的界面. 实时 提醒. 综合的   支持 . 使用 MT4 的趋势延续指标将您的交易策略提升到新的高度。拥抱趋势分析的力量,做出明智的交易决策,并释放利润潜力的世界。不要让机会溜走——立即开始使用趋势延续指标!
Candles Fusion is a powerful   MT4   indicator that enhances your trading analysis by displaying higher timeframe candles on the current timeframe. This unique feature provides traders with a comprehensive view of price action across different timeframes, enabling them to make more informed trading decisions. Features: Multi-Timeframe Overlay. Customizable Timeframe Selection. Clear Visualization and color candle selection .  Real-Time Updates.  User-Friendly Interface.  Candles Fusion is
WH Turning Zone MT4
Wissam Hussein
5 (1)
介绍: “Turning Zone”是一种复杂且创新的 MT4 指标,旨在为交易者提供强大的工具来检测金融市场中潜在的趋势逆转。通过利用干草叉分析的永恒概念,转向区域指标可以识别市场情绪可能发生变化的关键反转区域,为交易者提供宝贵的见解,以做出明智的决策。 MT5 版本 :   WH Turning Zone MT5 相关产品 :   WH Trend Continuation MT4 主要特征: 干草叉分析. 逆转概率. 视觉清晰度. 定制选项. 实时警报. 如何使用 : 选项 1:等待价格到达转向区域并使用您自己的入场规则、止损和目标上方/下方区域。 选项 2:等待我的入场规则形成(以红色/蓝色箭头指示)止损,并且目标出现在图表上。 利用转向区指标释放精确趋势反转检测的潜力并提升您的交易策略。通过利用干草叉分析的力量,体验交易决策的新水平的信心和准确性。立即下载 MT4 的转向区域指标,在瞬息万变的金融市场世界中获得竞争优势。
Unlock the power of trend continuation with TrendWizard, your ultimate companion in the world of Forex and financial trading ,  Are you tired of missing out on profitable trend continuation opportunities? Look no further – TrendWizard is here to elevate your trading game and maximize your profits. --This EA is based on   WH Trend Continuation MT4  with custom setting and other EA features-- MT5 Version :  WH TrendWizard MT5 -This EA does   NOT   use  :   No Martingale  -    No Grid   -    No
Are you tired of missing crucial market movements? Do you wish for a tool that not only identifies swing points but also provides insights into price action movements? Look no further – our Market Structure Analysis indicator is here to revolutionize the way you analyze markets on MQL5! MT5 Version :  WH Market Structure Analysis MT5 Key Features: Swing Point Detection: Our indicator excels at identifying significant swing points in the market, helping you understand key turning points with p
扫描模式   是尖端工具,旨在以无与伦比的准确性识别看跌趋势旋转和看涨趋势旋转, 使您能够做出明智的交易决策并领先市场一步。 MT5 版本 : WH Sweep Pattern MT5 扫描模式特点: 它使用不同的颜色和样式自动检测并在图表上绘制看跌和看涨趋势旋转。 它会向您发送警报(声音、电子邮件、推送通知)并在您的图表上绘制箭头,这样您就不会错过任何交易信号。 它适用于任何货币对、时间范围和市场状况,为您的交易提供了一个多功能且可靠的工具。 使用可定制的参数根据您的特定交易偏好定制指标。 不要让市场轮动让您措手不及 – 今天使用扫描模式指标增强您的交易策略,您可以轻松发现看跌趋势反转或看涨趋势反转, 无论您是经验丰富的交易者还是新手, 该工具都将提升您的市场分析能力,并帮助您在动态的交易世界中做出明智的决策。 立即下载扫描模式指标并掌控您的交易旅程。 **购买后联系我了解更多细节和华丽**
Welcome to the Ultimate Harmonic Patterns recognition indicator that is focused to detect advanced patterns. The Gartley pattern, Bat pattern, and Cypher pattern  are popular technical analysis tools used by traders to identify potential reversal points in the market. Our Ultimate Harmonic Patterns recognition Indicator is a powerful tool that uses advanced algorithms to scan the markets and identify these patterns in real-time. With our Ultimate Harmonic Patterns recognition Indicator, you
筛选:
无评论
回复评论