Levelss
- 指标
- Ivan Stefanov
- 版本: 1.1
- 更新: 11 六月 2024
- 激活: 10
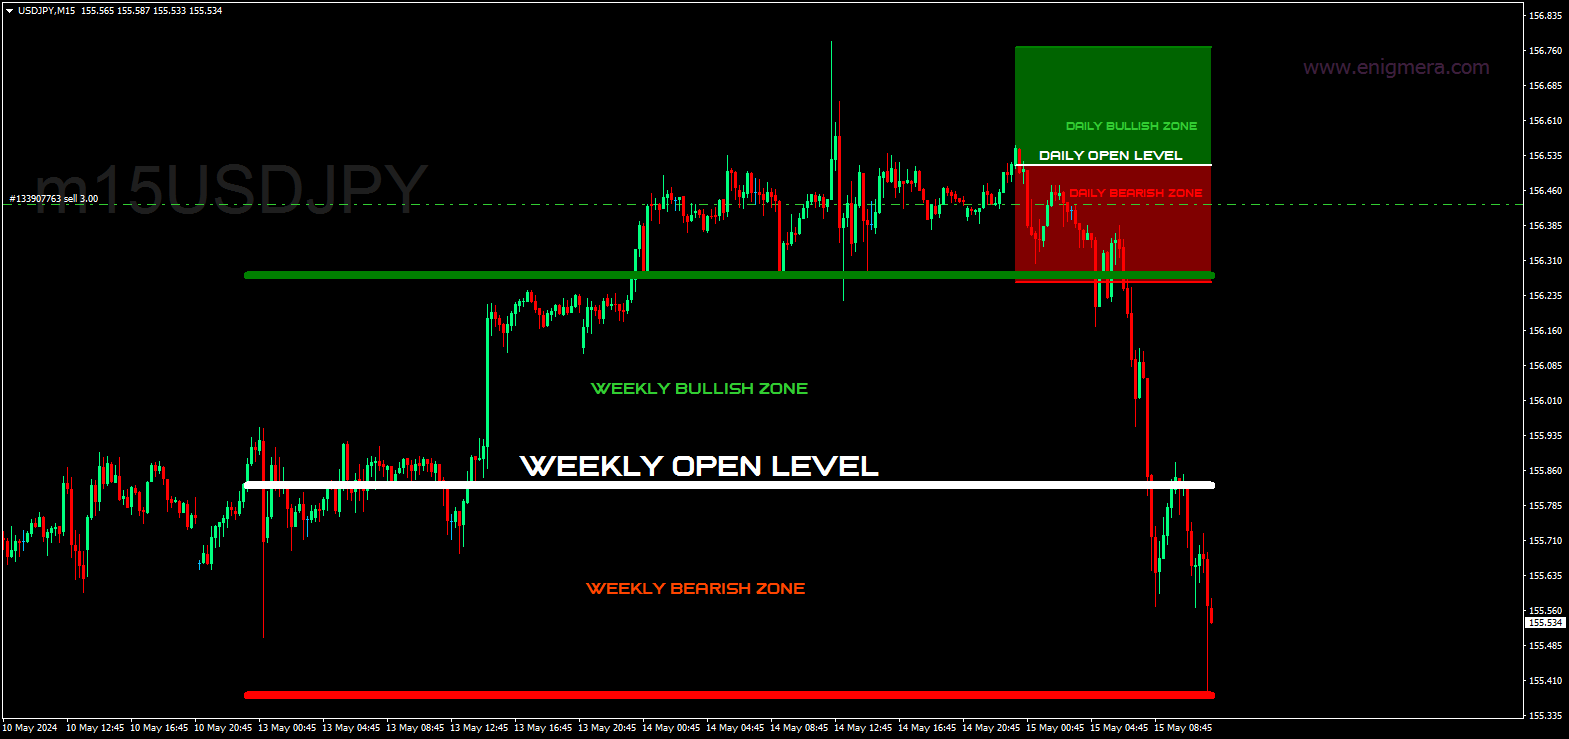
LEVELSS 指标显示
- 每日看涨和看跌区域。每天从 00:00 至 23:59 都可以看到。
- 周线看涨和看跌区域。每周从周一 0:00 至周五 23:59。
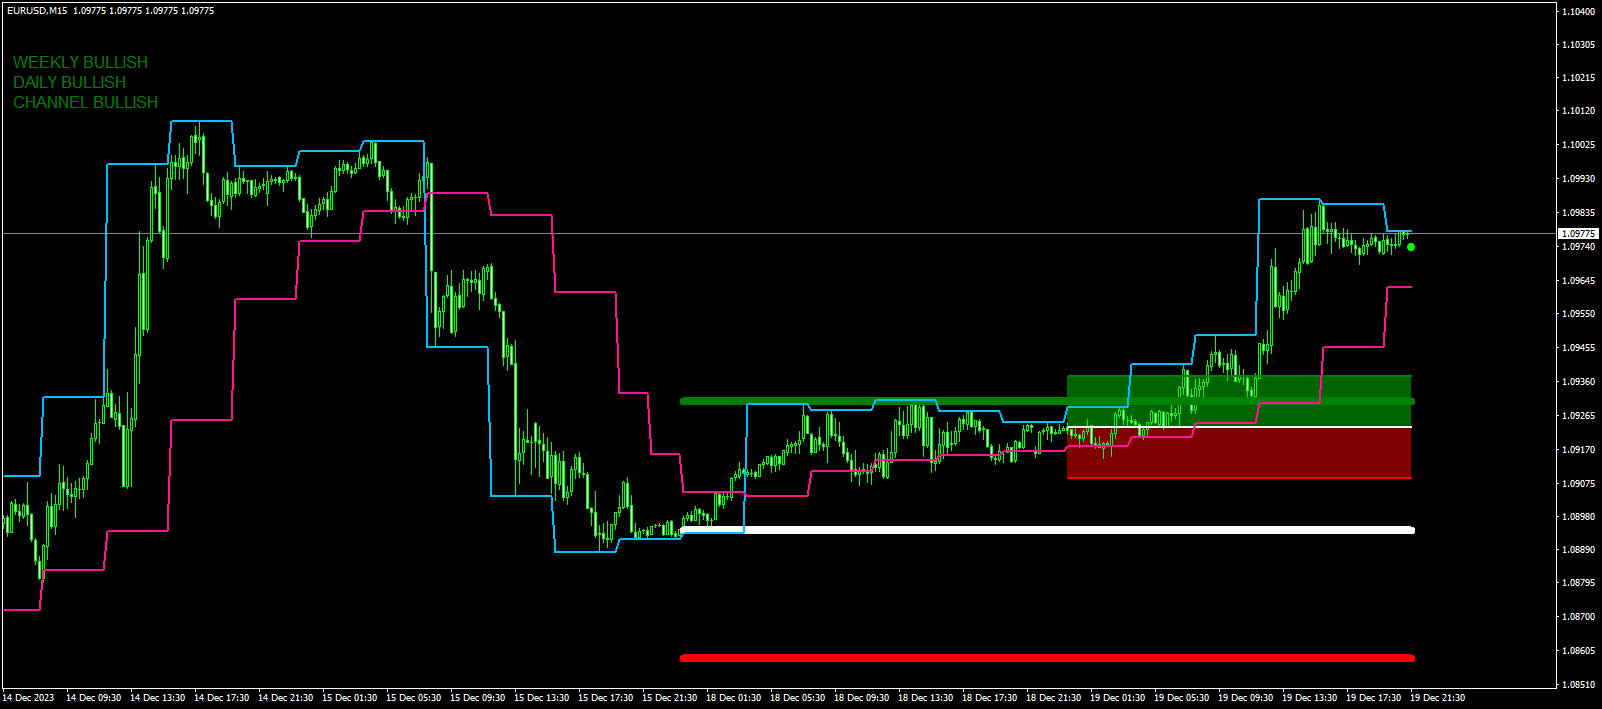
- 从特定时间框架特别计算的通道,显示在所有其他时间框架上。默认情况下,这是 4 小时时间框架,您可以将其更改为您希望交易的任何其他时间框架。它是不间断计算的。
屏幕左上方显示区域和通道是看涨、看跌还是中性。当三个区域都看涨时,当前蜡烛上会出现一个绿点。当三个区域都看跌时,则出现粉红色。
该指标没有任何限制。
LEVELSS 指标显示
- 每日看涨和看跌区域。每天从 00:00 至 23:59 都可以看到。
- 周线看涨和看跌区域。每周从周一 0:00 至周五 23:59。
- 从特定时间框架特别计算的通道,显示在所有其他时间框架上。默认情况下,这是 4 小时时间框架,您可以将其更改为您希望交易的任何其他时间框架。它是不间断计算的。
屏幕左上方显示区域和通道是看涨、看跌还是中性。当三个区域都看涨时,当前蜡烛上会出现一个绿点。当三个区域都看跌时,则出现粉红色。
该指标没有任何限制。