Breakout Retest Scan MT5
Introduction
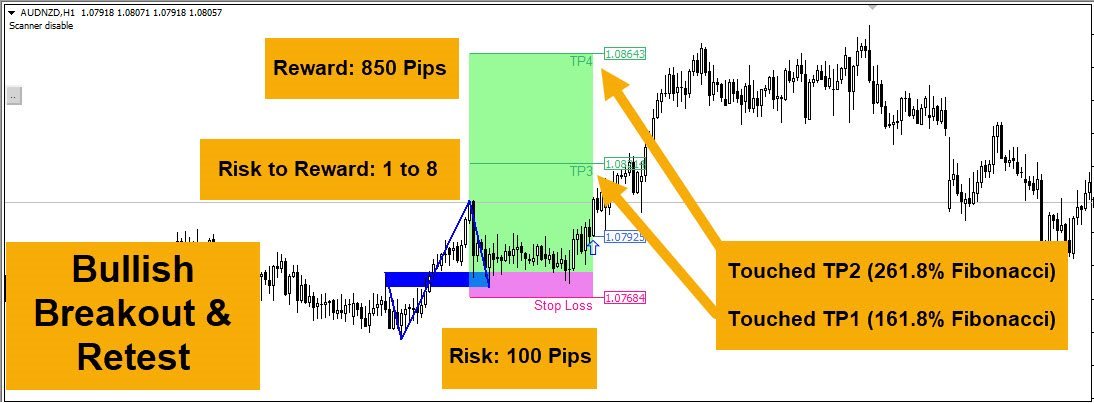
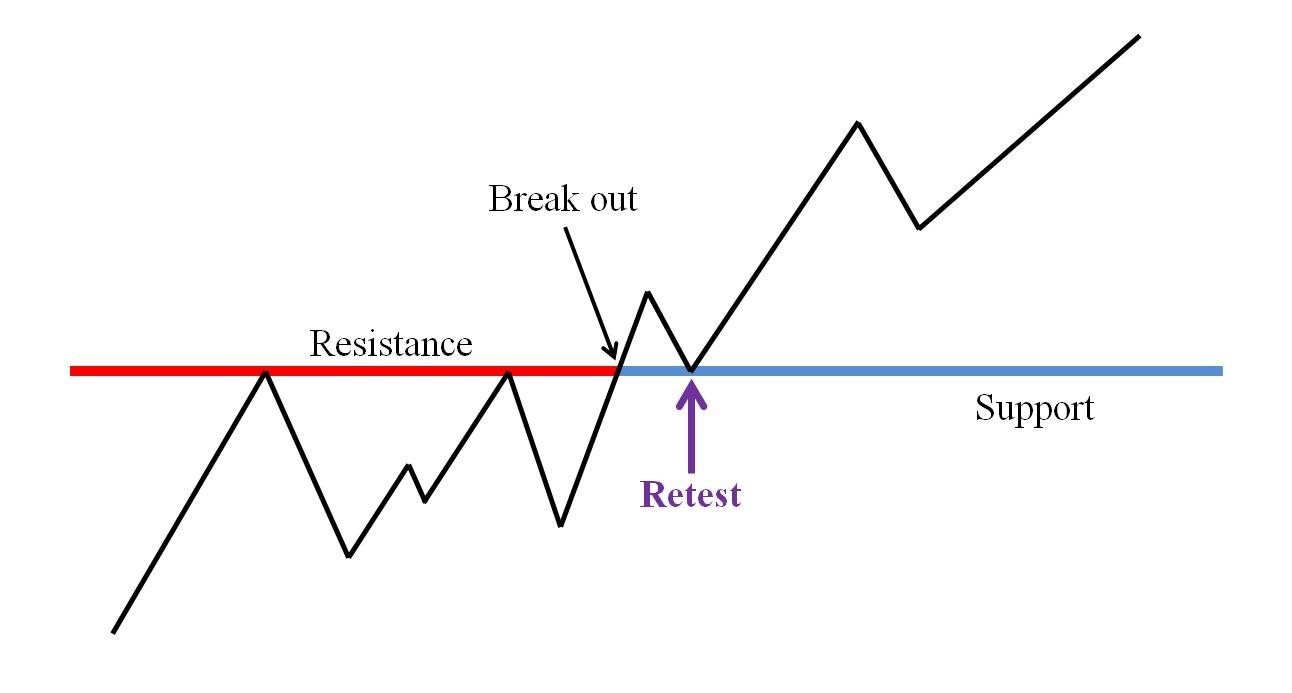
The breakout and retest strategy is traded support and resistance levels. it involves price breaking through a previous level.
The break and retest strategy is designed to help traders do two main things, the first is to avoid false breakouts. Many false breakouts start with a candlestick that breaks out of a level but ends with an immediate candlestick that brings the price back into the level. The second thing that the breakout and retest strategy does is that it helps traders confirm a new trend. When the price breaks out from a resistance level and retests it on the other side, it is a clear signal that a new support/ resistance level has formed and a new trend has begun.
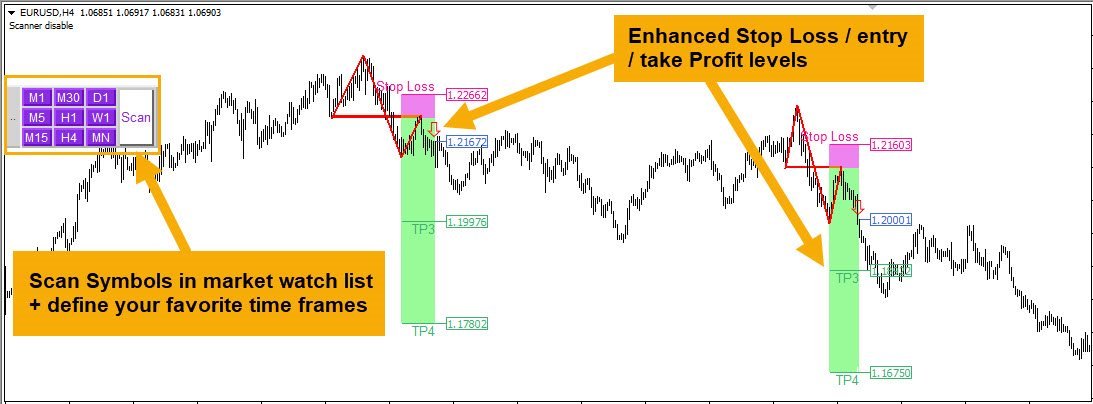
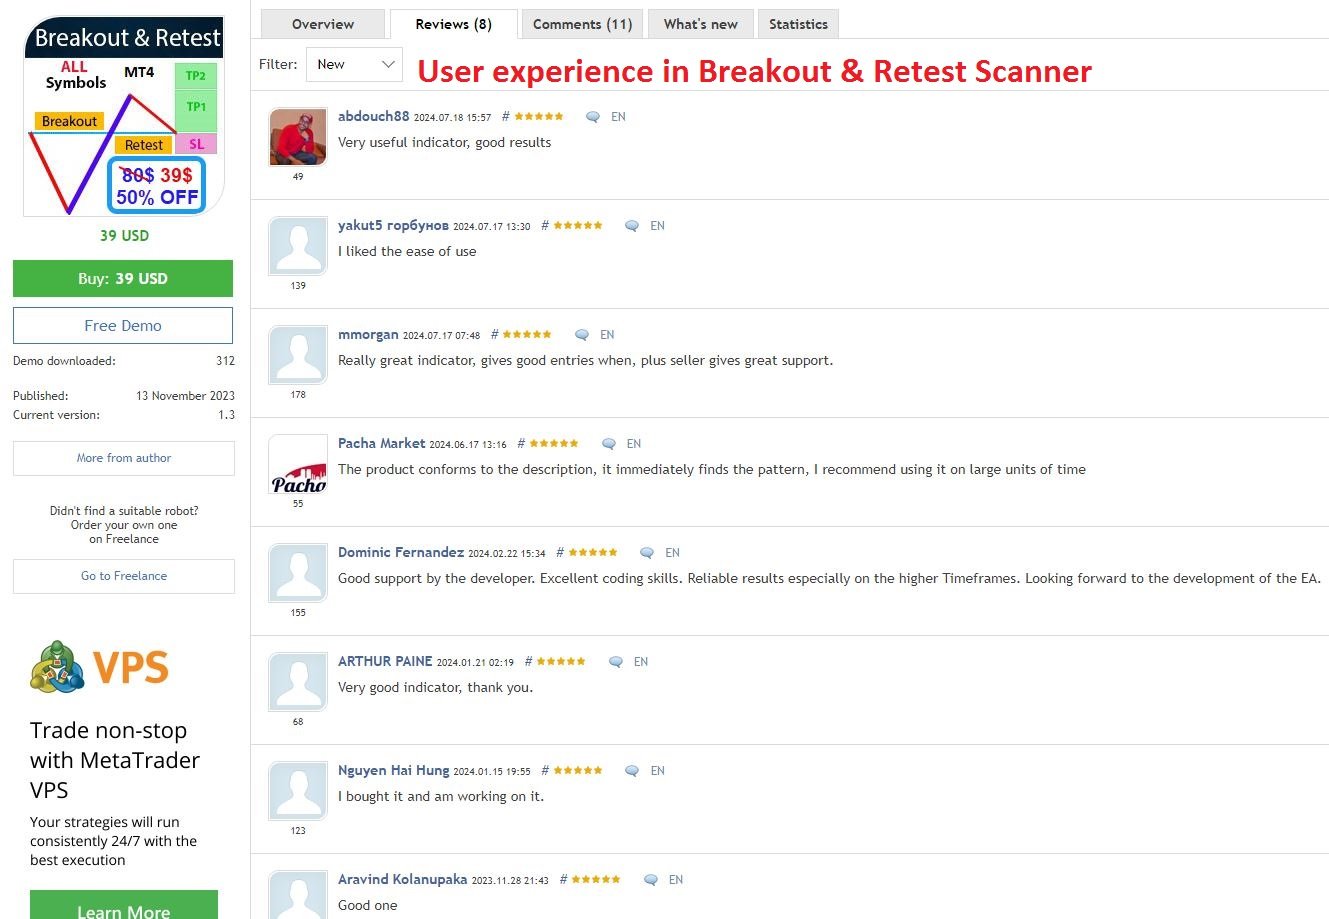
Breakout and retest Scanner Indicator
It is usually difficult for a trader to recognize patterns on a chart, as well as searching for dozens of charts and time frames will take time, and there is also a possibility of a trader's mistake in calculations. This indicator can automatically search all charts and time frames to find possible patterns in one chart.
Searching, Fibonacci calculations and pattern recognition are completely the responsibility of the indicator; All you have to do is "press the scan button".
How To Trade?
All parameters necessary to enter the trade are calculated, such as entry point, stop-loss, and take-profit.
By observing the signal and deciding to trade, we enter the trade with the "set and forget" method.