• 概述
  • 评论
  • 评论
  • 新特性

Atr meter all TimeFrame

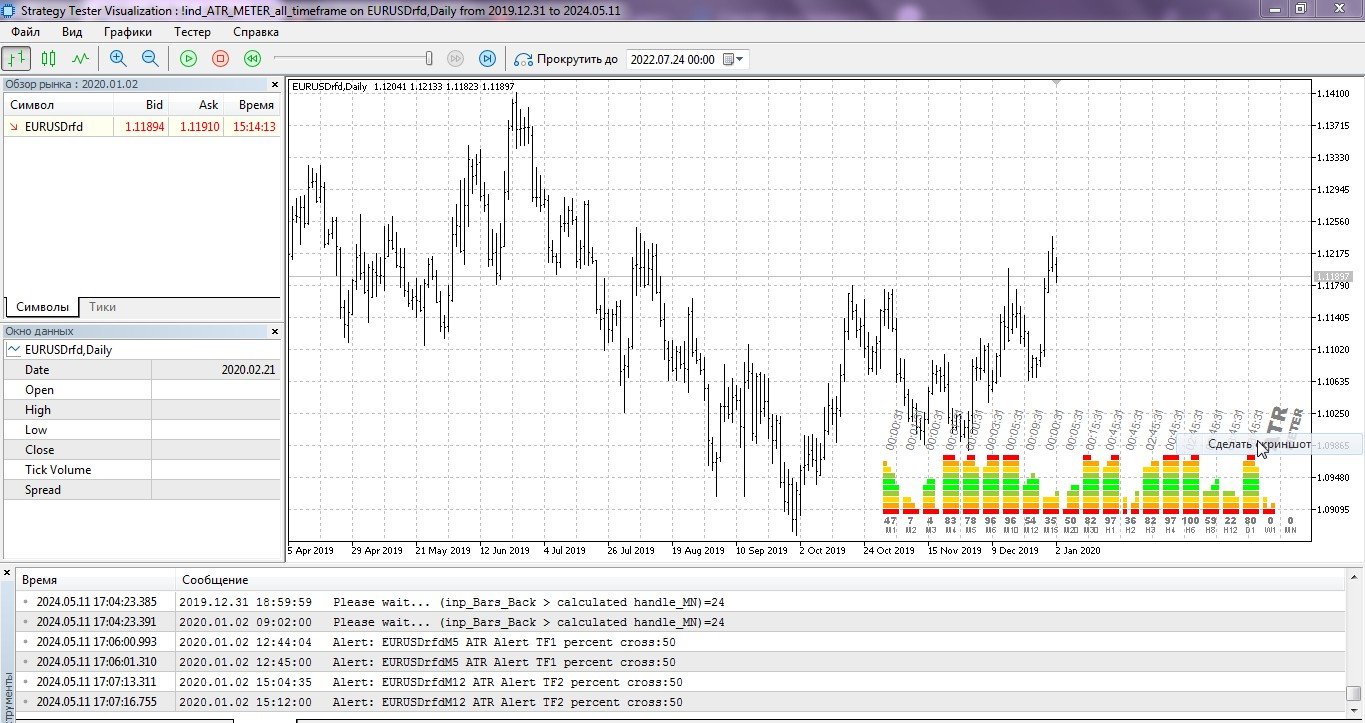
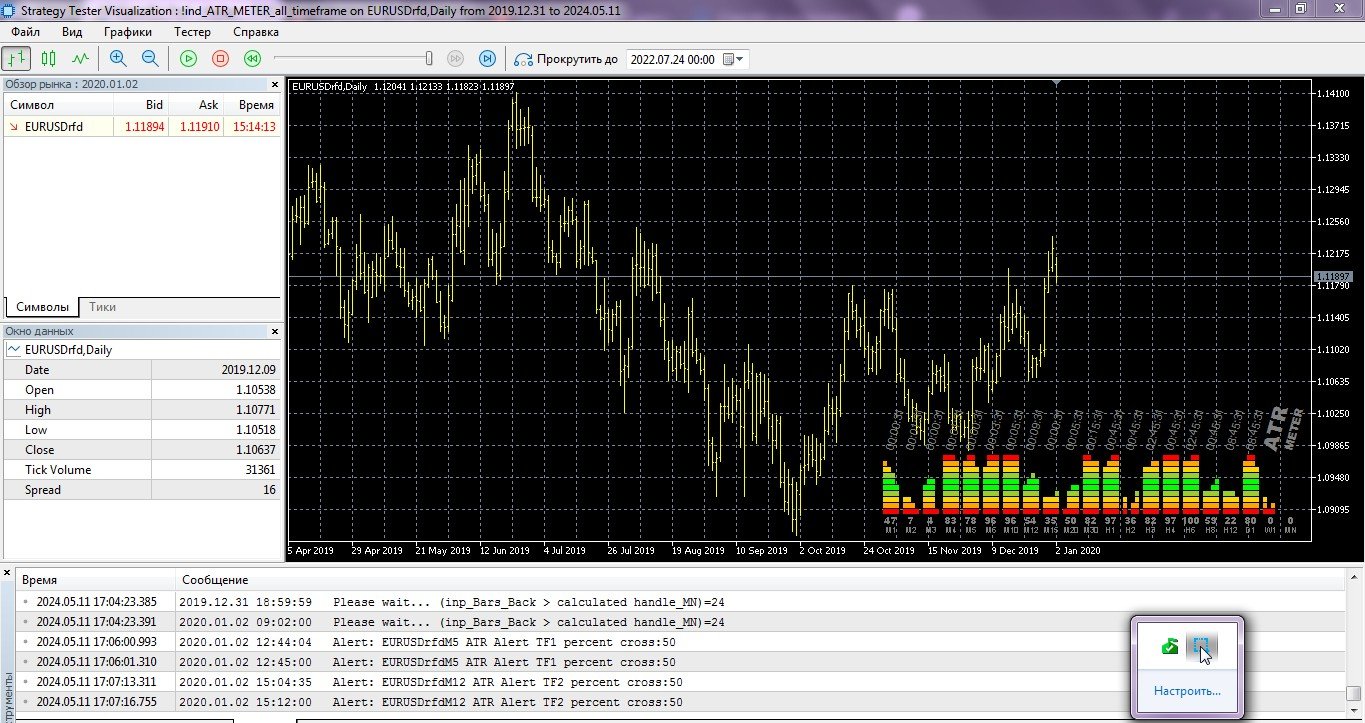
该指标旨在快速确定仪器的波动性。 改变图表是非常方便的,以立即了解哪些工具和时间段有一个活跃的交易,以及哪里有一个平静。 该指标使用转换成百分比的ATR指标的数据。 如果您将ATR放在图表上,大约100-300条将在屏幕上可见,我将此值平均并默认设置为150(您可以自行决定在设置中更改它)。 操作原理:我们取150个ATR值,找到最大和最小,它们之间的距离是100%,基于此我们计算当前位置的百分比。 指标的每一列对应于它自己的时间段,分为4段(3、2、1、0是当前的柱)。 这样做是为了说明ATR指标的行为。

设置:
1)"警报如果信号"组

如果指标超过50%,将显示一个包含工具描述和周期的窗口。

使用警报1TF如果信号-是否使用信号通知

信号时间段1-信号搜索时间段

到目前为止,已经完成了5个时间段。.. (如有必要,您可以添加)

2)ATR设置

ATR周期=14-默认

历史条返回-使用多少条来计算100%百分比

3)查看和警报系统信息-显示有关指示器操作的系统信息

使用建议:

为了实现指标的最佳和快速操作,您应该减少图表上显示的柱线数量:

在MetaTrader5的菜单->工具->设置->图表->最大值。 窗口中的条(值越低,使用的内存越少,工作速度越快)。

在第一次启动时,指示器将加载所有时间段的历史数据,因此,第一次启动可能需要一些时间(取决于您的计算机和互联网连接的速度)
推荐产品
SMC Venom 模型 BPR 指標是針對在智慧貨幣 (SMC) 概念內工作的交易者的專業工具。它會自動辨識價格圖表上的兩種關鍵模式: FVG (公平價值缺口)是三根蠟燭的組合,其中第一根和第三根蠟燭之間存在缺口。它在水平之間形成一個沒有成交量支撐的區域,這通常會導致價格調整。 BPR (平衡價格區間)是兩種 FVG 模式的組合,形成一個「橋樑」 - 當價格以低成交量活動移動時,突破並返回到水平的區域,從而在蠟燭之間產生間隙。 這些模式可協助交易者透過分析圖表上的交易量和價格動態(大型市場參與者和普通參與者之間的互動)來識別關鍵的支撐/阻力位、突破區域和切入點。 此指標以矩形和箭頭的形式可視化模式,也支援靈活的警報設定。 主要特點: 模式顯示模式:選擇顯示 BPR 模式(看漲和看跌)或 FVG 模式(看漲和看跌)。 可以隱藏所有圖表分析模式。 以條數過濾:BPR 結構中 FVG 之間的最小/最大距離。 訊號的附加視覺化: 箭頭有 9 種類型可供選擇(標準、細、分形等)或手動輸入 Wingdings 代碼,其表格可以選擇性地顯示在圖表上。 設定顏色、尺寸及其縮放時相對於價格的動態
Visual Range Directional Force Indicator
AL MOOSAWI ABDULLAH JAFFER BAQER
Range Directional Force Indicator – Designed for You to Optimize! The Range Directional Force Indicator is a cutting-edge tool designed to empower traders by visualizing market dynamics and directional strength. Built to offer insights into market trends and reversals, this indicator is an invaluable asset for traders seeking precision in their strategies. However, it is important to note that this indicator is not optimized, leaving room for you to tailor it to your unique trading preferences.
ToolBox 360 is the swiss knife of all indicators. It is full packed with useful tools to help you with your trading. It can be used to find best entry and exit points and help you to decide if you should open a trade or not. It shows market trends, candlestick formations outside / inside bars and you can sett time based allerts. Main features: Time based Fibonacci lines Choose a start and end time and the indicator shows you Fibonacci lines within the selected time range including range high a
Riko Trend mt5
Nadiya Mirosh
The Riko Trend indicator is a revolutionary trend trading and filtering solution with all the important features of a trend tool built into one tool! The Riko Trend indicator is good for any trader, suitable for any trader for both forex and binary options. You don’t need to configure anything, everything is perfected by time and experience, it works great during a flat and in a trend. The Riko Trend indicator is a technical analysis tool for financial markets that reflects the current price f
Blahtech Market Profile MT5
Blahtech Limited
5 (10)
Was: $249  Now: $149   Market Profile defines a number of day types that can help the trader to determine market behaviour. A key feature is the Value Area, representing the range of price action where 70% of trading took place. Understanding the Value Area can give traders valuable insight into market direction and establish the higher odds trade. It is an excellent addition to any system you may be using. Inspired by Jim Dalton’s book “Mind Over Markets”, this indicator is designed to suit the
AVP Market Sentiment 是一个用于分析多个资产在同一子图窗口中关系的工具。它在比较具有较强相互关系的股票代码时尤其有用(例如,期货指数与VIX)。当你需要同时监控多个股票代码并基于其中一个或多个做出决策时,这个工具非常有帮助。该工具允许用户选择平台上使用的移动平均类型,设置这些平均值的周期,并自定义每条显示线的颜色。它是一个轻量级、计算快速并且在分析上极其多功能的工具。 在变动收益中的市场分析重要性 在变动收益的动态世界中,市场分析是投资者用来最大化回报并最小化风险的关键工具。全球金融市场的复杂性要求对不同资产之间的相互关系有深刻的理解,包括货币对、黄金和白银等贵金属、期货指数以及VIX(波动率指数)。 全球互相关联 金融市场是错综复杂地相互连接的。一个市场的波动可能对其他市场产生重大影响。例如,EUR/USD 等货币对的波动可以直接影响黄金和白银等商品的价值。这是因为这些商品的价值通常以美元计价,因此它们对汇率波动非常敏感。 此外,像美国和欧元区等主要经济体的货币政策会影响汇率,从而影响商品市场。例如,当美联储改变利率时,可能会引发一系列连锁反应,从股市到石油价格都
General Description In the simplest terms this is a contrarian intra-day scalping system. Built to try and let correct trades run as far as possible and flip the trade when indicated. The indicator looks at historical daily trading ranges to lay out levels at which it takes long and short positions based on the statistical levels. The indicator is built around index futures, mainly around S&P and the DOW but can be used an any futures contract mainly using AMP Futures to trade. The indicator is
Antique Trend
Nadiya Mirosh
The Antique Trend Indicator is a revolutionary trend trading and filtering solution with all the important features of a trend tool built into one tool! The Antique Trend indicator is good for any trader, suitable for any trader both for Forex and binary options. There is no need to configure anything, everything has been perfected by time and experience, it works great during flats and trends. The Antique Trend indicator is a tool for technical analysis of financial markets, reflecting curren
Gecko EA MT5
Profalgo Limited
5 (1)
NEW PROMO: Only a few copies copies available at 349$ Next price: 449$ Make sure to check out our " Ultimate EA combo package " in our   promo blog ! Gecko runs a simple, yet very effective, proven strategy.  It looks for important recent support and resistance levels and will trade the breakouts.  This is a "real" trading system, which means it will use a SL to protect the account.  It also means it will not use any dangerous techniques like martingale, grid or averaging down. The EA shows its
Awesome Oscillator by Bill Williams with the ability to fine-tune and replace the averaging algorithms of the indicator, which significantly expands the possibilities of using this oscillator in algorithmic trading and brings it closer in its properties to such an indicator as the MACD. To reduce price noise, the final indicator is processed with an additional Smooth averaging. The indicator has the ability to give alerts, send mail messages and push signals when the direction of movement of th
Ignition
Dansie Software Limited
Strategy Overview The Ignition EA tries to take advantage of sudden momentum when the Ignition pattern is detected. The final bar in the ignition pattern has a small opening wick, a very little or no closing wick, is large in comparison to recent bars and must start from the lower end of the current range (for a bullish ignition) Quick Testing Use Symbol EURUSD, Timeframe M2, and remove the GBPUSD symbol from the "Symbols" input (stratergy 1 and stratergy 2) Settings The below settings appe
Profile Map MT5
Dmitriy Sapegin
5 (5)
Market Profile helps the trader to identify the behavior if major market players and define zones of their interest. The key feature is the clear graphical display of the range of price action, in which 70% of the trades were performed. Understanding of the location of volume accumulation areas can help traders increase the probability of success. The tool can be used as an independent system as well as in combination with other indicators and trading systems. this indicator is designed to suit
PZ Mean Reversion MT5
PZ TRADING SLU
3 (2)
采用专业和量化方法进行均值回归交易的独特指标。它利用了价格以可预测和可衡量的方式转移并返回均值这一事实,这允许明确的进入和退出规则大大优于非量化交易策略。 [ Installation Guide | Update Guide | Troubleshooting | FAQ | All Products ] 清晰的交易信号 非常容易交易 可定制的颜色和尺寸 实现性能统计 优于大多数交易策略 显示合适的止损和止盈水平 它实现了电子邮件/声音/视觉警报 这个怎么运作 该指标从更高的时间范围测量完全可定制的移动平均线的标准偏差,并使用趋势跟踪方法精确地找到交易。交易是通过深入当前图表的价格行为发现的,并在价格返回到平均价格区间时关闭,根据您选择的更高时间范围计算。由于其编码方式,该指标将远离高波动性和强劲趋势市场,并且仅在可预测的情况下进行交易,在可接受的波动性与方向性比率范围内,回归均值是可行的。 指标剖析 绿线是更高时间范围内的移动平均线(也就是平均值) 虚线区域是移动平均线周围的典型价格区间 蓝线是看涨交易的突破价格 红线是看跌交易的突破价格 交易是针对均值进行的,并在典型的价格
我们的   Basic Support and Resistance   指示器是提高技术分析所需的解决方案。该指标允许您在图表/ MT4版本 功能 斐波那契水平的集成: 可以选择显示斐波那契水平以及支持和阻力水平,我们的指标使您对市场行为和可能的逆转区域有更深入的了解。 性能优化: 只能在每个栏的打开时更新扩展线,我们的指标可确保最佳性能,而无需牺牲支持和阻力级别的准确性。 输入 主设置 Timeframe:   通过此输入,您可以选择在图表上显示较高时间范围的支撑线和阻力线。 Support/Resistance Strength [Number of Bars]:   使用此输入,您可以确定支撑和电阻的强度。数量越高,支持/阻力越强。 Price mode:  此参数允许您选择哪种价格将用于计算支持和电阻水平。它可以是收盘价,最高价格,最低价格等。取决于您的策略和偏好,您可以选择最适合您需求的价格。 显示设置 Display Fibonacci levels:   此参数确定是否将显示斐波那契水平以及图表上的支持和电阻级别。斐波那契水平是技术分析中使用的关键水平,并使用斐
该指标建立当前报价,可以与历史报价进行比较,并在此基础上进行价格走势预测。指示器有一个文本字段,用于快速导航到所需日期。 选项: 符号 - 选择指标将显示的符号; SymbolPeriod - 选择指标从中获取数据的时段; IndicatorColor - 指示器颜色; HorisontalShift - 由指标绘制的报价移动指定的柱数; Inverse - true 反转引号,false - 原始视图; ChartVerticalShiftStep - 图表垂直移动(键盘上的向上/向下箭头); 接下来是文本字段的设置,您可以在其中输入日期,您可以通过按“回车”立即跳转到该日期。 接下来是文本字段的设置,您可以在其中输入日期,您可以通过按“回车”立即跳转到该日期。
Provided Trend
Nadiya Mirosh
Provided Trend is a complex signal formation indicator. As a result of the work of internal algorithms, you can see only three types of signals on your chart. The first is a buy signal, the second is a sell signal, and the third is a market exit signal. Options: CalcFlatSlow - The first parameter that controls the main function of splitting the price chart into waves. CalcFlatFast - The second parameter that controls the main function of splitting the price chart into waves. CalcFlatAvg - Para
NeuroExt
Dmytryi Voitukhov
4 (11)
https://t.me/mql5_neuroExt 當前版本和討論。 您可以使用任何工具。基礎將在訓練開始時自動創建。如果您需要從 0 開始訓練 - 只需刪除數據庫文件。 一般條款。 可以訓練 EA 交易在任何工具上工作。 不要試圖在沒有神經網絡訓練的情況下進行測試! 訓練後的平衡圖是水平的就足夠了。 生成訓練基地非常簡單。 美元兌瑞郎可進行準備培訓。 為了正確操作,必須只有一對一帳戶!顧問,只有一個!工具。否則,平衡控制將不起作用。 初始存款 - 200 美元起。 選項: - OrderComm:在訂單中會補充一個操作方式和分析深度的標誌。 - 工作類型:學習\工作\市場。 “學習”——在這種模式下,你需要達到一個至少有輕微增加的時間表。沒有洞。此模式也可用於工作,但市場上一次只會有 1 個訂單。 “工作” - 定期加載數據庫。在測試人員同時進行培訓並不斷提高培訓質量的情況下。 “市場” - 僅供市場接收。需要切換。 - 我的百分比:... - SL:如果你在訓練模式下設置=0,40到110的值會被自動分配,會導致交易過多、學習緩慢和圖像失真。當 MaxOrders>1 且 Wor
FREE
Maximum Trend Arrows OT MT5
Mulweli Valdaz Makulana
STRICTLY FOR BOOM INDEX ONLY!!!!! Here I bring the Maximum Trend Arrows OT1.0 MT5 indicator. This indicator is made up of a combination of different trend indicators for entries and exits, for entries an orange arrow will paint on the chart below the current market and a red flag for closing of trades and it produces buy arrows only. When the orange arrow appears, it will appear along with it's sound to notify you. The 1H timeframe is recommended, don't use it anywhere else than on the 1H timefr
High Low Open Close
Alexandre Borela
4.98 (43)
如果你象这个项目一样,就有5个饥饿审查。 这项指标采用了既定价格的公开、高、低价和关闭价格 可以对特定时间区加以调整。 许多机构和专业人士都认为这些是重要的。 贸易商可以为你了解他们可能更进一步的地点, 积极。 现有期间为: 前一日。 前一星期。 曾任Month。 曾任。 前一年。 或: 目前日。 目前周。 目前 Month。 目前配额。 今年。
FREE
Before installing the HeatMap indicator make sure you are using a broker that gives you access to the Depth of market (DOM) !! This indicator creates a heatmap on your chart allowing you to see the buy or sell limit orders easily and in real time. You have the possibility to change the setting and the colors of the HeatMap in order to adapt to all markets and all charts. Here is an example of a setting you can use with the NASDAQ100 on the AMPGlobal broker :  https://www.youtube.com/watch?v=x0Y
Show Pips for MT5
Roman Podpora
4.64 (22)
对于那些总是想了解帐户当前情况的人来说,此信息指示器将很有用。 -   更多有用的指标 该指标显示诸如利润点数、百分比和货币等数据,以及当前货币对的点差以及柱在当前时间范围内收盘的时间。 有多种选项可用于将信息线放置在图表上: 价格右侧(运行在价格后面); 作为评论(在图表的左上角); 在屏幕的选定角落。 还可以选择信息分隔符: | / \ # 该指标易于使用且信息丰富。可以在设置中禁用不必要的信息项目。 设置 外观类型     - 信息行的显示类型。有以下三种选择: 跟随价格     - 遵循价格; 作为评论     - 作为评论; 在屏幕的选定角落     - 在屏幕的选定角落。 附件图角     - 如果您选择屏幕选定角的显示类型,则此项目允许您选择四个捕捉角之一; 显示利润?       - 该参数负责以存款货币显示利润; 以百分比显示利润?       - 该参数负责以百分比形式显示利润; 显示传播?       - 该参数负责显示当前点差; 显示酒吧关闭时间?       - 该参数负责显示柱关闭之前的时间; 文字颜色     - 文字颜色; 盈利颜色     - 存在
FREE
Buy Sell Chill Indicator
Santino Emanuele Ventre
Take the stress out of trading with the Buy Sell Chill Indicator —your ultimate companion for effortless trend identification. This easy-to-use tool gives you a clear visual arrow to show the direction the market is about to take, making trading decisions as simple and "chill" as possible. Why Choose the Buy Sell Chill Indicator? Relaxed and Intuitive : Designed to make trading less stressful and more enjoyable by giving you straightforward signals with no clutter. Customizable Features : ATR Pe
Liquidity Oscillator
Paolo Scopazzo
5 (1)
A powerful oscillator that provide Buy and Sell signals by calculating the investor liquidity. The more liquidity the more buy possibilities. The less liquidity the more sell possibilities. Please download the demo and run a backtest! HOW IT WORKS: The oscillator will put buy and sell arrow on the chart in runtime only . Top value is 95 to 100 -> Investors are ready to buy and you should follow. Bottom value is 5 to 0 -> Investors are ready to sell and you should follow. Alert + sound will appe
This is my first ExpertAdvisor, but it came along with more than 7 years in experience trading Forex , Crypto and Index.                                                                                SHEERAN: The Advanced Multi-Timeframe EA for Dynamic and Adaptive Trading   EA SHEERAN, is designed for traders who demand precision, flexibility, and reliability across multiple timeframes. Whether you’re targeting short-term gains on the M30 chart or looking for sustained moves on the H4, this E
Your Trend Friend
Luigi Nunes Labigalini
5 (1)
The trend is your friend! Look at the color of the indicator and trade on that direction. It does not  repaint. After each candle is closed, that's the color of the trend. You can focus on shorter faster trends or major trends, just test what's most suitable for the symbol and timeframe you trade. Simply change the "Length" parameter and the indicator will automatically adapt. You can also change the color, thickness and style of the lines. Download and give it a try! There are big movements w
Pullback Hunter
Anton Polkovnikov
PULLBACK HUNTER (回调猎手) 每个交易员的终极梦想是什么?要毫不迟疑地看到反转将在哪里发生。当然,这也是一种魔法,虽然... 没有什么是不可能的。但与此同时,我为你准备了一个指标,它可以实时标记当前运动的修正结束,或者简而言之,它可以捕捉到反转的情况。什么是主旨?许多人在价格向开仓方向移动时练习反弹。他们在新极点的形成过程中这样做。一切都很好,但在这种情况下,头寸的加权平均价格并不理想。但如果我们等待回调并在趋势中买入,我们将获得一个良好的平均价格。这个指标显示了矫正运动可能结束的地方。 什么是重要的?不建议 "正面 "使用指示器。也就是说,在向上的箭头上买入,等待向下的箭头来关闭购买。指标的最佳用途是设定一个位置。通过这个额外的工具,你可以过滤你的方向,并在箭头上买入(或做空)被过滤的方向。例如,你使用累积三角洲。它向你展示了整个市场的购买情况。你等待上升的箭头,然后买入。使用额外的分析工具来退出头寸。 该指标的原理是什么?箭头是价格测试支撑或阻力水平的地方。这些水平是由指标内部的算法计算出来的。一个相同的蜡烛图可能同时测试几个支撑位。这可以通过箭头的颜色看出。如果烛
Blahtech Supply Demand MT5
Blahtech Limited
4.54 (13)
Was: $299  Now: $149  Supply Demand uses previous price action to identify potential imbalances between buyers and sellers. The key is to identify the better odds zones, not just the untouched ones. Blahtech Supply Demand indicator delivers functionality previously unavailable on any trading platform. This 4-in-1 indicator not only highlights the higher probability zones using a multi-criteria strength engine, but also combines it with multi-timeframe trend analysis, previously confirmed swings
GoldTrader
Yashar Seyyedin
Please backtest with the exact balance of your live account before applying to real money. ==> If account balance is too low it may not trade at all! For MT4 version please contact via private message. martingale version is available here . Strategy description - Detect trend based on EMA18-EMA50-SMA200 alignment in three time frames: M15, H1, H4 - Trade in trend direction and exit when above alignment is broken. - The bot is tuned to trade XAUUSD(Gold). - The bot output is break even in rangin
FREE
趋势捕捉器: 具有警示指标的趋势捕捉器策略是一种多功能的技术分析工具,可帮助交易员识别市场趋势和潜在的进出点。它采用动态趋势捕捉器策略,根据市场条件进行调整,清晰地呈现趋势方向。交易员可以自定义参数,以符合其偏好和风险容忍度。该指标有助于识别趋势,发出潜在的反转信号,充当跟踪止损机制,并提供实时警报,以便及时应对市场。 具有警示指标的趋势捕捉器策略是一种多功能的技术分析工具,可帮助交易员识别市场趋势和潜在的进出点。它采用动态趋势捕捉器策略,根据市场条件进行调整,清晰地呈现趋势方向。交易员可以自定义参数,以符合其偏好和风险容忍度。该指标有助于识别趋势,发出潜在的反转信号,充当跟踪止损机制,并提供实时警报,以便及时应对市场。 特点: 趋势识别:信号牛市趋势和熊市趋势。 趋势反转:当蜡烛颜色从牛市变为熊市,反之亦然时,提醒可能的反转。 实时警报:为新趋势识别生成警报。 建议: 货币和货币对:EURUSD,AUDUSD,XAUUSD... 时间框架:H1。 账户类型:任何ECN,低点差账户。
FREE
Elevate Your Trading Experience with Wamek Trend Consult!   Unlock the power of precise market entry with our advanced trading tool designed to identify early and continuation trends. Wamek Trend Consult empowers traders to enter the market at the perfect moment, utilizing potent filters that reduce fake signals, enhancing trade accuracy, and ultimately increasing profitability.   Key Features: 1. Accurate Trend Identification: The Trend Consult indicator employs advanced algorithms and unparall
该产品的买家也购买
Golden Trend Indicator MT5
Noha Mohamed Fathy Younes Badr
4.89 (18)
Golden Trend indicator  is The best indicator for predicting trend movement this indicator never lags and never repaints and never back paints    and give  arrow buy and sell    before the candle appear  and it will help you and  will make your trading decisions clearer its work on all currencies and  gold and crypto and all time frame This unique  indicator uses very secret algorithms to catch the  trends, so you can trade using this indicator and see the trend clear on charts  manual guide and
Quantum TrendPulse
Bogdan Ion Puscasu
5 (13)
介绍 Quantum TrendPulse   ,这是一款终极交易工具,它将 SuperTrend   、   RSI 和 Stochastic 的强大功能整合到一个综合指标中,以最大限度地发挥您的交易潜力。该指标专为追求精准和效率的交易者而设计,可帮助您自信地识别市场趋势、动量变化以及最佳进入和退出点。 主要特点: 超级趋势整合: 轻松跟随当前的市场趋势并乘上盈利浪潮。 RSI 精度: 检测超买和超卖水平,非常适合把握市场逆转时机,可用作 SuperTrend 的过滤器 随机精度: 利用随机振荡在波动的市场中寻找隐藏的机会, 用作超级趋势的过滤器 多时间范围分析: 从 M5 到 H1 或 H4,在不同时间范围内关注市场动态。 可定制的警报: 当您的自定义交易条件得到满足时收到通知,这样您就不会错过任何交易。 无论您是新手还是经验丰富的交易员,   Quantum TrendPulse 都能为您提供所需的优势,帮助您增强策略并自信地进行交易。借助这一强大的指标,将洞察力转化为利润 — 掌控您的交易! ***购买 Quantum TrendPulse,即可免费获得 Quantum Tr
TPSproTREND PrO MT5
Roman Podpora
4.72 (18)
VERSION MT4        —        ИНСТРУКЦИЯ RUS           —        INSTRUCTIONS  ENG 主要功能: 准确的输入信号,无需渲染! 如果出现信号,它仍然相关!这是与重提指标的一个重要区别,重提指标可以提供信号然后改变信号,这可能导致存款资金的损失。现在您可以以更高的概率和准确度进入市场。还有一个功能是在箭头出现后为蜡烛着色,直到达到目标(止盈)或出现反转信号。 显示止损/获利区域 为了提高搜索切入点时的视觉清晰度,创建了一个模块,该模块最初显示买入/卖出区域,在该区域中搜索进入市场的最佳点。用于处理止损水平的附加智能逻辑有助于随着时间的推移减小其大小,从而降低进入交易(移动 sl)时的初始风险。 显示较高时间范围内的最小值/最大值(MTF 模式) 添加了一项功能,可以显示较高时间间隔的最小/最大校正位置,并显示趋势变化。此外,MIN/MAX 现在有编号,显示修正内容。 风险回报率 (RR) 使用指标算法,可以检测精确的入场点,平均风险回报比超过1k2。这也伴随着视觉效果,例如,收到信号后会出现蜡烛的彩色草图。 无论
TPSpro RFI Levels MT5
Roman Podpora
4.55 (20)
反转区域 / 峰值交易量 / 主要参与者的活跃区域 =       TS TPSPRO系统 俄语使用说明     /       指示     英语     /           MT4版本      该指标的每位购买者还可免费获得: 6 个月内可访问 RFI SIGNALS 服务的交易信号 - 根据 TPSproSYSTEM 算法准备的切入点。 定期更新的培训材料 - 让您沉浸在策略中并提高您的专业水平。 工作日每天 24 小时提供支持,并可以访问封闭的交易者聊天室 - 沟通、协助和市场情况分析。 作者设定的文件——自动指标设置,无需额外努力即可实现最大效果。 主要功能: 显示卖家和买家的活跃区域! 指标显示所有正确的买入和卖出第一脉冲水平/区域。当这些水平/区域被激活时,即开始寻找切入点的地方,水平会改变颜色并填充特定颜色。还会出现箭头,以便更直观地了解情况。 LOGIC AI - 激活模板时显示用于搜索入口点的区域(圆圈) 为了提高视觉清晰度,添加了使用人工智能搜索入口点的显示区域的功能。 显示更高时间范围内的级别/区域(MTF 模式) 添加了使用更高时间间隔显示级别/区域
可以说,这是您可以为MetaTrader平台找到的最完整的谐波价格形成自动识别指标。它检测19种不同的模式,像您一样认真对待斐波那契投影,显示潜在的反转区域(PRZ),并找到合适的止损和获利水平。 [ 安装指南 | 更新指南 | 故障排除 | 常见问题 | 所有产品 ] 它检测19种不同的谐波价格形态 它绘制了主要,衍生和互补的斐波那契投影(PRZ) 它评估过去的价格走势并显示每个过去的形态 该指标分析其自身的质量和性能 它显示合适的止损和获利水平 它使用突破来表明合适的交易 它在图表上绘制所有样式比率 它实现了电子邮件/声音/视觉警报 受斯科特·M·卡尼(Scott M. Carney)的书的启发,该指标旨在满足最纯粹和最熟练的交易者的需求。但是,它采取了一种使交易更容易的方式:在向交易发出信号之前,它会等待Donchian朝正确方向突破,从而使交易信号非常可靠。 斐波那契投影与向量无关 它实现了电子邮件/声音/推送警报 它绘制了ABCD投影 重要提示: 为了符合 Scott M. Carney先生 的商标申诉,某些图案名称已重命名为不言自明的替代方式, Scott M.
MTF Supply Demand Zones MT5
Georgios Kalomoiropoulos
5 (1)
下一代自动化供需区。适用于任何图表的创新算法。所有区域都是根据市场的价格行为动态创建的。 两种类型的警报 --> 1) 当价格触及区域时 2) 当新区域形成时 你不会再得到一个无用的指标。您将获得一个完整的交易策略和经过验证的结果。     新的功能:     价格触及供需区时发出警报     创建新的供应/需求区时发出警报     推送通知警报     以点为单位的区域宽度标签     关于 MTF 的又一个时间表。因此,现在您将能够看到高于当前 3 个时间帧,而不是高于当前 2 个时间帧     启用/禁用警报/区域/MTF 功能的按钮 您获得的优势:     消除交易中的情绪。     客观化您的交易条目。     通过高概率设置提高您的利润。     节省绘图区域的时间。     像专业人士一样交易金融市场。     任何市场的即时多时间框架分析。 你在图表上看到了什么?     蓝色和红色矩形是当前时间范围的供需区。     虚线样式线是当前上方第一个时间范围内的供需区域。     实线样式线是当前上方第二个时间范围内的
精密指数振荡器(Pi-Osc)由Precision Trading Systems的Roger Medcalf开发 版本2经过精心重新编码,以在您的图表上加载速度非常快,还加入了一些其他技术改进,以提高体验。 Pi-Osc旨在提供准确的交易定时信号,旨在找到极端的耗尽点,这些点是市场被迫去触及,以清理每个人的止损单。 该产品解决了一个古老的问题,即知道极端点在哪里,这使得交易员的生活变得更加简单。 这是一个高度复杂的共识指标,与行业标准的振荡器相比,具有一些强大的区别。 它使用的一些特征包括需求指数、资金流动、RSI、随机指标、模式识别、成交量分析、标准偏差极端点以及不同长度上述各种变化的分歧。 乍一看,对于未经培训的人来说,它似乎与任何其他振荡器没有什么不同,但当与其他振荡器(如RSI或动量等)相对比时,这个指标的真正威力开始显现。 据我所知,没有其他振荡器可以频繁地精确指出顶部和底部,具有相同的定期效率。 精密指数振荡器由许多不同的数学方程组成,用于测量多个时间框架采样中的价格和成交量变动,从而高度准确地预测趋势可能发生转折的位置。 PTS Pi-Osc V2非
The   Time_Price_SQ9_Degree   indicator is based on the 9 Gann square. Using this indicator, you can identify strong time and price zones. The indicator displays the levels as a degree value. The degrees can be set in the settings. After launching, the MENU button appears. If it is highlighted, it can be moved to any point on the graph, and after double-clicking on it, it stops being highlighted and menu buttons appear. To hide the menu, just double-click on the button, it will become highlight
Legend mt5
Vladyslava Shaviernieva
This is an indicator that includes the best basic forex indicators , without redrawing. Based on this data, a sell or buy signal is generated. It does not disappear anywhere after the signal, which gives us the opportunity to see the results on the history. It can be used on any currency pair, crypto, metals, stocks It is best used on an hourly chart, but other periods are also acceptable. The best results for the period H1,H4,daily If customers have any questions, I will answer them and af
描述 ICSM(脉冲-修正SCOB映射器)是一个分析价格走势并识别有效脉冲、修正和SCOB(单蜡烛订单块)的指标。它是一个强大的工具,可以与任何类型的技术分析一起使用,因为它灵活、信息丰富、易于使用,并且能显著提高交易者对最具流动性的兴趣区域的认识。 设置 常规 | 视觉 颜色主题 — 定义ICSM的颜色主题。 SCOB | 视觉 显示SCOB — 启用/禁用SCOB; 标记SCOB — 代表SCOB表示的样式选项列表; SCOB颜色 — 定义SCOB的颜色; ICM | 视觉 显示ICM线 — 启用/禁用ICM(脉冲-修正映射器)线; 显示IC趋势 — 通过图表底部的彩色分隔线启用/禁用脉冲-修正趋势的可视化; 线条颜色 — 定义ICM线的颜色; 线条样式 — 定义ICM线的样式; 警报 ICM — 启用/禁用突破ICM线的警报; SCOB — 启用/禁用SCOB创建的警报; ICM+SCOB — 启用/禁用在单个脉冲/修正结束时出现SCOB的警报,该SCOB抓取ICM线的流动性。 ICM+SCOB(同一蜡烛) — 启用/禁用在抓取ICM线流动性
Advanced Supply Demand MT5
Bernhard Schweigert
4.5 (14)
任何新手或专业交易者的最佳解决方案! 该指标是一款独特、高质量、且价格合理的交易工具,因为我们已经整合了许多专有功能和新公式。 依据此更新,您将能够显示双重时间帧区域。 您不仅可以显示一个较高的时间帧,还可以同时显示图表时间帧,加上更高的时间帧:显示嵌套时区。 供需双方所有交易者都会喜欢它。 :) 重要信息披露 高级供需的最大潜力,请访问 https://www.mql5.com/zh/blogs/post/720245   想象您的交易如何得以改善,是因为您能够精准定位入场或目标位吗? 构建于新的底层算法,它可以更轻松地识别出买卖双方之间的潜在失衡。 这是因为它以图形方式展示供需最强劲区域,及其过去的表现(显示旧区域)。 这些功能旨在帮助您更轻松地发现最佳入场区域和价位。 现在您可以针对您的交易品种和时间帧来优化和编辑区域强度! 高级供需指标适用于所有产品和时间帧。 它是一个新的公式,非常新的功能是两个区域强度函数可由用户输入进行调整! 这在交易中是一大优势。 当您学习如何使用专有功能,例如带有价格游离最小 X 因子的区域强度时,您能够判断该区域强劲与否。 供需区域用作警报触发器。
KT Candlestick Patterns MT5
KEENBASE SOFTWARE SOLUTIONS
KT Candlestick Patterns 实时识别并标注出 24 种最可靠的日本蜡烛图形态。自18世纪以来,日本交易员便一直使用蜡烛图预测价格走势。 确实,并非所有蜡烛图形态都能可靠地预测价格方向,但如果与支撑阻力等其他技术分析方法结合使用,它们可以更清晰地反映当前市场状况。 该指标涵盖了许多出现在 Steve Nison 所著《日本蜡烛图技术》中的形态。 除书中图形外,还能识别很多较为复杂但不太为人所知的蜡烛图形态。 功能特点 可设置固定点数为目标,输入成功点数后即可看到每个信号的成功率。 准确识别 24 种日本经典蜡烛图形态。 配备实时统计模块,显示每种形态的表现情况。 可设置图形之间最小间隔柱数,优化图表整洁度与信号质量。 结合市场趋势方向,提高识别的准确性。 包含反转、趋势延续与中性形态(如十字星)。 支持所有 MetaTrader 警报类型。 包含图形 ----- 反转形态 ----- 母子形态 锤头/流星 吞没 三只白兵/三只乌鸦 外包三阳/三阴 内包三阳/三阴 晨星/暮星 挤压形态 带腰带形态 乌云盖顶/刺透形态 推进阻挡/下降阻挡 反击线 阶梯底/顶 跳空
FxaccurateLS
Shiv Raj Kumawat
WHY IS OUR FXACCCURATE LS MT5 THE PROFITABLE ? PROTECT YOUR CAPITAL WITH RISK MANAGEMENT Gives entry, stop and target levels from time to time. It finds Trading opportunities by analyzing what the price is doing during established trends. POWERFUL INDICATOR FOR A RELIABLE STRATEGIES We have made these indicators with a lot of years of hard work. It is made at a very advanced level. Established trends provide dozens of trading opportunities, but most trend indicators completely ignore them! The
TPA True Price Action indicator reveals the true price action of the market makers through 100% non-repainting signals strictly at the close of a candle! TPA shows entries and re-entries, every time the bulls are definitely stronger than the bears and vice versa. Not to confuse with red/green candles. The shift of power gets confirmed at the earliest stage and is ONE exit strategy of several. There are available now two free parts of the TPA User Guide for our customers. The first "The Basics"
MetaBands M5
Vahidreza Heidar Gholami
4.5 (2)
MetaBands使用强大且独特的算法绘制通道并检测趋势,以便为交易者提供进出交易的潜在点。它是一个通道指标和强大的趋势指标。它包括不同类型的通道,可以通过使用输入参数简单地合并以创建新通道。MetaBands使用所有类型的警报通知用户市场事件。 功能 支持大多数通道算法 强大的趋势检测算法 能够合并不同类型的通道 多时间帧和多货币(信号矩阵) 所有类型的警报功能(声音、屏幕闪烁、推送通知、电子邮件、弹出窗口、箭头) 它永远不会重绘 趋势检测 MetaBands使用在通道内振荡的蓝色线来检测趋势。当该线遇到通道的上界时,表明开始下跌趋势,当它遇到下界时,表明开始上涨趋势。如果蓝线接近中线,则市场处于整理期。 该指标使用独特的方法来检测趋势。一开始可能看起来有些复杂,但如果您观看视频教程,您就会意识到它是多么强大且易于使用。 入场和出场信号 当趋势变化或价格穿过上下通道时,MetaBands会立即通过不同的方法提醒交易者,这些方法可以在指标设置中启用。 信号矩阵 要监视来自不同时间框架的多个符号并在一个地方查看信号,请单击右上角按钮或按键盘上的M键以打开信号矩阵。该矩阵可以快速概览
SMT Divergences MT5
Diego Arribas Lopez
MT4 Version SMT Divergences MT5 SMT Divergences is one of the most innovative indicators in the market. It offers the possibility of analyzing price divergences between 2 pairs. These divergences highlight and help to foresee what banks and institutions are planning to do. SMT divergences also provides you with a kill zones indicator and the possibility of filtering divergences occurring during these kill zones.  This indicator is specially powerful if applied in 2 highly correlated pairs. A pri
Entry Points Pro for MT5
Yury Orlov
4.46 (130)
这款指标用于 MT5,可提供准确的入场交易信号,且无重绘。 它可应用在任何金融资产:外汇、加密货币、贵金属、股票、指数。 它将提供极其精准的评估,并告诉您何时开仓和平仓的最佳时机。 观看 视频 (6:22),其中包含一个仅处理单一信号的示例,该信号即可值回指标购价! 大多数交易者在 Entry Points Pro 指标的帮助下,在第一个交易周内即改善了他们的交易结果。 订阅我们的 Telegram 群 ! Entry Points Pro 指标的益处。 入场信号无重绘 如果信号出现,并得到确认,则它不会再消失;不像是重绘指标,它会导致重大的财产损失,因为它们可以在显示信号后再将其删除。 无差错开仓 指标算法可令您找到入场交易(买入或卖出资产)的理想时机,从而提高每位交易者的成功率。 Entry Points Pro 可操作任何资产 它允许您在 MT5 平台上交易任何经纪商的加密货币、股票、贵金属、指数、大宗商品和货币。 提供任何方向的信号 Entry Points Pro 指标提供针对任意价格走势的入场交易信号 - 上涨、下跌或横盘(横向)。 最大盈利潜力 离场信号
Volume by Price MT5
Brian Collard
3.25 (4)
Volume Profile, Footprint and Market Profile TPO (Time Price Opportunity). Volume and TPO histogram bar and line charts. Volume Footprint charts. TPO letter and block marker collapsed and split structure charts. Static, dynamic and flexible range segmentation and compositing methods with relative and absolute visualizations. Session hours filtering and segment concatenation with Market Watch and custom user specifications. Graphical layering, positioning and styling options to suit the user's a
CONTACT US  after purchase to get the Indicator Manual. Download Now!  Offer valid only for next 10 Buyers.  Price   will   increase  gradually !  Download the  Metatrader 4 Version Read the product description carefully before purchasing the product.  Due to regulatory restrictions, our service is unavailable in certain countries such as India, Pakistan, and Bangladesh. Disclaimer: • Our products are available only on mql5.com. • We never contact anyone or sell our products privately. • We d
Royal Wave Pro M5
Vahidreza Heidar Gholami
3.5 (4)
Royal Wave is a Trend-Power oscillator which has been programmed to locate and signal low-risk entry and exit zones. Its core algorithm statistically analyzes the market and generates trading signals for overbought, oversold and low volatile areas. By using a well-designed alerting system, this indicator makes it easier to make proper decisions regarding where to enter and where to exit trades. Features Trend-Power Algorithm Low risk Entry Zones and Exit Zones Predictions for Overbought and Over
This indicator is a classic implementation of the Market Profile (Volume Profile Visible Range), allowing for the display of price density over time while highlighting the most significant price levels, the value area, and the control price within a specific trading session. MT4-version:   https://www.mql5.com/en/market/product/125261 The indicator can be applied across timeframes from M1 to D1, enabling the analysis of market profiles for daily, weekly, monthly, or intraday trading. Utilizing
CBT Quantum Maverick 高效的二元期权交易系统 CBT Quantum Maverick 是一款精心设计的高性能二元期权交易系统,专为追求精准、简单和纪律的交易者打造。无需自定义,该系统经过优化,可直接使用并产生高效结果。只需遵循信号操作,稍加练习即可掌握。 主要特点: 信号精准度: 基于当前K线生成下根K线交易信号,无频繁重绘。 市场多样性: 专为二元期权交易设计,兼容多种经纪商和资产类别,适应不同交易偏好。 兼容性: Deriv Synthetic Charts :适用于任何时间框架。 OTC Charts :来自如 Quotex、PocketOption、Binomo、Stockity、IQOption、Exnova、OlympTrade、Deriv、Binolla 和 Homebroker 的经纪商,可导入 MT5(一周内提供免费导入支持,之后需支付服务费用)。 外汇、加密货币和商品市场 :扩展资产利用。 高收益二元资产 :建议使用90%以上的高回报率资产。 额外优势: 全面的交易计划: 提供系统化和纪律性交易的分步支持计划。 高效时间利用: 每天仅需一
Super Zone indicator
Dmitriy Sotnikov
5 (1)
Super Zone   For several years of observing the principles of the market, Super Zone worked, both then and now, because the indicator  allows you to see the trading range of the  week and even the month that major market participants use. It’s very easy to use, we work on H4 in the weekly range (  in the tester it doesn’t work in the demo mode  ) - we sell from the upper zones, we buy from the lower ones. It marks the zones from the beginning of the week (month) that are  not redrawn  , works on
MetaForecast M5
Vahidreza Heidar Gholami
5 (3)
MetaForecast能够根据价格数据中的谐波来预测和可视化任何市场的未来走势。虽然市场不总是可预测的,但如果价格中存在模式,MetaForecast可以尽可能准确地预测未来。与其他类似产品相比,MetaForecast通过分析市场趋势可以生成更精确的结果。 输入参数 Past size (过去的尺寸) 指定MetaForecast用于创建生成未来预测模型的柱数量。该模型以一条黄色线绘制在所选柱上。 Future size (未来的尺寸) 指定应预测的未来柱数量。预测的未来以粉色线表示,并在其上绘制了蓝色回归线。 Degree (程度) 此输入确定了MetaForecast将在市场上进行的分析级别。 Degree 描述  0 对于程度0,建议使用较大的值来设置“过去的尺寸”输入,以覆盖价格中的所有高峰、低谷和细节。  1 (建议的) 对于程度1,MetaForecast可以理解趋势,并通过较小的“过去的尺寸”生成更好的结果。  2 对于程度2,除了趋势,MetaForecast还可以识别反转点。对于大于1的程度,必须使用较高的“细节”和“噪音减少”输入值。  大于2 不建议使用大于
PZ Trend Trading MT5
PZ TRADING SLU
3.8 (5)
许多盈利交易者不仅知道如何识别市场趋势,而且也能把握趋势建立后的交易机会。 Pz 趋势交易 指标设计用来在趋势行情中尽可能的赚取利润。 已建立的趋势提供了一揽子交易机会,但大多数趋势交易指标完全忽视了它们,让交易者在趋势行情时完全不知道该如何做!一般趋势指标只通知有关的趋势变化,但根本不足以得到卓越的回报. Pz 趋势交易 指标比一般趋势指标显示多达 20 倍的交易 , 因为它注重所谓的市场时机。它不仅显示当前的市场趋势,也有回调,内柱线的突破和调整。它令您在趋势回调之后介入,安全的柱线内突破金字塔加仓,以及发现潜在的反转,和已知的调整。 趋势改变 一个趋势改变在市场方向变化时发生。趋势变化在图表上用带数字的彩色圆圈显示。蓝色 (1) 信号为上涨开始, 而红色 (1) 信号为下跌开始。趋势变化并非评估当前价格动作的结果, 它意味着交易设置是不定时地。如果您正确使用本指标, 在趋势变化时, 您将将已经入场 (参看下面的调整)。 回调 但凡趋势在运动中,行情上下抖动,盈利者收割利润,且其它参与者入场。趋势回调代表好的买入机会,通常是由主力获利离场导致。如果行情在回调后回归上行, 指标将
Royal Scalping Indicator M5
Vahidreza Heidar Gholami
5 (6)
Royal Scalping Indicator is an advanced price adaptive indicator designed to generate high-quality trading signals. Built-in multi-timeframe and multi-currency capabilities make it even more powerful to have configurations based on different symbols and timeframes. This indicator is perfect for scalp trades as well as swing trades. Royal Scalping is not just an indicator, but a trading strategy itself. Features Price Adaptive Trend Detector Algorithm Multi-Timeframe and Multi-Currency Trend Low
Berma Bands
Muhammad Elbermawi
5 (3)
Berma 波段 (BBs) 指标对于寻求识别和利用市场趋势的交易者来说是一种有价值的工具。通过分析价格与 BBs 之间的关系,交易者可以辨别市场是处于趋势阶段还是区间波动阶段。 访问[ Berma Home Blog ] 了解更多信息。 Berma 带由三条不同的线组成:上 Berma 带、中 Berma 带和下 Berma 带。这些线围绕价格绘制,直观地表示价格相对于整体趋势的变动。这些带之间的距离可以洞察波动性和潜在的趋势逆转。 当 Berma Bands 线相互分离时,通常表明市场正在进入横盘或区间波动时期。这表明缺乏明确的方向性。交易者可能会发现在这些时期内很难识别趋势,因此可能需要等待更清晰的趋势出现。 当 Berma Bands 线汇聚成一条线时,通常表示趋势环境强劲。这种汇聚表明存在明显的方向性偏差,因为价格波动性足以随趋势而变化。交易者可能会发现在这些时期更容易识别潜在的入场点和出场点,因为趋势的势头可以提供有利的交易机会。然而,重要的是要注意整体趋势中的潜在回调或修正。 Berma 带根据价格蜡烛图与上带和下带的相互作用提供明确的买入和卖出信号。当价格蜡烛图首
RelicusRoad Pro MT5
Relicus LLC
4.78 (18)
现在$ 147(更新后增加到$ 499) - 无限帐户(PC或Mac) RelicusRoad 用户手册 + 培训视频 + 访问 Private Discord Group + VIP 身份 一种看待市场的新方式 RelicusRoad 是世界上最强大的外汇、期货、加密货币、股票和指数交易指标,为交易者提供保持盈利所需的所有信息和工具。我们提供技术分析和交易计划,帮助每一位交易者取得成功,从初学者到高级。它是一个关键的交易指标,可以提供足够的信息来预测未来的市场。我们相信一个完整的解决方案,而不是图表上几个没有意义的不同指标。这是一个多合一指标,显示无与伦比且非常准确的信号、箭头 + 价格行为信息。 RelicusRoad 基于强大的人工智能,提供缺失的信息和工具来教育您并使您成为交易专家,成为成功的交易者。 几乎所有技术指标都滞后,这意味着它们只能报告已经发生的事情。因此,他们只确认您过去可以看到的价格已经在哪里。我们相信领先指标可以预测未来价格,而无需重新绘制,也不要过度依赖可能改变并导致重新绘制的滞后指标。如果您根据滞后指标进行交易并建立头寸,您就知道您已经大部分时间
[ MT4 Version ] Are you tired of spending months on demo or live accounts to test your trading strategies? The Backtesting Simulator is the ultimate tool designed to elevate your backtesting experience to new heights. Utilizing Metatrader historical symbol information, it offers an unparalleled simulation of real market conditions. Take control of your testing speed, test ideas quickly or at a slower pace, and witness remarkable improvements in your testing performance. Forget about wasting tim
CONTACT US  after purchase to get the Indicator Manual. Try Now—Limited Discount for the next 10 Buyers! Download the  Metatrader 4 Version Read the product description carefully before purchasing the product.  Due to regulatory restrictions, our service is unavailable in certain countries such as India, Pakistan, and Bangladesh. Disclaimer: • Our products are available only on mql5.com. • We never contact anyone or sell our products privately. • We do not provide any personal trading advice.
筛选:
无评论
回复评论
版本 1.3 2024.05.22
修正:指标已优化和加速(初始化和代码). 重新设计了信号输出菜单。
补充:突出显示(绿色)百分比时,越过一个设定的水平。 如果您指定了所需的时间段,则在通知警报时将发送推送通知。

P.S.:我希望它已经变得更加方便和实用。.. 我在等待您的反馈!