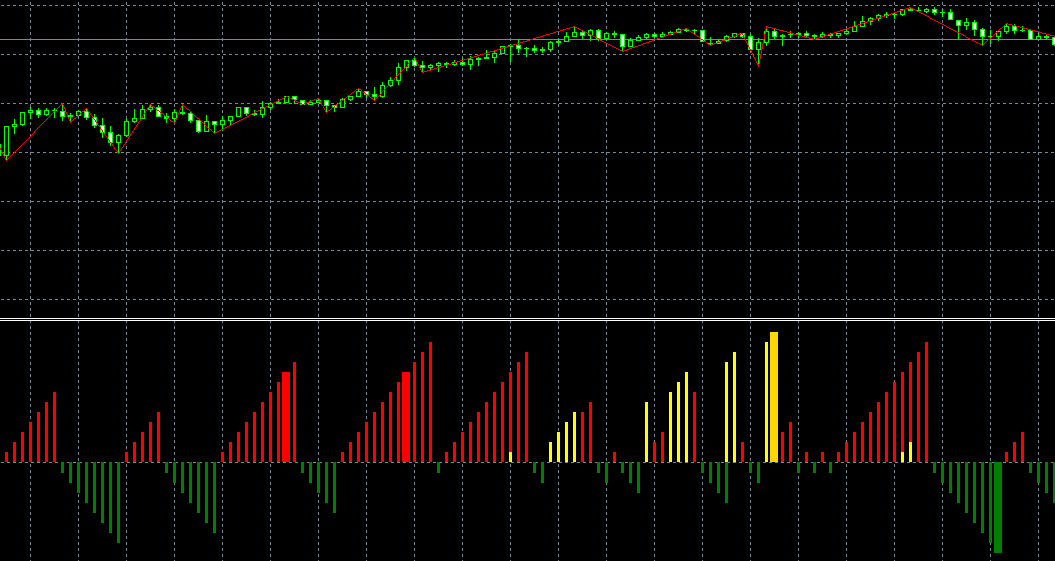
• 概述
  • 评论
  • 评论
  • 新特性

KingSequence

  • 指标
  • You Lu
  • 版本: 2.12
  • 更新: 14 五月 2024
  • 激活: 5

hint: my basic indicators are used like that KingLevel combind with KingSequence will provides basic insights of the price action of the markets and KingSequenceSgn is just for the convienent for watching. And plus with Forex Trading mentor subsccription I will assist you to win the market at first later if it's great will be upgraded to King Forex trading mentor.

Slide 1: Title Slide

Title: Unveiling Market Rhythms with Advanced Price Momentum Analysis

Subtitle: A Revolutionary Trading Indicator Powered by Proprietary Oscillators

Slide 2: Problem

Title: The Challenge of Timely Market Entry and Exit

  • Traders struggle to identify precise entry and exit points for maximum profitability.
  • Existing indicators often lag behind price action, leading to missed opportunities and potential losses.

Slide 3: Solution

Title: Introducing a Cutting-Edge Trading Indicator**

  • Leverages advanced price momentum analysis techniques to anticipate market movements.
  • Employs proprietary oscillators that capture the inherent rhythm of supply and demand.
  • Provides objective and timely signals for informed trading decisions.

Slide 4: Key Features

Title: Unparalleled Market Timing and Analytics

  • Proprietary oscillators based on the principles of price momentum analysis.
  • Objective signals for entry, exit, and trend identification.
  • Customizable parameters to suit individual trading styles.

Slide 5: Benefits

Title: Empowering Traders with Unprecedented Insights**

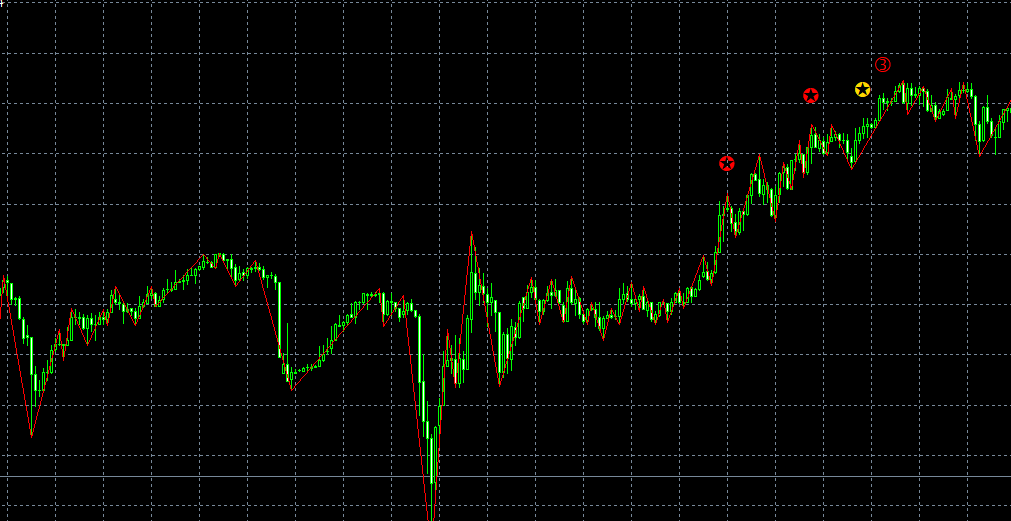
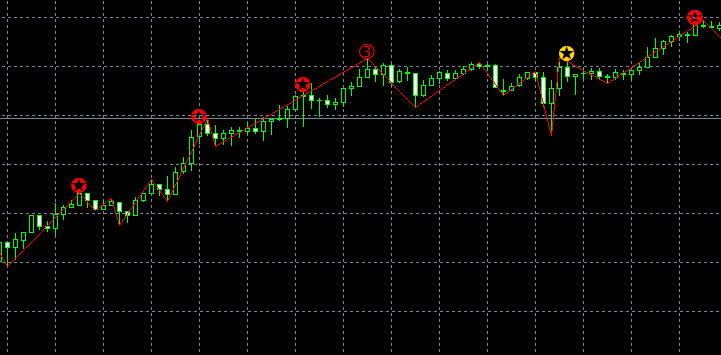
For more convenient use as showing sign on main chart, please try the "KingSequenceSgn" indicator

  • Enhance trading accuracy and profitability.
  • Optimize risk management and minimize losses.
  • Gain a competitive edge in the dynamic trading landscape.

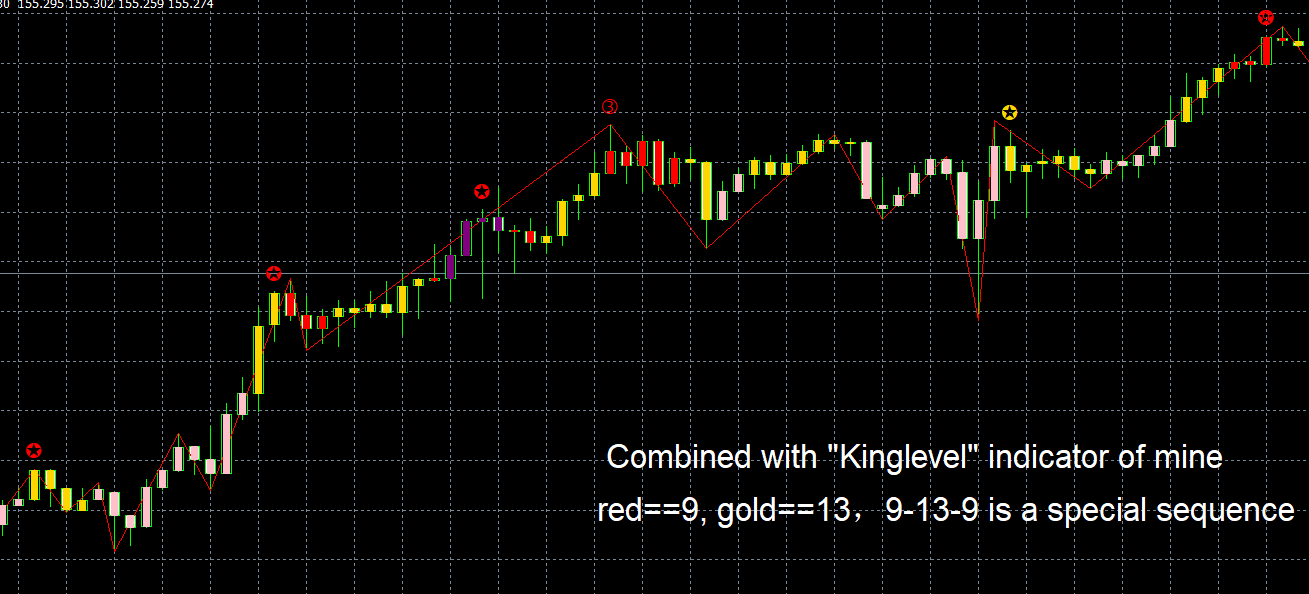
Slide 6: Integration with Kinglevel Indicators

Title: Synergizing for Unmatched Trading Success**

  • Seamless integration with Kinglevel indicators for comprehensive analysis.
  • Leverage the strengths of both indicator suites for amplified results.
  • Unlock a new level of market understanding and trading proficiency.

Slide 7: Call to Action

Title: Elevate Your Trading to New Heights**

  • Experience the power of advanced price momentum analysis.
  • Gain a decisive advantage in the trading markets.
  • Sign up for a free trial today!

Additional Notes:

  • The pitch deck can be further enhanced with visuals, such as charts and graphs, to demonstrate the effectiveness of the PMO indicator.
  • Case studies and testimonials from satisfied users can be added to bolster credibility and showcase the indicator's real-world impact.
  • The call to action should be clear and compelling, urging potential users to take the next step and experience the PMO indicator firsthand
Alert : when you use the demo version, please modify the testing time period instead of default


推荐产品
VR Cub
Vladimir Pastushak
VR Cub 这是获得高质量切入点的指标。该指标的开发是为了促进数学计算并简化对仓位入场点的搜索。多年来,该指标所针对的交易策略已被证明其有效性。交易策略的简单性是其巨大的优势,即使是新手交易者也能成功进行交易。 VR Cub 计算开仓点以及获利和止损目标水平,这显着提高了效率和易用性。查看使用以下策略进行交易的屏幕截图,了解简单的交易规则。 设置、设置文件、演示版本、说明、问题解决,可以从以下位置获取 [博客] 您可以在以下位置阅读或撰写评论 [关联] 版本为 [MetaTrader 5] 计算入场点的规则 开仓 要计算入场点,您需要将 VR Cub 工具从最后一个高点拉伸到最后一个低点。 如果第一个点在时间上早于第二个点,交易者等待柱线收于中线上方。 如果第一个点在时间上晚于第二个点,交易者等待柱线收于中线下方。 根据上述条件,严格在 柱线收盘 后建仓。 换句话说,如果我们在小时图上进行交易,那么从最高点到最低点的时间距离必须超过24小时,最高点和最低点之间的点数必须大于或等于平均价格变动每天。 维持和改变市场地位 可以有多个未平仓头寸;每个头寸都可以单独修改。 VR Cu
Trend Ray
Andriy Sydoruk
The indicator shows the potential trend direction by cyclical-wave dependence. Thus, all the rays of the intersection will be optimal rays, in the direction of which the price is expected to move, taking into account the indicator period. Rays can be used as a direction for potential market movement. But we must not forget that the approach must be comprehensive, the indicator signals require additional information to enter the market.
Owl smart levels
Sergey Ermolov
4.13 (23)
MT5版本  |  FAQ Owl Smart Levels Indicator   是一個完整的交易系統,包含   Bill Williams   的高級分形、構建正確的市場波浪結構的 Valable ZigZag 以及標記準確入場水平的斐波那契水平等流行的市場分析工具 進入市場和地方獲利。 策略的详细说明 指示灯使用说明 顾问-贸易猫头鹰助手助理 私人用户聊天 ->购买后写信给我,我会将您添加到私人聊天中,您可以在那里下载所有奖金 力量在於簡單! Owl Smart Levels   交易系統非常易於使用,因此適合專業人士和剛開始研究市場並為自己選擇交易策略的人。 策略和指標中沒有隱藏的秘密公式和計算方法,所有策略指標都是公開的。 Owl Smart Levels 允許您快速查看進入交易的信號,突出顯示下訂單的水平並向您發送有關已出現信號的通知。 優點很明顯: 清楚地顯示主要和更高時間框架的趨勢方向。 指示儀器信號的出現。 標記開單、止損設置和固定利潤的水平。 沒有多餘的,只有必要的結構! ZigZag   表示全球趨勢的方向,因此也表示貿易方向。 市場反轉點的短線清楚地表明在
Trend PA
Mikhail Nazarenko
5 (3)
The Trend PA indicator uses   Price Action   and its own filtering algorithm to determine the trend. This approach helps to accurately determine entry points and the current trend on any timeframe. The indicator uses its own algorithm for analyzing price changes and Price Action. Which gives you the advantage of recognizing, without delay, a new nascent trend with fewer false positives. Trend filtering conditions can be selected in the settings individually for your trading style. The indicator
Renko, Heiken Ashi, Ticks Bar, Range Bar.    Easy switching, easy setup, all in one window.        Place the Custom Chart indicator and view Renko, Heiken Ashi, Tick bar, Range bar charts in real time at real chart.    Position the offline chart window so that the indicator control panel is visible.    Switch the chart mode by click of a button.    Connect to the output chart any indicator, expert advisor without any restrictions.    No, it doesn't work in the tester.    Yes, you can use an
The indicator detects and displays 3 Drives harmonic pattern (see the screenshot). The pattern is plotted by the extreme values of the ZigZag indicator (included in the resources, no need to install). After detecting the pattern, the indicator notifies of that by a pop-up window, a mobile notification and an email. The indicator highlights the process of the pattern formation and not just the complete pattern. In the former case, it is displayed in the contour triangles. After the pattern is com
Chart Patterns Detect 15 patterns (Ascending Triangle, Descending Triangle, Rising Wedge, Falling Wedge, Bullish Flag, Bearish Flag, Bullish Rectangle, Bearish Rectangle Symmetrical triangle, Head and Shoulders, Inverted Head and Shoulders, Triple top, Triple Bottom, Double Top, Double Bottom) Use historical data to calculate the probability of each pattern to succeed (possibility to filter notification according to the chance of success) gives graphic indication about the invalidation level and
Power Renko MT4
Pierce Vallieres
Power Renko is an indicator which plots Renko bricks underneath the chart using a histogram. You can select the brick size and the timeframe of the Renko bricks as well as whether or not to use the close price or the high/low price of the candles. Renko bricks are based on price alone, not time, therefor the Renko bricks will not be aligned with the chart's time. They are extremely useful for trend trading and many different strategies can be formed from them. Buffers are provided allowing you t
Signal From Level
Yaroslav Varankin
Binary Options Support Resistance Indicator This indicator is designed for binary options trading and effectively shows retracements from support and resistance levels. Signals appear on the current candle. A red arrow pointing downwards indicates a potential selling opportunity, while a blue arrow pointing upwards suggests buying opportunities. All that needs adjustment is the color of the signal arrows. It is recommended to use it on the M1-M5 timeframes as signals are frequent on these timef
“可调分形” - 是分形指标的高级版本,非常有用的交易工具! 据我们所知,标准分形 mt4 指标根本没有设置 - 这对交易者来说非常不方便 可调整分形已经解决了这个问题 - 它具有所有必要的设置: 指标可调周期(建议值-7以上) 距价格高点/低点的可调距离 可调节设计 af 分形箭头 ............................................................................................................. // 这里提供更多优秀的 EA 交易和指标: https://www.mql5.com/en/users/def1380/seller 它是仅在该 MQL5 网站上提供的原创产品。
The indicator detects and displays Shark harmonic pattern (see the screenshot). The pattern is plotted by the extreme values of the ZigZag indicator (included in the resources, no need to install). After detecting the pattern, the indicator notifies of that by a pop-up window, a mobile notification and an email. The indicator highlights the process of the pattern formation and not just the complete pattern. In the former case, it is displayed in the contour triangles. After the pattern is comple
PZ Penta O MT4
PZ TRADING SLU
The Penta-O is a 6-point retracement harmonacci pattern which usually precedes big market movements. Penta-O patterns can expand and repaint quite a bit. To make things easier this indicator implements a twist: it waits for a donchian breakout in the right direction before signaling the trade. The end result is an otherwise repainting indicator with a very reliable trading signal. The donchian breakout period is entered as an input. [ Installation Guide | Update Guide | Troubleshooting | FAQ | A
ZhiBiCCI MT4
Qiuyang Zheng
【ZhiBiCCI】指标适合所有的周期使用,也适合所有的市场品种。 【ZhiBiCCI】绿色实线是逆转看涨背离。绿色虚线是经典的看涨背离。 【ZhiBiCCI】向红色实线是反向看跌背离。红色虚线是古典看跌背离。 【ZhiBiCCI】可以在参数里面设置(Alert、Send mail、Send notification),设置为(true)就可以发送即时信号到警报窗口、电子邮件、即时消息。 参数设置说明: 【displayAlert】:这是警报开关,设置成true,如果出现箭头就会自动警报提示;设置成false,则不会警报提示。 【sendmail_NO_OFF】:这是发送邮件的开关,设置成true,如果出现箭头就会发送邮件到你在MT4设置好的邮箱里面;设置成false,则不会发邮件。 【sendnotification_NO_OFF】:这是发送即时消息的开关,设置成true,如果出现箭头就会发送消息到你的移动设备;设置成false,则不会发消息。 更多好用的指标网址: https://www.mql5.com/en/users/zhengqiuyang/seller
MT4 外汇指标“支撑阻力位” “支撑阻力位”指标是非常有用的交易辅助指标 “支撑”和“阻力”是图表上受价格影响的重要区域 支撑位是价格经常停止下跌并反弹的地方 阻力位是价格通常停止上涨并回落的位置 “支撑阻力位”指标显示最近的水平: 阻力位 - 红线。 支撑位 - 蓝线 用于计算的条数、线型和颜色可以在设置中调整 “支撑阻力位”指标非常适合通过价格行为模式来规划您的止盈目标、价格反转和重新测试。 ............................................................................................................. // 这里提供更多优秀的 EA 交易和指标: https://www.mql5.com/en/users/def1380/seller 它是仅在该 MQL5 网站上提供的原创产品。
Gold Phoenix
Yaroslav Varankin
The perfect tool for Scalng in the Forex markets You can trade both from signal to signal and using take profit  The algorithm does not use Zigzag!  No redrawing!  This is a channel instrument that uses a moving average as a filter. Moving Average  There are 2 parameters for the settings Ma Period = 5 period Moving Average  Channel 1.0 distance of channel lines from the chart Price Signal Filter - calculation of signal opening and filter There is a complete set of Alert There is a multi-timefram
Trendiness Index
Libertas LLC
5 (3)
"The trend is your friend" is one of the best known sayings in investing, because capturing large trendy price movements can be extremely profitable. However, trading with the trend is often easier said than done, because many indicators are based on price reversals not trends. These aren't very effective at identifying trendy periods, or predicting whether trends will continue. We developed the Trendiness Index to help address this problem by indicating the strength and direction of price trend
PZ Support Resistance
PZ TRADING SLU
3.33 (3)
厌倦了绘制支撑线和阻力线? 支撑阻力 是一个多时间指标,可以自动检测并绘制图表中的支撑线和阻力线,并具有非常有趣的变化:随着时间的推移测试价格水平及其重要性的提高,线变得越来越粗。 [ 安装指南 | 更新指南 | 故障排除 | 常见问题 | 所有产品 ] 一夜之间增强您的技术分析 无需浏览图表即可检测重要的价格水平 一目了然地识别所有价格水平的相对优势 每次交易最多可节省半小时的绘图线 指标显示所有价格水平的期限 指示器不重涂 过去和现在的价格水平因接近程度而崩溃,并根据当前的市场行为进行了调整。在动作发生的地方绘制了线条,而不一定在峰值处绘制了线条。 价格水平随着时间的推移而被拒绝,变得越来越暗 定期清除不重要的价格水平以避免噪音 可自定义的时间范围选择和崩溃因子 它实现了电子邮件/声音/推送警报的突破 输入参数 指标设置:指标将从当前时间段读取价格,但您可以选择另一个。例如,您可以在H4图表中显示D1支撑线和阻力线。您还可以使用 价格水平密度 参数选择在图表上显示多少价格水平。 颜色设置:根据重要性输入所需的支撑线和阻力线颜色。 标签设置:(可选)可以在指示器
The indicator displays the data of the Stochastic oscillator from a higher timeframe on the chart. The main and signal lines are displayed in a separate window. The stepped response is not smoothed. The indicator is useful for practicing "manual" forex trading strategies, which use the data from several screens with different timeframes of a single symbol. The indicator uses the settings that are identical to the standard ones, and a drop-down list for selecting the timeframe. Indicator Parame
Noize Absorption Index MT4
Ekaterina Saltykova
5 (1)
Noize Absorption Index - is the manual trading system that measures the difference of pressure between bears forces and bulls forces. Green line - is a noize free index that showing curent situation. Zero value of index shows totally choppy/flat market.Values above zero level shows how powerfull bullish wave is and values below zero measures bearish forces.Up arrow appears on bearish market when it's ready to reverse, dn arrow appears on weak bullish market, as a result of reverse expectation. S
Shark Deal Book
Philip Pankaj Suthagar
4 (3)
Term  "shark"  in the business world denotes a high volume investor who just made a good investment in a highly Potential business deal.So, sharks are the ones who make the market move. In our case, if an American shark bought a Japanese company, he/she has to convert American dollars into Japanese yen to make the deal. So, the demand for the Japanese yen will increase sharply. Thus USD/JPY will go short rapidly if the deal was from the shark. Another example, In the case of forex, if fed increa
Heiken Ashi candle chart is an improved version of The Japanese candle chart, which can effectively filter the market "noise" of the Japanese candle chart. It is favored by many traders for its simplicity and intuition. For trend traders, the HA candle chart is a magic tool. Unlike the traditional Japanese candle chart, Heikenashi does not reflect the opening price, high price, low price and closing price of the market. Instead, Heikenashi calculates the value of a single K line in the dominant
MT4指标介绍: K线级别指示器,帮助交易者 100% 识别交易机会 简介: K线级别指示器是功能强大的技术分析工具,可帮助交易者识别高概率交易机会。通过分析K线的高、低、开盘和收盘价,该指标可以揭示价格行为的支撑和阻力水平,并以清晰的视觉效果呈现出来。 功能: 识别潜在趋势反转: 确定价格行为可能停滞或反转的区域,允许您顺势交易。 利用突破: 预测支撑和阻力位的突破,以便您捕捉突破势头并最大化利润。 优化入场和出场点: 精确确定交易的最佳入场和出场点,提高您的整体交易准确性。 优势: 100% 识别交易机会: 通过识别支撑和阻力位,帮助您发现所有潜在交易机会。 清晰易懂的图表: 将支撑和阻力位直接绘制在图表上,让您一目了然地了解市场结构。 提高交易信心: 为您提供做出明智交易决策所需的信息和信心。 K线级别指示器:通往交易成功的途径 K线级别指示器不仅仅是一个技术分析工具,它还是一个强大的辅助工具,可以将市场数据转化为可操作的见解。通过揭示隐藏的支撑和阻力位,K线级别指示器使交易者能够以精确和自信的方式驾驭市场的复杂性。 立即开始使用 K线级别指示器,释放您的交易潜力! 免责声明:
Trend Line Chart Pattern Signals  Is a traders Tool for Signals based on Strong  Patterns Formed By a pair of robust trend lines. They FOR WITH DIFFERENT POPULAR PATTERNS ON CHARTS LIKE – TRIANGLES, FLAGS,RANGE , ASCENDING TRIANGLES, DESCENDING PATTERNS, PENNANTS ETC. The TREND LINES  form  dynamically  on running bars. The  sensitivity  of the trend lines can be changed by custom settings. The  Buy and Sell Signals Generate upon Break Of the Trend Line + "Close" of the same bar above the previo
基于具有标准参数的MACD指标波 在最后两个MACD波上分别对正面和负面交易斐波纳契水平, 如果负波浪在MACD指标上结束,则颜色为绿色, 如果正波在MACD指标上结束,那么颜色为红色。 Wave的终止标准是两个滴答,MACD的符号不同。 在最近四次MACD波浪中绘制趋势线。 与专家合作很好  Figures MACD   https://www.mql5.com/ru/market/product/42031 更多截图: https://www.mql5.com/ru/charts/10581596/audusd-h1-alpari-international https://www.mql5.com/ru/charts/10631979/usdjpy-m1-alpari-international https://www.mql5.com/ru/charts/10628704/gbpusd-m15-alpari-international
Rira Renko
Vitor Palmeira Abbehusen
RENKO on Time Chart This indicator is an enhanced Renko, so you can watch the Renko bricks on the chart to understand price movement more clearly the other improvement is automated box size according to ATR (Average True Range) period you can set the ATR number as you want and the box size of Renko changes automatically based on price movement Inputs Mode: Box size is the input to specify the size of the Renko box you want to print on the chart. This input lets you choose the fixed b
Stepping Trend
Mpendulo Chiliza
The Stepping Trend Indicator     The Steppi ng Trend indicator uses the  average true range  (ATR indicator) in its calculation. This gives you control to set your own average true range period, I set the Default as 10.   Indicator Details. Green Arrow Up: This means you are at the starting point of a new bullish trend, it’s time to buy.   Red  Arrow  Down : This means you are at the starting point of a new  bearish  trend, it’ s time to sell .   What if you miss the Arrow Signal?   No
Atomic Analyst
Issam Kassas
5 (2)
首先值得强调的是,该交易指标是非重绘、非延迟的指标,这使其成为手动和机器人交易的理想选择。 用户手册:设置、输入和策略。 Atomic Analyst是一种PA价格行动指标,利用价格的力量和动量来寻找市场上更好的机会。配备了高级过滤器,可帮助去除噪音和假信号,并提高交易潜力。使用多层复杂的指标,Atomic Analyst扫描图表,并将复杂的数学计算转化为任何初学者都能理解并用来做出一致交易决策的简单信号和颜色。 “Atomic Analyst”是专为新手和经验丰富的交易者量身定制的综合交易解决方案。它将高级指标和一流功能融合为一体的交易策略,使其成为所有类型交易者的多功能选择。 日内交易和剥头皮策略:专为快速准确的日内交易和短期交易而设计。 日内和摆动交易策略:可用作追求价格大幅波动的日内和摆动交易者的可靠工具。 多货币和市场:凭借其可靠的精度,在不同的工具和市场上运作。 多个时间框架:可在多个时间框架上使用,性能良好。 稳定性:所有指标均不重绘、不重绘和不滞后,确保可靠的信号。 信号清晰度:提供箭头信号,用于清晰的入场和出场点。 实时警报:通过交易入场、SL和TP警报通知交
Trend Scanner
Vladimir Kalendzhyan
4.33 (6)
By purchasing this indicator, you have the right to receive a free copy of one of   my other indicator's or advisor’s!  (All future updates are included. No limits) . To get it , please contact me by  mql5 message ! The Trend Scanner trend line indicator displays the trend direction and its changes. The indicator works on all currency pairs and  timeframes. The indicator simultaneously displays multiple readings on the price chart: the support and resistance lines of the currency pair, the exist
Forex Gump Booster Scalping is a forex signal indicator. Shows on the Metatrader4 chart signals when to open trades to buy and sell. Also sends signals to the phone and email. EA works on all currency pairs and timeframes. The default parameters are set to EURUSD D1. But you can customize to any currency pair. The indicator will help you with this. You select the parameters in the settings, and the indicator displays the predicted profit / loss for the last 1000 bars. If the projected profit sui
该产品的买家也购买
Apollo Pips PLUS SP
Oleg Rodin
5 (2)
请在购买产品之前阅读下面的信息! Apollo Pips PLUS SP 是一款独特的产品!它适合那些想要获得我的新“APOLLO PIPS”指标以及“超级包”奖金以及访问我所有交易指标的人! 通过购买 Apollo Pips PLUS SP 产品,您实际上购买的是全新版本的 Apollo Pips 指标。此版本的指标具有改进的算法和易于使用的参数,使您有机会在任何市场和任何交易风格中使用该指标。 该产品的购买者还可以免费访问我的所有其他指标,作为我的超级奖励!如果您想获得我所有的交易工具,那么该产品非常适合您!:) 但这还不是全部!:) 该产品的所有购买者也有资格免费获得我的新指标!:) 如果我有一个新的交易指标可用,您将能够在我的特权“SUPER PACK”终身奖金计划中完全免费获得它! 购买后请联系我以获得我的交易提示和超级礼包奖金!
Gold Channel XAUUSD
Paulo Rocha
5 (2)
Gold Channel is a volatility-based indicator, developed with a specific timing algorithm for the XAUUSD pair, which consists of finding possible corrections in the market. This indicator shows two outer lines, an inner line (retracement line) and an arrow sign, where the theory of the channel is to help identify overbought and oversold conditions in the market. The market price will generally fall between the boundaries of the channel. If prices touch or move outside the channel it is a tra
TPSpro RFI Levels
Roman Podpora
4.8 (20)
Connect Indicator
Sukunthakan Ngernbamrung
Connect Indicator is a tool used for connecting indicators between the MQL market and MT4. The connected indicators are made by our group and can be used for other applications, such as sending messages to the Line application or Telegram application. If you have any questions, please don't hesitate to ask us to receive support. Function and indicator buffer Buffer one is the high price of the previous candle. Buffer two is the high price of the previous candle. Usage To connect indicators to fu
Enigmera
Ivan Stefanov
5 (2)
ENIGMERA:市场核心 https://www.enigmera.com 简介 该指标和交易系统是金融市场的一种非凡方法。ENIGMERA 利用分形周期精确计算支撑位和阻力位。它能显示真实的累积阶段,并给出方向和目标。 该系统无论在趋势中还是在修正中都能发挥作用。 它是如何运行的? ENIGMERA 由三条线组成:支撑/阻力线、目标线和偏离线。与一般市场指标将过去的数据推断为现在和未来的情况不同,该系统能提供当前的完整情况。如果你处于支撑位,这意味着真正的支撑;如果你处于阻力位,这意味着真正的阻力。如果突破某一水平,则表示趋势发生变化。没有重绘。 由于市场在不断变化,ENIGMERA 不断调整其评估工具,定期修改策略。  这保证了每种情况都能得到全面评估。这一市场指标的独特性显而易见,其能力不言而喻。  ENIGMERA 为金融分析师和咨询师提供服务,他们需要可靠的见解与客户分享,也为投资者提供服务,他们需要最精确和最可靠的保证。 该系统能够达到最佳精度,使交易者能够自信、清晰地评估他们的选择。 ENIGMERA 将 20 年的交易专长和知识整合到一个综合软件
Indicator : RealValueIndicator Description : RealValueIndicator is a powerful tool designed specifically for trading on the EURUSD pair. This indicator analyzes all EUR and USD pairs, calculates their real currency strength values, and displays them as a single realistic value to give you a head start on price. This indicator will tell you moves before they happen if you use it right. RealValueIndicator allows you to get a quick and accurate overview of the EURUSD currency pair tops and bottoms,
Pair Trading Station MT4
Young Ho Seo
3.67 (3)
How to use Pair Trading Station Pair Trading Station is recommended for H1 time frame and you can use it for any currency pairs. To generate buy and sell signal, follow few steps below to apply Pair Trading Station to your MetaTrader terminal. When you load Pair Trading Station on your chart, Pair Trading station will assess available historical data in your MetaTrader platforms for each currency pair. On your chart, the amount of historical data available will be displayed for each currency pai
Gann Price Level
Kirill Borovskii
The indicator is designed to work on any trading platform. The program is based on proprietary algorithms and W.D.Ganna's mathematics, allowing you to calculate target levels of price movement based on three points with the highest degree of certainty. It is a great tool for stock trading. The indicator has three buttons: NEW - call up a triangle for calculation. DEL - delete the selected triangle. DELS - completely remove all constructions. The probability of achieving the goals is more than 80
Introduction to X3 Chart Pattern Scanner X3 Cherart Pattern Scanner is the non-repainting and non-lagging indicator detecting X3 chart patterns including Harmonic pattern, Elliott Wave pattern, X3 patterns, and Japanese Candlestick patterns. Historical patterns match with signal patterns. Hence, you can readily develop the solid trading strategy in your chart. More importantly, this superb pattern scanner can detect the optimal pattern of its kind. In addition, you can switch on and off individu
ECM Elite Channel is a volatility-based indicator, developed with a specific time algorithm, which consists of finding possible corrections in the market. This indicator shows two outer lines, an inner line (retracement line) and an arrow sign, where the channel theory is to help identify overbought and oversold conditions in the market. The market price will generally fall between the boundaries of the channel. If prices touch or move outside the channel, it's a trading opportunity. The
TrendMaestro
Stefano Frisetti
5 (3)
note: this indicator is for METATRADER4, if you want the version for METATRADER5 this is the link:  https://www.mql5.com/it/market/product/108106 TRENDMAESTRO ver 2.4 TRENDMAESTRO recognizes a new TREND in the bud, he never makes mistakes. The certainty of identifying a new TREND is priceless. DESCRIPTION TRENDMAESTRO identifies a new TREND in the bud, this indicator examines the volatility, volumes and momentum to identify the moment in which there is an explosion of one or more of these data a
Gann Greed Don Hall
Kirill Borovskii
This product is based on the methodologies of Gann, his follower Don E. Hall. The Indicator builds a working view grid, which is used to analyze graphics. The Pyrapoint tool, developed by Don Hall, is a grid based on the Pythagorean cube. In his calculations he uses the Gann Square 9 methodology and the relationship between Price and Time. This tool is used to predict changes in trend and overall market actions. More information about the method   HERE
Dragon Multi Indicator MT4
Mansour Babasafary
5 (4)
3 Indicators in 1 indicator Strategy based on price action Made specifically for the best forex currency pairs Can be used in the best time frame of the market at a very reasonable price This indicator is basically 3 different indicatos . But we have combined these 3 indicators in 1 indicator so that you can use 3 indicators at the lowest price. All three strategies are based on price action. But based on different trends. Long term, medium term and short term Attributes : No repaintin
Max Paynex
Abdulkarim Karazon
Max Payne 是一个反转/趋势信号指标,以箭头的形式给出信号,该指标在同一柱收盘时给出信号,该指标可以在图表上以不同周期多次下降,以获得信号的双重/三重确认 该指标具有高度可调性,可以适应任何交易风格,同时它不会重新绘制或背面绘制,购买后您将获得屏幕截图中显示的完整系统以及使用的模板。 ----------------- 如何交易: 等到您在同一柱上获得三次确认,同时趋势过滤器(购买后您将获得的佩恩趋势)与方向一致 开仓并将止损设置为买入交易的黄金箭头(模板)下方和卖出交易的黄金箭头(模板)上方,您的退出信号是第一个相反的白点信号(模板)。 ----------------- 参数 : 信号周期:箭头周期 滤波器:信号滤波器 距离:箭头距蜡烛的距离 计数柱:显示多少历史信号 警报 --------------------------------------
Market Swing Index MSI
Elias Mtwenge
5 (1)
JULY OFFER 80% OFF next price for unlimited version will be 17000$. This is the only time you can get this institutional and professional indicator at this price for unlimited version. Don't dare to miss this. The tool I am about to introduce to you you can't compare it with other tools due to its strategy and accuracy level in predicting the next price directional movement . This tool is designed for serious traders who have decided to make a difference through trading. Be the next person to wi
Swing Master Indicator
Elias Mtwenge
5 (1)
Dear Traders this is my another tool called " Swing Master Indicator ". As the name above the indicator is designed to help you in swing trading by capturing the low and highs of the price. You may us this tool with any trading strategy and style from scalping to position trading. It is made for level of traders including newbies and advanced traders even prop-firms, hedge funds and banks to help them make sold market analysis. I create tools for serious traders who want to make a difference in
The indicator " ZigZag on Trend " is an assistant in determining the direction of price movement, as well as a calculator of bars and points. It consists of a trend indicator, which follows the price direction by the trend line presented in the form of a zigzag and a counter calculating the number of bars traversed in the direction of the trend and the number of points on the vertical scale. (calculations are carried out by the opening of the bar) The indicator does not redraw. For convenience,
ON Trade Optuma Astro
Abdullah Alrai
5 (4)
当然可以!以下是您提供的文本的中文翻译: 引入 MT4 天文指标:您的终极天体交易伙伴 您准备好将交易体验提升到天文高度了吗?不用再寻找,就在我们的革命性 MT4 天文指标中。这个创新工具超越了传统的交易指标,利用复杂的算法提供无与伦比的天文洞察力和精确计算。 指尖上的宇宙信息: 瞻仰一个详尽的面板,展示了一宝藏般的天文数据。了解行星的地理/太阳心坐标,太阳/地球距离,亮度,伸长度,星座,黄道和赤道坐标,甚至是水平坐标——每个细节都经过精心计算并呈现得美轮美奂。指标生成的垂直线对应于时间值,为您的交易旅程提供了宇宙的视角。 行星线条与关系: 在您的图表上欣赏行星线条的魔力,具有可自定义的比例和角度。通过直观的控制面板轻松切换每个行星线条的可见性。通过连结、六分、四分、三分、对冲和逆行等指标,发现行星关系的艺术。在您选择的时间范围内探索这些宇宙构造,使您能够识别重要的交易机会。 揭示甘恩的智慧: 通过受甘恩启发的平方垂直线揭示潜在的反转时机。这种创新修改将甘恩历经考验的原则带入现实,帮助您提前了解市场的转向和趋势。 月亮引导: 在您的图表上优雅地导航月相,因为新月和满月点缀其间。月亮周期
Bomb Bank Signal
Igor Pereira Calil
炸彈銀行訊號:您對 MetaTrader 4 的信心指標 Bomb Bank Signal 是 MetaTrader 4 的一個強大指標,旨在識別金融市場中最相關的趨勢。如果您正在尋找一種能夠準確預測運動的工具,那麼炸彈庫就是您需要的盟友。 運作原理: 該指標結合了三種不同的方法——成交量分析、蠟燭收盤價和對稱趨勢——來偵測和發出買賣機會訊號。當炸彈銀行識別出買入機會時,它就像一顆「炸彈」;當它偵測到賣出訊號時,它就像一個「頭骨」。 為什麼炸彈銀行不一樣? 完全可靠性:炸彈庫訊號不會刪除訊號。訊號一旦發出,就會一直存在,確保您不會錯過任何機會。 極為準確:炸彈庫不會發出錯誤訊號。它會即時更新您的訊息,隨著市場的變化進行調整,但保持先前訊號的透明度。 即時更新:訊號被即時識別並在必要時更新,使您能夠快速響應市場變化。 最大化您的結果: 炸彈銀行訊號是識別趨勢持續走勢的理想選擇。例如,如果您已經做空並且指標在 M15 發出買入訊號,那麼現在就是平倉或部分下單的最佳時機,反之亦然。 此外,經過仔細分析,我們建議您遵循M30、H1和H4上的訊號,停損僅50點。這使
Contact us to receive a comprehensive user guide after purchasing. William Delbert Gann, commonly known as W.D. Gann, was an exceptional market analyst renowned for his unique trading style in the early 20th century.  His trading techniques were based on a blend of mathematics, geometry, astrology, and ancient mathematics. Gann believed that stock market movements followed specific patterns and cycles, rather than being random. His methodologies, celebrated for their accuracy and relevance, con
PTS Precision Index Oscillator V2
PrecisionTradingSystems
5 (1)
精密指数振荡器(Pi-Osc)由Precision Trading Systems的Roger Medcalf开发 版本2经过精心重新编码,以在您的图表上加载速度非常快,还加入了一些其他技术改进,以提高体验。 Pi-Osc旨在提供准确的交易定时信号,旨在找到极端的耗尽点,这些点是市场被迫去触及,以清理每个人的止损单。 该产品解决了一个古老的问题,即知道极端点在哪里,这使得交易员的生活变得更加简单。 这是一个高度复杂的共识指标,与行业标准的振荡器相比,具有一些强大的区别。 它使用的一些特征包括需求指数、资金流动、RSI、随机指标、模式识别、成交量分析、标准偏差极端点以及不同长度上述各种变化的分歧。 乍一看,对于未经培训的人来说,它似乎与任何其他振荡器没有什么不同,但当与其他振荡器(如RSI或动量等)相对比时,这个指标的真正威力开始显现。 据我所知,没有其他振荡器可以频繁地精确指出顶部和底部,具有相同的定期效率。 精密指数振荡器由许多不同的数学方程组成,用于测量多个时间框架采样中的价格和成交量变动,从而高度准确地预测趋势可能发生转折的位置。 PTS P
NOTE: PRICE WILL RISE VERY SOON. DON'T SKIP THIS OFFER! Dear traders I am glad to introduce the " Market Swing Scanner Board" indicator to you. This indicator was made mainly to be used in combination with the Market Swing Index Indicator. You use the  "Market Swing Scanner Board"  indicator to scan for trading opportunities on the  Market Swing Index Indicator . This tool is designed for serious traders who have decided to make a difference through trading. Be the next person to witness this st
This indicator is based on the mathematics of the great trader W.D. Ganna. With its help, you can easily find strong levels by analyzing swings to find the optimal entry point. The indicator works on all instruments and all timeframes. The indicator is fully manual and has control buttons. All you need to do is press the NEW button, a segment will appear, which you can place on any movement, swing or even 1 candle that you want to analyze. By placing the segment, press the OK button. A grid (th
The indicator of a Professional Trader is an arrow indicator for predicting the direction of price movement. I have been working on this indicator since 2014. You can use this indicator as your main indicator, use its entry signals, and use it as your only indicator to find entry points. About the product: Recommended TF [H4-D1-W1]   . The indicator predicts the direction of the next candle. Fits a variety of tools; Flexibility in settings for different instruments and intervals through the
这是最赚钱的指标。它的表现非常出色。无论市场上有什么兴趣,你都能看到。 几乎在所有情况下,它都只会给你一个长期的市场观点,但不要被愚弄,以为它是受事件约束的。不是这样的。它能找到市场上最大的利益所在,并将其展示给你。别忘了,最大的资金(利益)每天都不会在市场上出现。这是您没有遇到过的情况。月租金可能会给您一到两个信号,仅此而已。但当我们谈论大资金时,他们就是这样行事的。 如果您想了解更多,请点击这里。 这是最赚钱的指标。它的表现非常出色。无论市场上有什么兴趣,你都能看到。 几乎在所有情况下,它都只会给你一个长期的市场观点,但不要被愚弄,以为它是受事件约束的。不是这样的。它能找到市场上最大的利益所在,并将其展示给你。别忘了,最大的资金(利益)每天都不会在市场上出现。这是您没有遇到过的情况。月租金可能会给您一到两个信号,仅此而已。但当我们谈论大资金时,他们就是这样行事的。 如果您想了解更多,请点击这里。
The Th3Eng Ninja indicator is based on an analysis of the right trend direction with perfect custom algorithms. It show the true direction and the best point of the trend. With Stop Loss point and Three Take Profit points. Also it provides a secondary entry points in dots arrows style. And Finally it draws a very helpful lines from entry level to TP1, TP2, TP3, SL levels or the reverse signal, and all current/old signals status. How to use the indicator No complicated steps ,   Just follow 2
Please send me Direct message on MQL5 CHAT after purchasing the Indicator for Training and Installation Support There are some additional files that is important to use with the Indicator . So be sure to contact me after purchasing the Indicator So that I can add you for training and support . If you find any difficulty with installation then send me Direct message here So that I can connect with you via Anydesk or Teamview for the product installation. " Smart Order Block Indicator " to find
Max Min Cycle
Vitalyi Belyh
Cyclical indicator for trading and predicting the direction of the market. Shows the cyclical behavior of the price in the form of an oscillator. Gives signals for opening deals when rebounding from the upper and lower boundaries of the oscillator. In the form of a histogram, it shows the smoothed strength of the trend. Will complement any trading strategy, from scalping to intraday. The indicator does not redraw. Suitable for use on all symbols/instruments. Suitable time frames for short-term
Full Forex Market View Dashboard
Opengates Success International
5 (2)
完整的外汇市场视图仪表板指示器 这是一个自定义指标,旨在让交易者全面了解市场上正在发生的事情。 它使用实时数据访问市场并显示成功交易所需的每一点信息。 安装: 在将此指标附加到您的窗口图表之前,请转到您的 MT4 的市场观察面板并隐藏所有您不需要或交易的货币对,并将其余货币对留在那里。 原因是 FFMV 仪表板将显示出现在 MT4 市场观察中的所有货币对。 它最多可以显示 30 个或更少的货币对。 如果它超过您 MT4 的市场观察中的那个,它会模糊和毁坏 FFMV 仪表盘上的字体和图像! 它不会正确显示。 用法:      单人交易      对于篮子交易(见截图如何)      也可用于多单交易      确认从您自己的交易系统等收到的信号的有效性。 成分:      时间范围:从 M1 到 MN1 当前蜡烛状态(买入/卖出      趋势:币种整体走势      影响:货币变动的幅度/波动性,见下文:      建立:货币正在建立      好:货币越来越严重      高:币值值得关注      强:要考虑方向  
SMT Divergences MT4
Diego Arribas Lopez
5 (1)
MT5 Version SMT Divergences MT4 SMT Divergences is one of the most innovative indicators in the market. It offers the possibility of analyzing price divergences between 2 pairs. These divergences highlight and help to foresee what banks and institutions are planning to do. SMT divergences also provides you with a kill zones indicator and the possibility of filtering divergences occurring during these kill zones.  The strategy tester is limited in MT4. Contact the author to get your Demo Version
作者的更多信息
hint: my basic indicators are used like that KingLevel combind with KingSequence will provides basic insights of the price action of the markets and KingSequenceSgn is just for the convienent for watching. And plus with Forex Trading mentor subsccription I will assist you to win the market at first later if it's great will be upgraded to King Forex trading mentor. It just the main chart sign of the "KingSequence" indicator. Here is the detals from the "KingSequence" indicator Slide 1: Ti
MT4指标介绍: K线级别指示器,帮助交易者 100% 识别交易机会 简介: K线级别指示器是功能强大的技术分析工具,可帮助交易者识别高概率交易机会。通过分析K线的高、低、开盘和收盘价,该指标可以揭示价格行为的支撑和阻力水平,并以清晰的视觉效果呈现出来。 功能: 识别潜在趋势反转: 确定价格行为可能停滞或反转的区域,允许您顺势交易。 利用突破: 预测支撑和阻力位的突破,以便您捕捉突破势头并最大化利润。 优化入场和出场点: 精确确定交易的最佳入场和出场点,提高您的整体交易准确性。 优势: 100% 识别交易机会: 通过识别支撑和阻力位,帮助您发现所有潜在交易机会。 清晰易懂的图表: 将支撑和阻力位直接绘制在图表上,让您一目了然地了解市场结构。 提高交易信心: 为您提供做出明智交易决策所需的信息和信心。 K线级别指示器:通往交易成功的途径 K线级别指示器不仅仅是一个技术分析工具,它还是一个强大的辅助工具,可以将市场数据转化为可操作的见解。通过揭示隐藏的支撑和阻力位,K线级别指示器使交易者能够以精确和自信的方式驾驭市场的复杂性。 立即开始使用 K线级别指示器,释放您的交易潜力! 免责声明:
hint: my basic indicators are used like that KingLevel combind with KingSequence will provides basic insights of the price action of the markets and KingSequenceSgn is just for the convienent for watching. And plus with Forex Trading mentor subsccription I will assist you to win the market at first later if it's great will be upgraded to King Forex trading mentor. Forex trading Guide by a 10-year Forex Trading Expert - Junior:forex[usdjpy,eruusd etc], crypto[btc,eth], gold [*You can check
The Zigzag Indicator is a powerful tool, developed to assist traders in identifying market trends by highlighting significant highs and lows of a trade. It is designed with the flexibility to adjust to fluctuating market conditions and to filter the minor price fluctuations in the market to focus on substantial ones. The Zigzag Indicator adheres only to movements that meet a specific percentage or a defined number of points, allowing it to weed out minor price movements and focus solely on
Introducing our state-of-the-art Wave Indicator, meticulously designed for the discerning traders of the MQL5 community! At the core of this innovative tool lies an unmatched sensitivity to capture even the slightest market movements. Our Wave Indicator serves as the foundational element for constructing comprehensive trading strategies, providing you with an unwavering edge in the dynamic world of finance. Whether you're aiming to refine short-term tactics or develop long-term systems, this ind
筛选:
无评论
回复评论
版本 2.12 2024.05.14
fixing array out of range
版本 2.11 2024.05.14
fix error array out of range
版本 2.10 2024.05.14
array out of range
版本 2.0 2024.05.10
version reverse
版本 1.50 2024.05.10
dmk main chart sign