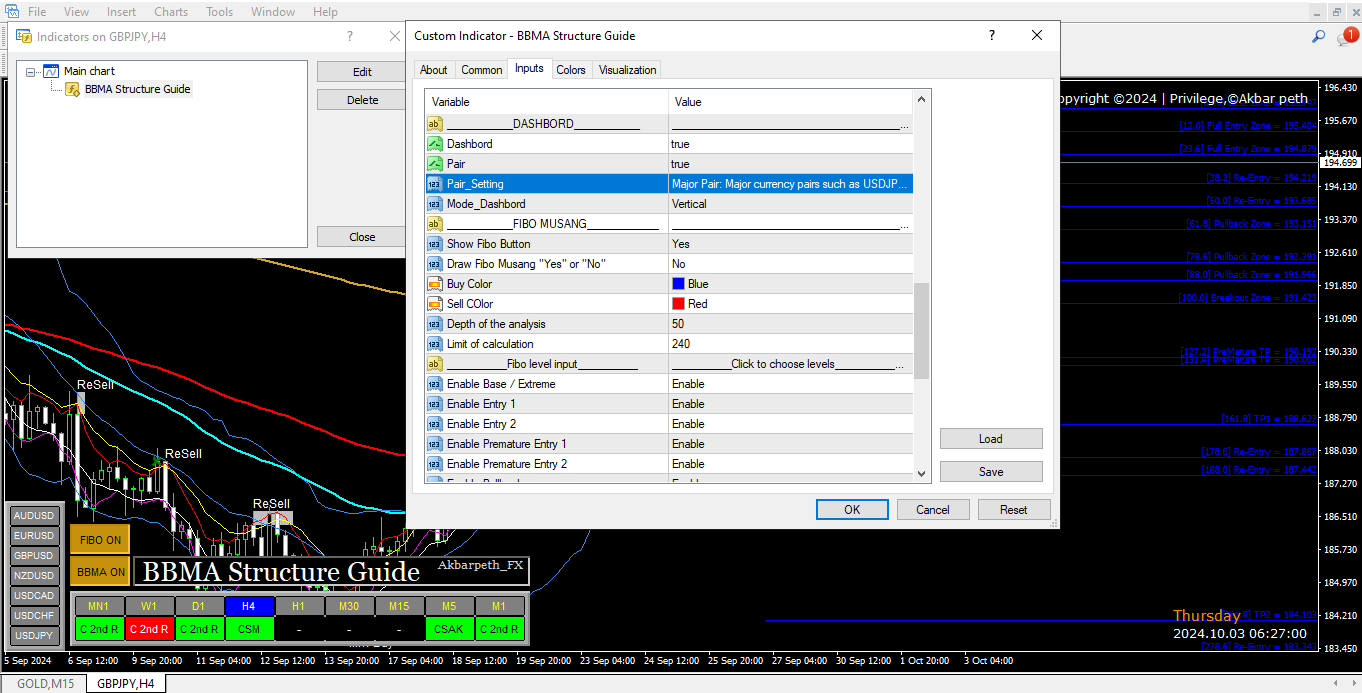
版本 1.29
2024.10.03
Update Description for BBMA Structure Guide Indicator
The latest update to the BBMA Structure Guide indicator introduces significant enhancements designed to improve user control and market analysis:
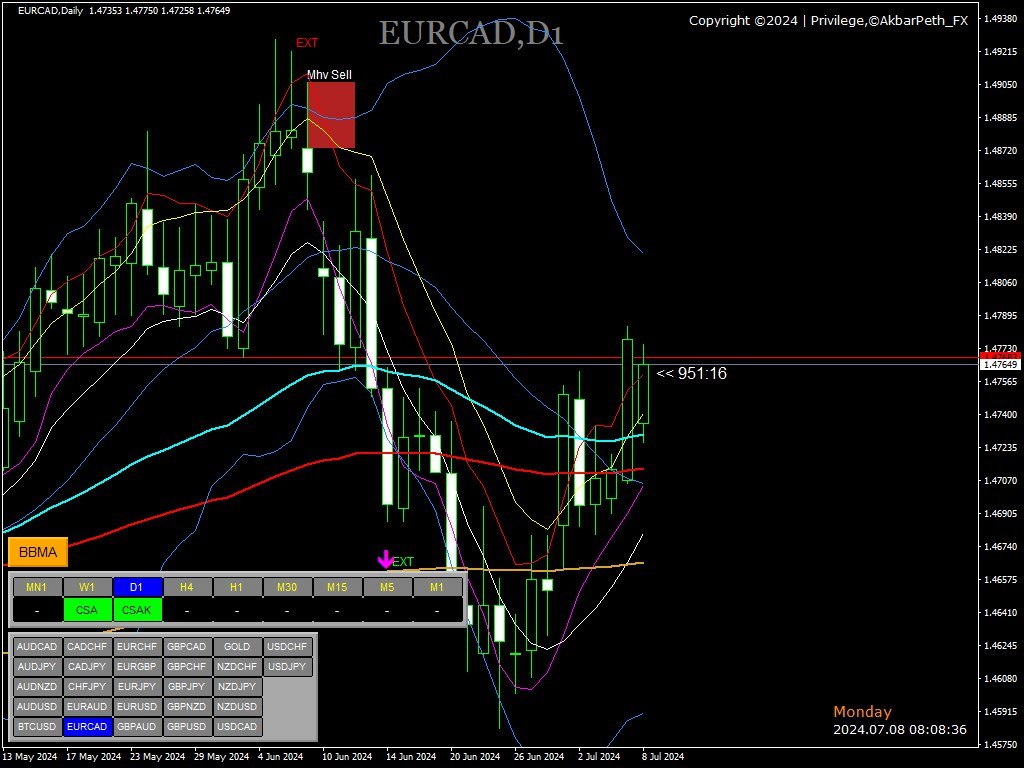
1. Pair Control Management: A new feature has been added to control and manage currency pair buttons directly from the interface, providing quick access and switching between different pairs, improving efficiency in monitoring multiple assets.
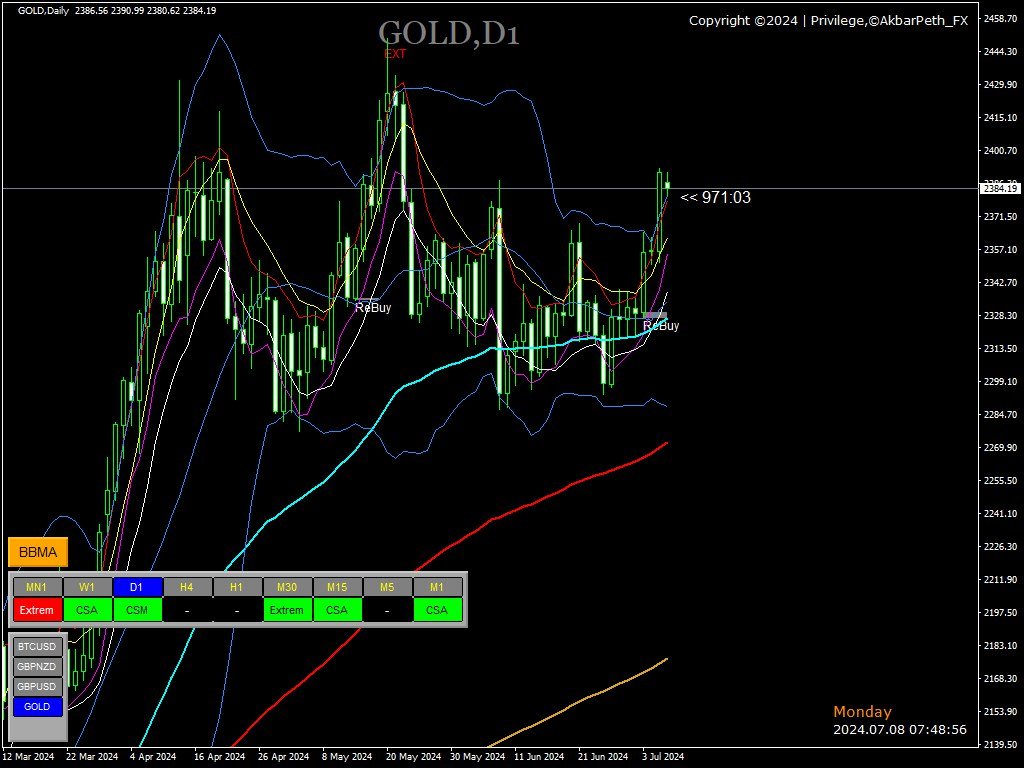
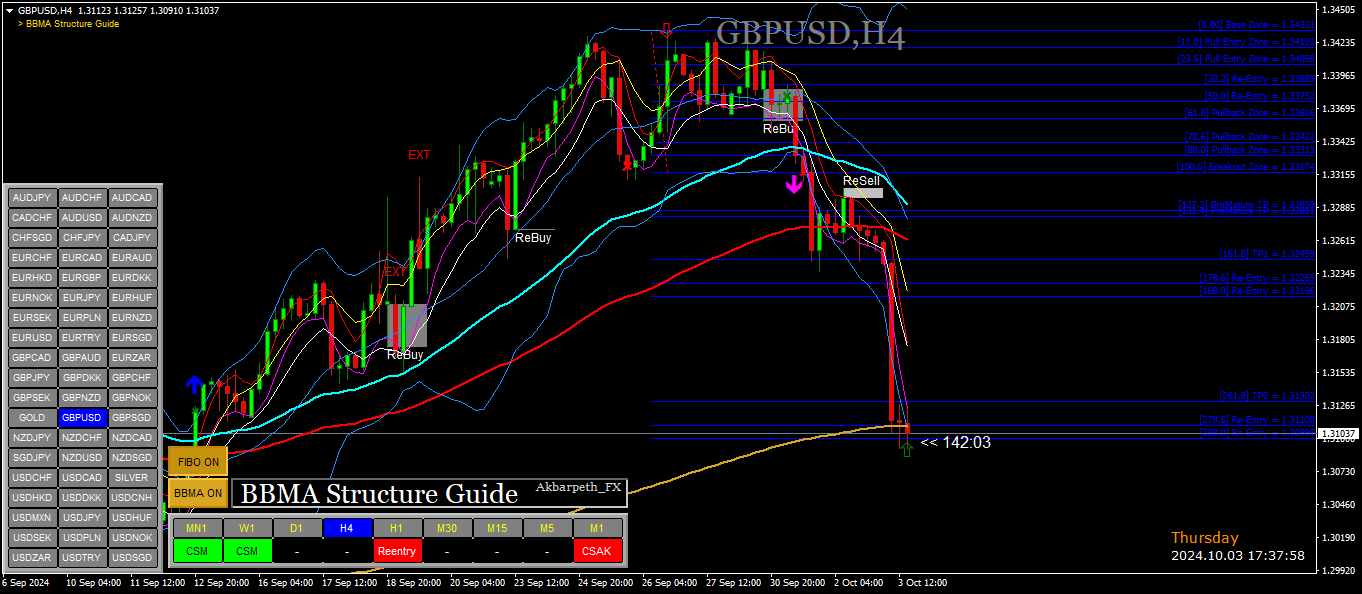
2. New Dashboard Status - "C 2nd R": The dashboard now includes a status called "C 2nd R," which identifies the second candle following the reentry setup. This feature provides an additional layer of insight into the price action after a reentry condition, helping traders better time their entries.
3. Fibo Musang Integration: The integration of Fibo Musang helps traders define potential Take Profit (TP) and entry points by applying advanced Fibonacci levels. This tool enhances decision-making around key price levels for both buy and sell scenarios.
This update is aimed at providing more flexibility and refined market analysis tools, empowering traders to make better-informed decisions.
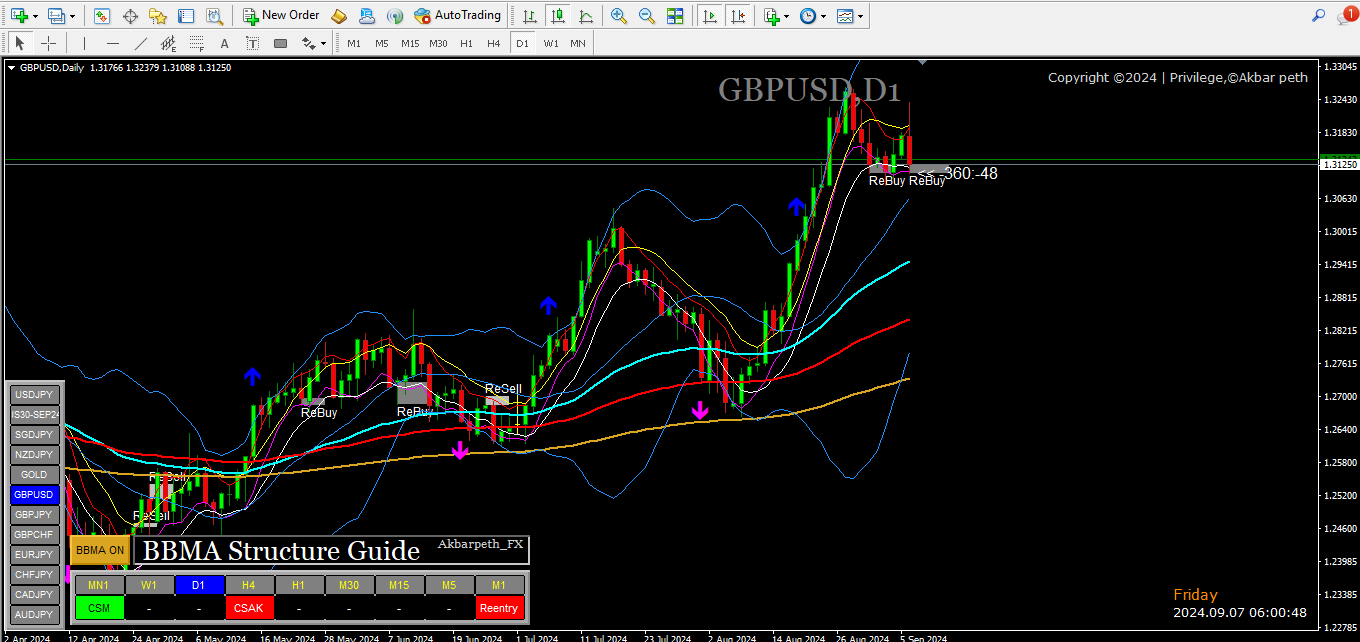
版本 1.28
2024.09.07
改进了更具吸引力和更舒适的仪表盘。新增了带有属性的主题,使用户可以根据个人喜好轻松选择。
版本 1.27
2024.07.08
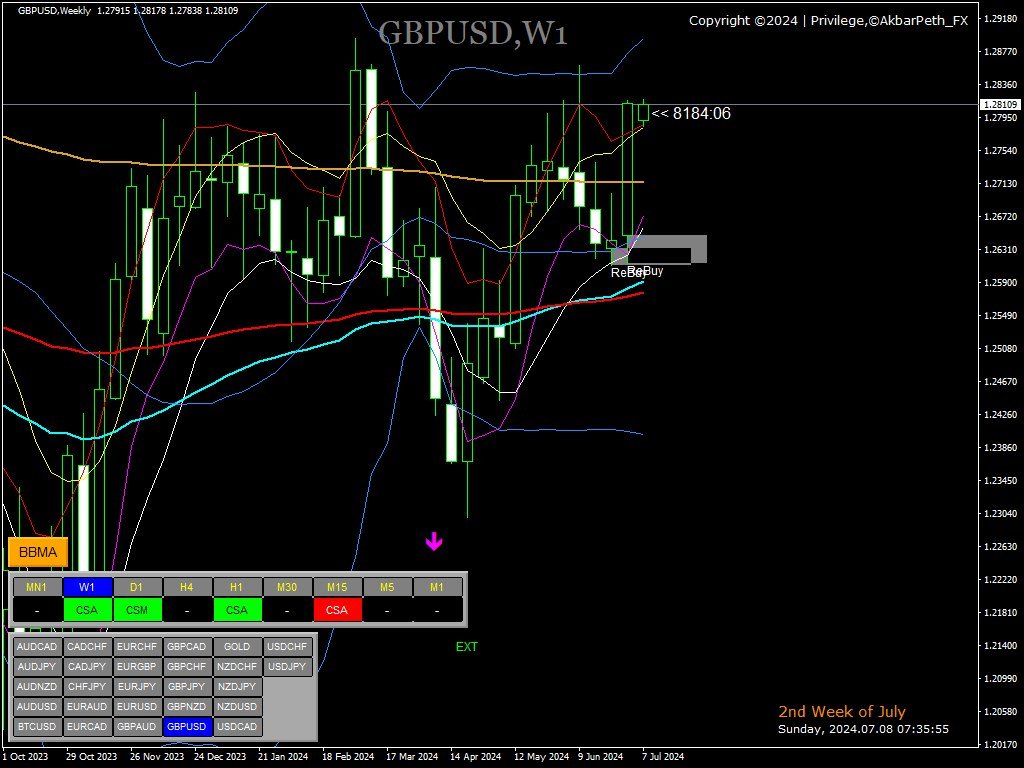
Indicator Update - Latest Version
We are pleased to announce the latest update to our indicator, featuring a more interactive dashboard:
Enhanced Interface:
More intuitive and user-friendly dashboard design.
Clearer data visualization with engaging graphics and colors.
Improved Interaction:
Added interactive buttons for quick access to key features.
Faster response to user commands.
Benefits:
Enhanced User Experience: Cleaner and more interactive interface.
Improved Efficiency: Quick access to critical information.
Clear Data Visualization: Facilitates better data understanding.
This update aims to enhance user experience and effectiveness in market analysis.
版本 1.26
2024.07.08
Indicator Update - Latest Version
Update Description:
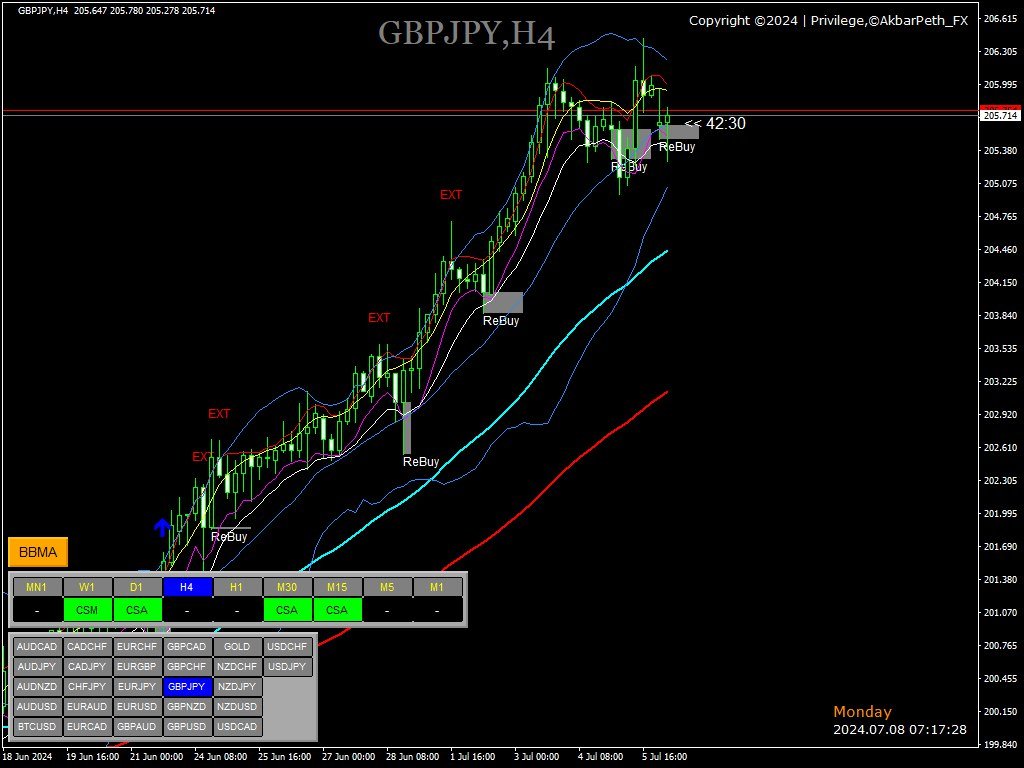
In the latest version of this indicator, we have made significant updates to improve the accuracy of the MHV and reentry signal calculations. Below are the details of the changes made:
Enhanced Reentry Calculation:
The reentry calculation algorithm has been optimized to detect reentry opportunities more accurately.
New logic has been added to consider conditions such as candle direction and price position relative to key technical indicators ( Moving Average and Bollinger Bands).
Improved accuracy in identifying reentry signals based on multi-timeframe analysis, allowing for better entry point identification.
Improved MHV Accuracy:
The MHV logic has been refined to provide more reliable signals.
New criteria have been added for MHV signal validation to ensure more consistent signals and reduce false positives.
Adjustment of indicator parameters to align with current market conditions, ensuring signal relevance.
Benefits of the Update:
Higher Accuracy: With the improved and optimized reentry and MHV calculations, users can rely on the indicator signals for more precise trading decisions.
Consistent Signals: The use of additional criteria and signal validation helps in reducing signal errors, thereby enhancing consistency in market analysis.
User-Friendly: More intuitive colors and labels make it easier for users to recognize and understand the signals provided by the indicator.
版本 1.25
2024.06.10
Update version 1.25 - with added alerts
版本 1.24
2024.06.03
Bug Fixes:
- Fixed an issue where the dashboard would not load correctly.
- Resolved a bug causing incorrect data display in the dashboard.
- Addressed a problem where the dashboard filters were not functioning.
- Corrected a bug that caused the dashboard to crash under certain conditions.
版本 1.23
2024.06.01
What's New?
Bug Fixes in Dashboard:
Resolved various bugs to ensure a smoother user experience.
Fixed issues causing data display errors and lag in the dashboard.
Enhanced stability to prevent crashes during intensive operations.
Enhanced Usability:
Redesigned user interface for more intuitive navigation.
Simplified settings and options for easier configuration.
Added tooltips and help sections for better guidance.
Performance Optimization:
Streamlined code to reduce resource usage and improve response times.
Implemented efficient algorithms to handle larger datasets with ease.
Minimized load times for faster access and interaction.
New Features:
Introduced customizable alerts and notifications.
Added support for more data sources and formats.
Enhanced visualization options with new chart types and styles.
These updates aim to make the indicator more user-friendly, lightweight, and efficient, providing a seamless experience for all users.
版本 1.22
2024.05.22
error fix update in the dashboard
版本 1.21
2024.05.19
更新内容
此次更新使指标更加轻量化,确保更快、更流畅的性能。此外,我们引入了一个综合仪表盘,可以同时监控所有时间框架,提供更高效和用户友好的体验。
版本 1.2
2024.05.12
What's new? : This is the latest version of the indicator, featuring updated calculations for reentry setups and extreme signals.