• 概述
  • 评论
  • 评论
  • 新特性

Smart Volume Tracker

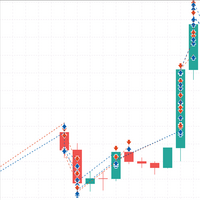
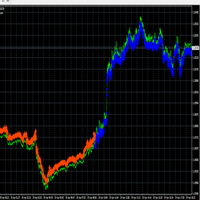
The Smart Volume Tracker is a indicator designed to provide insights into market sentiment by visually presenting bid and ask volume data in a dedicated window. This intuitive tool helps traders quickly identify where buying and selling activity is concentrated, allowing them to make more informed trading decisions.

With Smart Volume Tracker, you can easily gauge whether the market is leaning toward a bullish or bearish trend. It shows clusters of bid and ask volumes, using green to represent buying activity and red for selling activity. This color-coded visualization makes it simple to determine the current mood of the market, helping you spot trends and potential turning points.

By observing the clustering patterns, you can identify key support and resistance levels, which are critical for effective trading. The separate indicator window keeps your main chart clear, allowing you to focus on your trading strategy while still gaining valuable insights into market dynamics.

Smart Volume Tracker is ideal for traders who want a straightforward way to track volume activity without overwhelming their main chart with additional data. Its adjustable settings let you customize the indicator to suit your preferences, ensuring that the information is presented clearly and effectively.

In summary, Smart Volume Tracker is a powerful yet easy-to-use tool that can enhance your trading by providing a clear view of market activity and sentiment. Use it to find opportunities, understand market trends, and make better trading decisions.


  • Bid Clusters: These represent the demand side of the market, indicating where buying activity is concentrated. A higher volume of bids typically suggests an upward market trend or bullish sentiment.
  • Ask Clusters: These represent the supply side of the market, indicating where selling activity is concentrated. A higher volume of asks often indicates a downward trend or bearish sentiment.

Here's how the calculation works in your code:

  1. Tick Volume as a Proxy for Bid/Ask:

    • The code assumes that tick volume represents both bid and ask activity. It's important to note that tick volume doesn't specifically separate bids and asks; it simply represents the total number of price changes within a given timeframe.
  2. Buffer Initialization:

    • The indicator initializes buffers (Bid Clusters and Ask Clusters) to store bid and ask volume data. The buffers are resized to match the number of candles (bars) in the chart.
  3. Cluster Calculation 

    •  The indicator calculates the bid and ask clusters for each candle.
    • The code assigns the tick volume to both Bid Clusters and Ask Clusters, effectively treating tick volume as the representation of both buying and selling activity.
  4. Displaying Clusters:

    • The visualize of the bid and ask clusters. 
    • The function loops through the bars and displays the bid and ask volumes as text-based clusters, with color-coding (green for bids and red for asks). The positioning of these clusters depends on whether the candle is bullish or bearish.






推荐产品
Over Trend MT4
Mansour Babasafary
Trend based indicator Identify trends with this indicator A simple-to-use trend indicator No complicated settings Attributes: Can be used in all symbols Can be used in all time frames Relatively high signals No complicated settings Specific to the trend Lifetime support Settings: Alarm Show Alert: By activating these settings, after receiving the signal, you will receive an alarm in Metatrader Alarm Show Notification: By activating these settings, after receiving the signal, you will rec
CheckList MT4
Kambiz Shahriarynasab
4 (2)
One of the basic needs of every trader is to have a checklist to enter every position. Of course, using pen and paper may not be convenient forever. With this indicator, you can have a small checklist next to the screen for each of your charts and use it for better use in your trades. MT5 Version This indicator will have many updates and special settings will be added to it. You can contact us via Instagram, Telegram, WhatsApp, email or here. We are ready to answer you.
The  Laguerre VIX Trend Extrema   (LVTE)  indicator detects market tops and bottoms. As its name suggests, LVTE is a percentage price oscillator that identifies extreme ranges in market price. How to use:   Buy   when the indicator was in the lower "blue" range for more than 2 candles, and then moves up into grey.   Sell   when the indicator was in the upper "red" range, and then moves down into orange. Please see screenshots for examples! To make it simple, the indicator can show this by paint
The indicator is the advanced form of the MetaTrader 4 standard Fibonacci tool. It is unique and very reasonable for serious Fibonacci traders. Key Features Drawing of Fibonacci retracement and expansion levels in a few seconds by using hotkeys. Auto adjusting of retracement levels once the market makes new highs/lows. Ability to edit/remove any retracement & expansion levels on chart. Auto snap to exact high and low of bars while plotting on chart. Getting very clear charts even though man
Fx Perfect Signal indicator is designed for signal trading. This indicator generates trend signals.  It uses many algorithms and indicators to generate this signal. It tries to generate a signal from the points with the highest trend potential. This indicator is a complete trading product. This indicator does not need any additional indicators.  The indicator certainly does not repaint. The point at which the signal is given does not change.  Thanks to the alert features you can get the signals
Gunn Crosses
Iurii Tokman
Gunn Crosses   支撑和阻力水平指标。 水平是根据江恩平方的对角线和基数交叉计算的。 计算是相对于当前价格或相对于用户在价格设置中指定的价格执行的。 此外,在计算中,您可以使用 Digit 和 minus_znak 设置来使用定价的一部分。 例如:当前价格看起来像 - 1.23456,并且 Digit 设置设置为 _5____,因此计算将包括 参与号23456, 对于 _6____ 将是数字 123456 对于 __4____,数字将为 3456 ___3___ 的数字将是 456 ____2__ 的数字将为 56 minus_znak 设置删除定价右侧的数字 例如:   Digit 设置为 _5____ 并且 minus_znak 设置为 _0 定价的形式为 23456 在 _1 将是 2345 在 _2 将是 234 可以通过适当的设置打开或关闭基数或对角十字的显示。 还可以根据自己的喜好自定义线条和标签的显示颜色。
Introducing our revolutionary intra-day trading indicator, meticulously crafted to optimize your trading insights within the 24-hour market cycle. Immerse yourself in historical data with precision using two distinctive modes - "All History" and "Last X Hours." Key Features: All History Mode Uncover a comprehensive view of the day's dynamics. Instantly analyze the preceding day's high and low, 50% mid-point, and the open versus close price for the current day. Decode critical patterns to infor
Weis Wave Indicator
Dhabaleswar Prasad Jena
This indicator is based on the Weis wave principle of wave volume. Below are few features of the indicator It draws the wave on the chart while the accumulated volume per wave in a different window at the bottom of the chart You can configure the turning point move It displays the accumulated volume (in thousands, eg for 15000 volume it will show 15) at the end of each wave You can also configure to show number of candles in the wave along with the wave volume The indicator calculates the distin
SuperTrend Alerts
Libertas LLC
3 (4)
SuperTrend Alerts adds alerts to the widely popular SuperTrend indicator. As the name suggests, SuperTrend is a trending indicator which works best in trendy (not choppy) markets. SuperTrend is extremely popular for intraday and daily trading, and can be used on any timeframe. Place a call when the price closes above the SuperTrend line, and place a put when the price closes below the SuperTrend line. These crossovers are highlighted by non-repainting up/down arrows. Alerts Email, message and
Judge
Tatiana Savkevych
The Judge indicator shows potential market reversal points. The indicator shows favorable moments for entering the market. The indicator's smart algorithm detects the trend, filters out market noise and generates input signals. The indicator can be used as the main one for determining the trend. The indicator can work both for entry points and as a filter. Uses two parameters for settings. The indicator uses color signaling: blue - when changing from descending to ascending, and red - on the con
Trend Second Derivative RSI is a forex indicator based on the usual RSI, based on the second derivative of the price function. On the chart itself, trend signals will be displayed by arrows, they are filtered by the algorithm and always alternate buy / sell. It also shows the number of profitable pips that the indicator can give at the specified interval (LimitCalcHistory). The indicator has a parameter (Spread), which deducts a part of the profit per spread for each signal. Immediately notic
Scanner and Dashboard for Money Flow Index for MT4 The Money Flow Index (MFI) is a technical oscillator that uses price and volume data for identifying overbought or oversold signals in an asset. It can also be used to spot divergences which warn of a trend change in price. The oscillator moves between 0 and 100. Advantages of the Scanner: - Full Alert Options. - Multi Timefrare  - Works for all instruments including Currencies, Indices, Commodities, Cryptocurrencies and Stocks. - Fully customis
Индикатор iVeles_Channel_Extremum_II_MTF вычисляет точки слома направлений движения цены на установленном в параметрах ТФ, на основе этих точек и выбранного их количества строится основной канал цены, который можно использовать в качестве уровней поддержки и сопротивления для меньшего ТФ, на котором установлен индикатор. В зависимости от направления движения основного тренда рассчитывается средняя линия канала по уровню Фибоначи, от которой, как правило, идет отскок в сторону тренда. Также по ур
Signal Undefeated   indicator is designed for trend and signal trading. This indicator generates trend signals.  It uses many algorithms and indicators to generate this signal. It tries to generate a signal from the points with the highest trend potential. This indicator is a complete trading product. This indicator does not need any additional indicators.  You can only trade with this indicator. The generated signals are displayed on the graphical screen.  Thanks to the alert features you can g
This indicator works on MT4 and is very easy to use. When you receive a signal from it, you wait for that candle with the signal to close and you enter your trade at the beginning of the next new candle . A red arrow means sell and a green arrow means buy. All arrows comes with Alert  like for easy identification of trade signal. Are you okay with that? 1 minute candle 1 minute expire
Big Trend Signal   indicator is designed for trend and signal trading. This indicator generates trend signals.  It uses many algorithms and indicators to generate this signal. It tries to generate a signal from the points with the highest trend potential. This indicator is a complete trading product. This indicator does not need any additional indicators.  You can only trade with this indicator. The generated signals are displayed on the graphical screen.  Thanks to the alert features you can ge
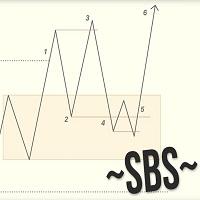
Swing Breakout Sequence | SBS presents a comprehensive trading strategy designed to help traders identify and capitalize on market swings and breakouts. The Swing Breakout Sequence (SBS) strategy is built around a series of well-defined steps to optimize trading decisions and improve profitability. Version 2.01: Add "golden entry" - entry by fib. Stoic added to it (fibo) he calls this setup gold SBS here is the   video the description of the setup starts at 18min24sec Version 2: + Add BOS filter
Trend Tracking System is an indicator that generates trade arrows. It generates trade arrows with its own algorithm. These arrows give buying and selling signals. The indicator certainly does not repaint. The point at which the signal is given does not change. You can use it in all graphics. You can use it in all pairs. This indicator shows the input and output signals as arrows and alert. When sl_tp is set to true, the indicator will send you the close long and close short warnings. It tells yo
Alpha Trend sign Alpha Trend sign 是我么长期以来非常受欢迎的交易工具,它可以验证我们的交易系统,并且明确的提示交易信号,并且信号不会漂移。 主要功能: •  根据市场显示活跃区域,根据指标可以很直观的判断当前行情是属于趋势行情,还是震荡行情。    并根据指标的指示箭头切入市场,绿色箭头提示买入,红色箭头提示卖出。 •  建议使用5分钟以上的时间周期进行交易,避免因为小周期波动出现频繁的交易信号。 •  您也可以开启信号提示,以免错过最佳的交易时机。 •  本指标不但可以很好的预测趋势行情,也可以在宽幅震荡行情中获利。 •  本指标本着大道至简的原则,适合不同阶段的交易者使用。 注意事项: •  Alpha Trend sign 有明确的进出场信号,不建议逆势操作,以免造成损失。 •  Alpha Trend sign 是特别成熟的指标,我们团队人手一个,使用它可以实现稳定盈利。     
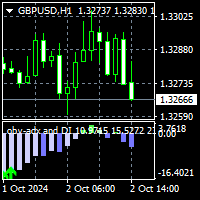
To get access to MT5 version please click  here . This is the exact conversion from TradingView: "OBV ADX and DI" by " kocurekc ". This is a light-load processing and non-repaint indicator. All input options are available.  Buffers are available for processing in EAs. You can message in private chat for further changes you need. I removed the background coloring option to best fit into MT platform graphics.
Trend Scanner looks at the Market watchlist and Checks to see if there are trending cases between three (3) timeframes selected by the user. The analysis can assist in finding pairs to focus on for a particular session where a trader may need to have a bias in terms of direction to place trades for a particular system which requires multiple timeframe filtration of bar momentum. 3 Main indicators are involved: Moving Average, MACD and Heiken Ashi. User is able to select timeframes available on
PriceChannel
Ahmet Metin Yilmaz
PriceChannel is designed for trend detection without the effect of accidental price leaps. It uses Price Series and a few moving averages for noise reduction. It works on multiple timeframes, even M1. To increase effectiveness, it is recommended to use 3 instances of PriceChannel with different parameters on one chart (see screenshots). You can use the following settings (for M1 charts): PriceChannel(10,2,30) Gold colour. PriceChannel(10,5,30) Blue colour. PriceChannel(21,8,13) Gray colour. Exa
The indicator scans for stop grabber (special pattern of Joe Dinapoli which gives very high probability buy / sell signals and does not repaint ) signals in multiple timeframes for the all markets filtered and shows the results on Dashboard. Key Features Dashboard can be used for all markets It can scan for stop grabber pattern on MN1, W1, D1, H4, H1, M30, M15 ,M5, M1 timeframes Parameters UseMarketWatch: Set true to copy all symbols available in market watch MarketWatchCount : Set the numbe
简单多空柱 一个很简洁明了的指标,非常容易看懂,但是他对于追踪趋势非常的有用。 本指标的用法很简单: 多头信号:如果价格出现了多头行情的征兆,那么就会出现黄色的箱体。 空头信号:如果价格出现了空头行情的征兆,那么就会出现蓝色的箱体。 多头力度:如果箱体的大小很大,代表着多头力度很强,反之力度较弱。 空头力度:如果箱体的大小很小,代表着空头力度很强,反之力度较弱。 多头转空头:当黄色的箱体不断变短的时候,意味着多头有可能会转成空头。 空头转多头:当蓝色的箱体不断变短的时候,意味着空头有可能会转成多头。 注意: 本指标优点:使用简单,容易上手,在趋势行情下会有非常良好的表现。 本指标缺点:如果处于极度震荡的区间,那么可参考性也会变小,因为本指标是典型的趋势性质的指标。
True Magic Oscillator
Muhammed Emin Ugur
The   True Magic Oscillator   indicator is designed for signal trading. This indicator generates trend signals. It uses many algorithms and indicators to generate this signal. It tries to generate signals from the points with the highest trend potential. This indicator is a complete trading product. This indicator does not need any additional indicators. The indicator is never repainted. The point at which the signal is given does not change.         Features and Recommendations Wor
The Sensitive Volume indicator is an indicator designed to generate trading signals. The purpose of this indicator is to generate signals from the highest probability of trading. Using a number of price movements and a set of indicator properties to generate these signals.  Easy to use, simple and understandable to the user. With alert features, user signals can be reached quickly.  Visually the user can easily recognize the signals. This indicator will not repaint. Parameters Trend_Period - p
Nice Stable Arrow
Muhammed Emin Ugur
Nice Stable Arrow   indicator is designed for signal trading. This indicator generates trend signals. It uses many algorithms and indicators to generate this signal. It tries to generate a signal from the points with the highest trend potential. This indicator is a complete trading product. This indicator does not need any additional indicators. The indicator certainly does not repaint. The point at which the signal is given does not change. Signals are sent at the beginning of new candle
Std Channels
Muhammed Emin Ugur
Std Channels The Std Channels Indicator is a technical indicator that uses standard deviation to create five channels around a price chart. The channels are used to identify support and resistance levels, as well as trends and reversals. The indicator is calculated by first calculating the standard deviation of the price data over a specified period of time. The channels are then created by adding and subtracting the standard deviation from the price data. The five channels are as follows: Upper
The indicator determines the state of the market: trend or flat. The state of the market is determined by taking into account volatility. The flat (trading corridor)is displayed in yellow. The green color shows the upward trend. The red color shows the downward trend. The height of the label corresponds to the volatility in the market. The indicator does not redraw . Settings History_Size   - the amount of history for calculation. Period_Candles  - the number of candles to calculate the
Supply and Demand Dashboard PRO
Bernhard Schweigert
4.8 (20)
目前八折优惠! 这个仪表板是一个非常强大的软件,可用于多个符号和多达9个时间段。 它是基于我们的主要指标(最佳评论:高级供应需求)。 Advanced Supply Demand 该仪表板提供了一个伟大的概述。它显示。   筛选后的供需值,包括区域强度评级。 区间内和区间外的点位距离。 它突出了嵌套的区域。 在所有(9个)时间段内,它对所选符号发出4种警报。 它是高度可配置的,以满足您的个人需求! 您的利益! 对每个交易者来说,最重要的问题是。 什么是入市的最佳水平? 在强大的供应/需求区域内或附近进入你的交易,以获得最佳的成功机会和风险/回报。 我的止损的最佳位置是哪里? 把你的止损放在强势供应/需求区的下方/上方是最安全的。 我的最佳盈利目标是什么? 你的退出策略和你的进入策略一样重要,了解更高的时间框架图可以帮助你。对于买入,使用下一个供应区作为目标,对于卖出,使用下一个需求区作为目标。在回撤到供应区或需求区时进场,以确保有足够的利润空间,达到更高的时间框架的供应和需求,将增加你的利润。 为什么我们要过滤强区和
该产品的买家也购买
Gann Made Easy
Oleg Rodin
4.8 (96)
Gann Made Easy 是一个专业且易于使用的外汇交易系统,它基于使用先生理论的最佳交易原则。 W.D.江恩。该指标提供准确的买入和卖出信号,包括止损和获利水平。您甚至可以使用推送通知在旅途中进行交易。 购买后请联系我!我将免费与您分享我的交易技巧和丰厚的红利指标! 您可能已经多次听说过江恩交易方法。通常 Gann 的理论不仅对于新手交易者而且对于那些已经有一定交易经验的人来说都是非常复杂的东西。这是因为江恩的交易方法在理论上并不那么容易应用。我花了几年时间来完善这些知识,并将最好的原则应用到我的外汇指标中。 该指标非常易于应用。您所需要的只是将其附加到您的图表并遵循简单的交易建议。该指标不断进行市场分析工作并寻找交易机会。当它检测到一个好的入口点时,它会为您提供一个箭头信号。该指标还显示止损和获利水平。 换句话说,当您像先生一样进行交易时,该指标会为您提供最佳江恩建议。江恩亲自告诉你此时此刻该做什么。但最好的部分是您不需要了解任何有关江恩交易原则的知识,因为该指标会为您完成整个市场分析工作。
Easy Breakout
Mohamed Hassan
5 (3)
Enjoy a 50% OFF Christmas holiday sale! Offer ends 27 December 2025 . After your purchase, feel free to contact me for more details on how to receive a bonus indicator called VFI, which pairs perfectly with Easy Breakout for enhanced confluence!   Easy Breakout is a powerful price action trading system built on one of the most popular and widely trusted strategies among traders: the Breakout strategy ! This indicator delivers crystal-clear Buy and Sell signals based on breakouts from key s
Golden Trend Indicator
Noha Mohamed Fathy Younes Badr
5 (8)
Golden Trend indicator  is The best indicator for predicting trend movement this indicator never lags and never repaints and never back paints    and give  arrow buy and sell    before the candle appear  and it will help you and  will make your trading decisions clearer its work on all currencies and  gold and crypto and all time frame This unique  indicator uses very secret algorithms to catch the  trends, so you can trade using this indicator and see the trend clear on charts  manual guide and
- Real price is 80$ - 40% Discount ( It is 49$ now ) Contact me for instruction, add group and any questions! Related Products:  Bitcoin Expert , Gold Expert Introduction The breakout and retest strategy is traded support and resistance levels. it involves price breaking through a previous level.  The break and retest strategy is designed to help traders do two main things, the first is to avoid false breakouts. Many false breakouts start with a candlestick that breaks out of a level but ends w
目前八折优惠! 对任何新手或专家交易者来说都是最好的解决方案! 这个仪表板软件适用于28种货币对。它基于我们的两个主要指标(高级货币强度28和高级货币冲动)。它对整个外汇市场提供了一个伟大的概述。它显示高级货币强度值,货币运动速度和28个外汇对在所有(9)时间段的信号。想象一下,当你可以使用图表上的单一指标观察整个市场,以确定趋势和或剥头皮的机会时,你的交易将得到改善 我们已经在这个指标中建立了一些功能,使你更容易识别强势和弱势货币,同时识别和确认潜在的交易。该指标以图形方式显示货币的强势或弱势是增加还是减少,以及它在所有时间段的表现。 增加的新功能是动态市场斐波那契水平,它适应当前的市场条件变化,这是一个已经在我们的高级货币强度28和高级货币冲动指标中使用的成熟的加分项。 在交易时,总是将弱势货币和强势货币配对,这个新指标将帮助你做到这一点。 用户手册:点击这里  https://www.mql5.com/en/blogs/post/708783 特点  显示每个时间段的ACS28和GAP-speed(冲动)的货币强度值。 列:颜色代码以7种颜色
Trend Screener
STE S.S.COMPANY
4.81 (89)
趋势指标,趋势交易和过滤的突破性独特解决方案,所有重要趋势功能都内置在一个工具中! 它是 100% 非重绘多时间框架和多货币指标,可用于所有符号/工具:外汇、商品、加密货币、指数、股票。 限时优惠:支撑和阻力筛选指标仅售 50美元,终身有效。(原价 250 美元)(优惠延长) 趋势筛选器是有效的指标趋势跟踪指标,它在图表中提供带有点的箭头趋势信号。 趋势分析器指标中可用的功能: 1.趋势扫描仪。 2. 具有最大利润分析的趋势线。 3.趋势货币强度计。 4. 带有警报的趋势反转点。 5. 带有警报的强趋势点。 6. 趋势箭头 每日分析示例,每日信号表现...等与我们的趋势筛选指标,可以在这里找到: 点击这里 限时优惠:Trend Screener Indicator 仅售 50 美元且终身可用。原价 125$) 通过访问我们的 MQL5 博客,您可以找到我们所有的高级指标以及分析示例、每日信号表现...等。 : 点击这里 我们的趋势系统由 2 个指标组成: 1. Trend Screener Indicator:显示趋势仪表盘、图表中的趋势线、入场点...等。 2.
Dynamic Forex28 Navigator
Bernhard Schweigert
5 (4)
Dynamic Forex28 Navigator - 下一代外汇交易工具。 当前 49% 折扣。 Dynamic Forex28 Navigator 是我们长期流行的指标的演变,将三种功能合二为一: 高级货币强度 28 指标 (695 条评论)+ 高级货币 IMPULSE 带警报 (520 条评论)+ CS28 组合信号(奖励)。 有关指标的详细信息 https://www.mql5.com/en/blogs/post/758844 下一代强度指标提供什么? 您喜欢的原始指标的一切,现在通过新功能和更高的精度进行了增强。 主要特点: 专有货币强度公式。  所有时间范围内的平滑和准确的强度线。 非常适合识别趋势和精确进入。 动态市场斐波那契水平(市场斐波那契)。  此指标独有的独特功能。 斐波那契应用于货币强度,而不是价格图表。 适应实时市场活动以获得准确的反转区域。 实时市场动量。  第 9 行显示市场是活跃还是被动。 对于定时交易至关重要。 全面的警报和显示。  每种货币最强的买入和卖出动量。 ​​28 对的双重动量买入和卖出。 超买/超卖警告外部范围
TPSpro RFI Levels
Roman Podpora
4.82 (22)
指示       俄罗斯 -        英语   建议 与指示器一起使用     -       TPSpro 趋势专业版 -   MT4版本       交易中的一个关键要素是做出买卖交易工具决定的区域或水平。尽管主要参与者试图隐藏他们在市场中的存在,但他们不可避免地会留下痕迹。我们的任务是学习如何识别这些痕迹并正确解释它们。 主要功能: 向卖家和买家显示活跃区域! 该指标显示所有正确的初始买入和卖出脉冲水平/区域。激活这些水平/区域后,开始寻找切入点,水平会改变颜色并填充特定阴影。此外,还会显示箭头,以便更直观地了解情况。 显示更高时间范围内的级别/区域(MTF 模式) 添加了使用更高时间间隔显示级别/区域的功能。此外,该指标还具有自动趋势检测功能(   TPSproTREND PRO   )。 用于交易的单独专业的逐步算法。 该算法专为日内交易而设计,既可顺势交易,也可逆势交易。每个活动模板均提供详细说明。 适用于多种时间范围 。 TPSpro RFI 水平指标可用于图表上的任何时间范围,从一分钟(M1)开始一直到每月(MN)。 图形和声音警报。 该指标提供图形和声音指示
Bull versus Bear
Mohamed Hassan
4.47 (17)
Enjoy a   50% OFF   Christmas holiday sale!   Offer ends 27 December 2025 . Send us a message after your purchase to receive more information on how to get your  BONUS  for FREE  that works in great combination with Bull vs Bear ! Bull versus Bear is an easy-to-use Forex indicator that gives traders clear and accurate signals based on clear trend retests . Forget about lagging indicators or staring at charts for hours because  Bull vs Bear provides real-time entries with no lag and no repain
Scalper Inside PRO
Alexey Minkov
4.75 (59)
!!!CHRISTMAS SALE!!! An exclusive indicator that utilizes an innovative algorithm to swiftly and accurately determine the market trend. The indicator automatically calculates opening, closing, and profit levels, providing detailed trading statistics. With these features, you can choose the most appropriate trading instrument for the current market conditions. Additionally, you can easily integrate your own arrow indicators into Scalper Inside Pro to quickly evaluate their statistics and profitab
TPSproTREND PrO
Roman Podpora
4.79 (19)
TPSpro TREND PRO 是一个趋势指标,可以自动分析市场并提供有关趋势及其每次变化的信息,并给出进入交易的信号而无需重新绘制! 该指标使用每根蜡烛,分别对其进行分析。指不同的脉冲——向上或向下脉冲。货币、加密货币、金属、股票、指数交易的准确切入点! MT5版本                 指标的完整描述   我们建议将其与 指示器 -   RFI LEVELS 一起使用 主要功能: 准确的输入信号,无需渲染! 如果出现信号,它仍然相关!这是与重提指标的一个重要区别,重提指标可以提供信号然后改变信号,这可能导致存款资金的损失。现在您可以以更高的概率和准确度进入市场。还有一个功能是在箭头出现后为蜡烛着色,直到达到目标(止盈)或出现反转信号。 显示止损/获利区域 为了提高搜索切入点时的视觉清晰度,创建了一个模块,该模块最初显示买入/卖出区域,在该区域中搜索进入市场的最佳点。用于处理止损水平的附加智能逻辑有助于随着时间的推移减小其大小,从而降低进入交易(移动 sl)时的初始风险。 显示较高时间范围内的最小值/最大值(MTF 模式) 添加了一项功能,可以显示较高时间间隔的最小
Gold Stuff
Vasiliy Strukov
4.86 (247)
Gold Stuff 是专为黄金设计的趋势指标,也可用于任何金融工具。 该指标不会重绘,也不会滞后。 推荐时间框架 H1。 在它指标工作全自动专家顾问 EA Gold Stuff。 你可以在我的个人资料中找到它。 重要! 购买后立即与我联系,以获得说明和奖金!   您可以免费收到我们的强力支持和趋势扫描指标的副本,请私信。大部头书! 购买后立即联系我以获得设置和个人奖励!   设置 绘制箭头 - 打开关闭。 在图表上绘制箭头。 警报 - 打开关闭声音警报。 电子邮件通知 - 打开关闭。 电子邮件通知。 Puch-notification - 打开关闭。 推送通知。 接下来,调整色域。 Gold Stuff 是专为黄金设计的趋势指标,也可用于任何金融工具。 该指标不会重绘,也不会滞后。 推荐时间框架 H1。 在它指标工作全自动专家顾问 EA Gold Stuff。 你可以在我的个人资料中找到它。 购买后立即联系我以获得设置和个人奖励!   设置 绘制箭头 - 打开关闭。 在图表上绘制箭头。 警报 - 打开关闭声音警报。 电子邮件通知 - 打开关闭。 电子邮件通
首先,值得强调的是,这个交易工具是非重绘、非重画和非滞后的指标,非常适合专业交易。 在线课程,用户手册和演示。 智能价格行动概念指标是一个非常强大的工具,既适用于新手,也适用于经验丰富的交易者。它将超过20个有用的指标合并到一个指标中,结合了高级交易思想,如内圈交易员分析和智能资金概念交易策略。该指标侧重于智能资金概念,提供有关大型机构交易方式的见解,帮助预测它们的动向。 它在流动性分析方面尤其擅长,有助于理解机构的交易方式。它擅长预测市场趋势,并仔细分析价格波动。通过将您的交易与机构策略对齐,您可以更准确地预测市场走向。该指标多才多艺,擅长分析市场结构,识别重要的订单区块,并识别各种模式。 它擅长识别BOS和CHoCH等模式,理解动量的转变,并突出显示供需强劲的关键区域。它还擅长发现强大的不平衡,并分析价格创造更高高点或更低低点的模式。如果您使用斐波那契回撤工具,该指标可以满足您的需求。它还可以识别相等的高点和低点,分析不同的时间框架,并通过仪表板显示数据。 对于使用更高级策略的交易者,该指标提供了工具,如公平价值差指标和优惠和折扣区域的识别。它特别关注高时间框架订单
FX Volume
Daniel Stein
4.58 (33)
利用外汇交易量在外汇交易中获得真正的优势:终极成交量指标 外汇交易量(FX Volume)是第一个也是唯一一个从内部人士的角度揭示真实市场情绪的交易量指标。通过对机构市场参与者和经纪商的定位提供独到的见解,FX Volume 使您能够以通常只为主要参与者保留的先见之明进行交易。告别 COT 报告的延迟,FX Volume 可以在您的图表上即时为您提供这些关键信息,使您能够做出更快、更明智的交易决策。 为什么外汇交易量对您的交易至关重要? 使用 FX Volume,您可以获得无与伦比的独特市场数据,为您提供一般交易量指标无法提供的洞察力。以下是您可以在图表上直接跟踪的数据: 仓位比率:查看各种货币的多空比率,清晰了解市场情绪。 比率变化:查看所选时间段内多头头寸的百分比变化。 总交易量:实时跟踪各货币的总交易量(多头和空头)。 详细的多头和空头交易量:准确了解每种货币的买卖量。 净多头交易量:查看多头和空头头寸之间的差额,以衡量净情绪。 净多头百分比变化:以百分比的形式了解净多头情绪的变化,以便快速比较。 成交量-价格相关性:跟踪成交量如何影响价格,找到潜在转折点。 如何访问
Order Block Hunter
Noha Mohamed Fathy Younes Badr
5 (9)
Order block hunter indicator is the best indicator for  hunt the order blocks that area where there has been a large concentration of limit orders waiting to be executed Order blocks are identified on a chart by observing previous price action and looking for areas where the price experienced significant movement or sudden changes in direction .This indicator does that for you by using very complicated codes and helps you to take the best areas To buy and sell because it make marks at the best a
FX Dynamic - 您需要的唯一 ATR 指标 准备好用无与伦比的精确性和洞察力为您的交易策略增添动力了吗? FX Dynamic 是首个也是唯一的 ATR 指标,专为 货币分析 和 自动调整经纪商的 GMT 变动 而设计。告别过时的工具,拥抱掌握市场波动的终极解决方案。 为什么 FX Dynamic 能够改变游戏规则? 基于货币的 ATR 分析 - 摆脱传统工具的束缚。FX Dynamic 是首个超越外汇货币对和商品等符号的 ATR 指标,可 深入洞察 单个货币的 波动性 。 无与伦比的 GMT 时区 转换调整准确性 - 无需再手动修正时区。FX Dynamic 会 自动考虑经纪商的 GMT 时区转换 ,确保提供市场上最准确、最可靠的分析。 一体化多功能性 - 从短期剥头皮到长期投资,FX Dynamic 可通过自定义时间框架和精确设置适应您的交易风格。 交易者喜爱的功能 多资产分析: 分析货币、外汇货币对、黄金等。FX Dynamic 可让您发现 单个货币 对之外 的 true 动态 。 增强型风险管理: 利用为每种资产和货币量身定制的可靠 ATR 数据,自信地
MetaBands M4
Vahidreza Heidar Gholami
5 (3)
MetaBands使用强大且独特的算法绘制通道并检测趋势,以便为交易者提供进出交易的潜在点。它是一个通道指标和强大的趋势指标。它包括不同类型的通道,可以通过使用输入参数简单地合并以创建新通道。MetaBands使用所有类型的警报通知用户市场事件。 功能 支持大多数通道算法 强大的趋势检测算法 能够合并不同类型的通道 多时间帧和多货币(信号矩阵) 所有类型的警报功能(声音、屏幕闪烁、推送通知、电子邮件、弹出窗口、箭头) 它永远不会重绘 趋势检测 MetaBands使用在通道内振荡的蓝色线来检测趋势。当该线遇到通道的上界时,表明开始下跌趋势,当它遇到下界时,表明开始上涨趋势。如果蓝线接近中线,则市场处于整理期。 该指标使用独特的方法来检测趋势。一开始可能看起来有些复杂,但如果您观看视频教程,您就会意识到它是多么强大且易于使用。 入场和出场信号 当趋势变化或价格穿过上下通道时,MetaBands会立即通过不同的方法提醒交易者,这些方法可以在指标设置中启用。 信号矩阵 要监视来自不同时间框架的多个符号并在一个地方查看信号,请单击右上角按钮或按键盘上的M键以打开信号矩阵。该矩阵可以
Advanced Supply Demand
Bernhard Schweigert
4.91 (294)
现在优惠 33%! 任何新手或专业交易者的最佳解决方案! 该指标是一款独特、高质量、且价格合理的交易工具,因为我们已经整合了许多专有功能和新公式。 依据此更新,您将能够显示双重时间帧区域。 您不仅可以显示一个较高的时间帧,还可以同时显示图表时间帧,加上更高的时间帧:显示嵌套时区。 供需双方所有交易者都会喜欢它。 :) 重要信息披露 高级供需的最大潜力,请访问 https://www.mql5.com/zh/blogs/post/720245   想象您的交易如何得以改善,是因为您能够精准定位入场或目标位吗? 构建于新的底层算法,它可以更轻松地识别出买卖双方之间的潜在失衡。 这是因为它以图形方式展示供需最强劲区域,及其过去的表现(显示旧区域)。 这些功能旨在帮助您更轻松地发现最佳入场区域和价位。 现在您可以针对您的交易品种和时间帧来优化和编辑区域强度! 高级供需指标适用于所有产品和时间帧。 它是一个新的公式,非常新的功能是两个区域强度函数可由用户输入进行调整! 这在交易中是一大优势。 当您学习如何使用专有功能,例如带有价格游离最小 X 因子的区域强度时,您能够判断该区域强劲与否。 供
FX Levels MT4
Daniel Stein
探索外汇交易水平:您成功交易的终极支撑位和阻力位指标 FX Levels 不仅仅是一个支撑位和阻力位指标;对于那些希望在所有交易符号(无论是货币对、指数、股票还是商品)上获得精确性、可靠性和无缝功能的严肃交易者来说,它是一个改变游戏规则的工具。FX Levels基于成熟的灯塔(Lighthouse)方法,并增强了动态、实时的适应性,可将市场反转点直接显示在您的图表上,非常适合设定精确的盈利目标和优化您的交易条目。 为什么选择 FX Levels? Stein Investments 团队利用多年与经纪商及其不同数据源打交道的经验,使外汇交易水平在准确性和一致性方面脱颖而出。不同经纪商的水平几乎 100% 相同,FX Levels 为您提供无与伦比的可靠性,这是其他指标无法提供的。我们对细节的追求提升了 FX Levels 的水平,确保它不仅能满足您的期望,还能改变您进行支撑位和阻力位分析的方式。 FX Levels 的主要特点 两种分析方法:您可以选择经典的 "灯塔 "方法(适合静态、每日更新的水平),或者先进的动态方法(对蜡烛图形态做出实时反应,提供适应市场变化的可操作水
Automated Trendlines
Georgios Kalomoiropoulos
5 (16)
趋势线是外汇交易中最重要的技术分析工具。不幸的是,大多数交易者没有正确绘制它们。自动趋势线指标是专业交易者的专业工具,可帮助您可视化市场的趋势运动。 有两种类型的趋势线看涨趋势线和看跌趋势线。 在上升趋势中,外汇趋势线是通过价格变动的最低摆动点绘制的。 连接至少两个“最低点”将创建一条趋势线。 在下跌趋势中,趋势线是通过价格走势的最高摆动点绘制的。 连接至少两个“最高点”将创建一条趋势线。 趋势线何时突破? 当看跌蜡烛收于看涨​​趋势线下方并且蜡烛的高点在趋势线上方时,看涨趋势线会被打破。 当看涨蜡烛收于看跌趋势线上方并且蜡烛的低点低于趋势线时,看跌趋势线会被打破。 趋势线何时删除? 当一根完整的蜡烛在看涨趋势线下方形成时,看涨趋势线将被删除。 当完整的蜡烛在看跌趋势线上方形成时,看跌趋势线将被删除。 您可以从输入参数更改看涨和看跌趋势线的颜色和宽度。
Currency Strength Exotics
Bernhard Schweigert
4.87 (31)
目前8折优惠! 对任何新手或专家交易者来说都是最好的解决方案! 这个指标是专门用来显示任何符号的货币强度,如异国货币对、商品、指数或期货。它是同类产品中的第一个,任何符号都可以添加到第9行,以显示黄金、白银、石油、DAX、US30、MXN、TRY、CNH等的真实货币强度。这是一个独特的、高质量的、负担得起的交易工具,因为我们已经纳入了一些专有的功能和一个新的公式。想象一下,你的交易将如何改善,因为你能够准确地确定新趋势或剥头皮机会的触发点? 用户手册:点击这里   https://www.mql5.com/en/blogs/post/708876 它适用于所有时间框架。你将很快能够看到TREND! 根据新的基础算法设计,它使识别和确认潜在交易变得更加容易。这是因为它以图形方式显示了8种主要货币和一种符号的强弱。 该指标显示了8种主要货币(澳元加元瑞士法郎欧元英镑日元新西兰美元)的强弱线,再加上一个符号! 该指标显示了符号的真实价值。例如:对于XAUUSD(黄金):价格以美元报价。如果黄金在上涨,你怎么能知道是黄金的强势还是美元的弱势?只有当黄金走强时,我们才会进行
Chart Patterns All in One
Davit Beridze
4.57 (14)
购买后留言即可获得4个高质量的指标作为赠品。 Chart Patterns All-in-One 指标帮助交易者可视化技术分析中常用的各种图表形态。它帮助识别潜在的市场行为,但不保证盈利。建议在购买前在模拟模式下测试该指标。 当前优惠 : “Chart Patterns All in One” 指标享受 50% 折扣。 包含的形态 : 1-2-3 形态 :通过三个关键点(高点或低点)检测市场反转。 买入 :连续两个低点后出现较低的高点。 卖出 :连续两个高点后出现较高的低点。 可视化 :线条和箭头连接识别的点。 双顶和双底 :当价格形成两个连续的高点(双顶)或低点(双底)且它们大致相等时,表明反转趋势。 双顶 :看跌反转。 双底 :看涨反转。 可视化 :线条连接峰值或低谷,箭头标记反转点。 三顶和三底 :与双顶/双底类似,但有三个连续的高点或低点,信号更强的反转趋势。 三顶 :看跌反转。 三底 :看涨反转。 可视化 :线条和箭头标记形态。 三角形 :在趋势延续前识别整合期(基于 Zig-Zag,有时可能会延迟出现或消失)。 上升三角形 :看涨延续。 下降三角形 :看跌延续。 可视化 :
Advanced Currency IMPULSE with ALERT
Bernhard Schweigert
4.9 (483)
目前31%的折扣!! 对任何新手或专家交易者来说都是最好的解决方案! 这个指标是一个独特的、高质量的、负担得起的交易工具,因为我们已经纳入了一些专有的功能和一个秘密的公式。只需一张图表,它就能给出所有28种货币对的警报。想象一下,你的交易将如何改善,因为你能够准确地确定新趋势或剥头皮机会的触发点 建立在新的基础算法上,它使识别和确认潜在交易变得更加容易。这是因为它以图形方式显示了一种货币的强势或弱势是否正在加速,并测量了这种加速的速度--把它想象成你汽车中的速度表。当你加速时,事情显然会发生得更快,这在外汇市场上也是一样的,即如果你配对的货币正在向相反的方向加速,你就会发现一个潜在的有利可图的交易。 货币动量的垂直线和箭头将指导你的交易! 动态的市场斐波那契23水平被用作警报触发器,将适应市场活动。如果冲动触及黄色触发线,您将在MetaTrader或您的电子邮件或推送警报中收到警报。然后你就知道作为一个交易员应该做什么。货币对和方向已经给出。只要点击警报按钮,就可以切换到该货币对或打开一个新的图表,以便进一步分析。警报级别可以通过用户输入来改变,可以选择3个敏感度级别
Enigmera
Ivan Stefanov
5 (3)
ENIGMERA:市场核心 https://www.enigmera.com 简介 该指标和交易系统是金融市场的一种非凡方法。ENIGMERA 利用分形周期精确计算支撑位和阻力位。它能显示真实的累积阶段,并给出方向和目标。 该系统无论在趋势中还是在修正中都能发挥作用。 它是如何运行的? ENIGMERA 由三条线组成:支撑/阻力线、目标线和偏离线。与一般市场指标将过去的数据推断为现在和未来的情况不同,该系统能提供当前的完整情况。如果你处于支撑位,这意味着真正的支撑;如果你处于阻力位,这意味着真正的阻力。如果突破某一水平,则表示趋势发生变化。没有重绘。 由于市场在不断变化,ENIGMERA 不断调整其评估工具,定期修改策略。  这保证了每种情况都能得到全面评估。这一市场指标的独特性显而易见,其能力不言而喻。  ENIGMERA 为金融分析师和咨询师提供服务,他们需要可靠的见解与客户分享,也为投资者提供服务,他们需要最精确和最可靠的保证。 该系统能够达到最佳精度,使交易者能够自信、清晰地评估他们的选择。 ENIGMERA 将 20 年的交易专长和知识整合到一个综合软件
Graf Mason
Alexandr Lapin
5 (9)
Graf Mason is a tool that will make you a professional analyst! The method of determining wave movements using inclined channels qualitatively conveys the schematics of the movement of any instrument, showing not only possible reversals in the market, but also the goals of further movements!Destroys the myth that the market is alive , clearly showing the schematics of movements from one range to another! A professional tool, suitable for the medium term with the definition of the current trend!
FX Power MT4 NG
Daniel Stein
5 (14)
释放 FX Power NG 的全部威力:终极货币强度表 八年多来,FX Power 一直为全球交易者提供可靠、精确的货币强弱分析。 现在,FX Power NG 将这一值得信赖的工具提升到新的水平,提供先进的功能,为您的交易带来无与伦比的准确性、定制化和洞察力。 是什么让 FX Power NG 成为严肃交易者的必备工具? FX Power NG 以您喜爱的原版 FX Power 的所有功能为基础,进行了重要的添加和改进: 黄金强度分析 (XAU):现在,您可以在追踪货币对的同时追踪黄金的强弱,从而获得更广泛的市场洞察力。 精细计算:在每次分析中体验更精确、更可靠的结果。 自定义分析周期:调整分析周期以适应您的交易策略,从日内分析到长期洞察。 先进的多实例设置:运行多个实例以获得全面的视图,非常适合分析多个时间框架或策略。 无限图形定制:个性化每个图表的颜色和样式,以匹配您的交易环境。 增强的警报功能:设置自定义通知,让你不会错过重要的转变或机会。 现代设计和动态面板:享受专为最新操作系统设计的时尚、用户友好界面,以及流畅的交互式指标面板。 FX Power NG 的突出
Trend Punch
Mohamed Hassan
4.79 (24)
Enjoy a   50% OFF   Christmas holiday sale!   Offer ends 27 December 2025 . This indicator is unstoppable when combined with our other indicator called  Support & Resistance . After purchase, send us a message and you will get it   for  FREE as a BONUS! Introducing Trend Punch , the revolutionary forex trend indicator that will transform the way you trade! Trend Punch is uniquely designed to provide precise buy and sell arrows during strong market trends, making your trading decisions clearer
Dark Absolute Trend
Marco Solito
4.58 (40)
Dark Absolute Trend   is an Indicator for intraday trading. This Indicator is based on Trend Following  strategy but use also candlestick patterns and Volatility. We can enter in good price with this Indicator, in order to follow the main trend on the current instrument. It is advised to use low spread ECN brokers. This Indicator does Not repaint and N ot lag . Recommended timeframes are M5, M15 and H1. Recommended working pairs: All. I nstallation and  Update Guide   -  Troubleshooting guide  
此儀表板是與市場結構反轉指標一起使用的警報工具。它的主要目的是提醒您在特定時間範圍內的逆轉機會,以及像指標一樣重新測試警報(確認)。儀表板設計為單獨放置在圖表上,並在後台工作,以向您發送有關您選擇的貨幣對和時間範圍的警報。它是在許多人要求衝刺以同時監控多個貨幣對和時間框架而不是讓市場反轉指標在一個 MT4 中的多個圖表上運行之後開發的。它會在 M5、M15、M30、H1、H4 和 D1 時間範圍內發出警報。當然,與交易中的任何事情一樣,更高的時間框架效果最好。 該儀表板被設計為市場結構反轉指標的附加組件。它將獨立工作,並提醒市場反轉警報指標給出的模式和信號。 在此處獲取市場反轉警報指標: https://www.mql5.com/en/market/product/46295 此儀表板的 MT5 版本可在此處獲得: https://www.mql5.com/en/market/product/65828 此處提供 EA:汽車交易市場反轉警報! https://www.mql5.com/en/market/product/65383 我創建的用於繪製矩形並提醒特定貨幣對的市
ICT, SMC, SMART MONEY CONCEPTS, SMART MONEY, Smart Money Concept, Support and Resistance, Trend Analysis, Price Action, Market Structure, Order Blocks, BOS/CHoCH,   Breaker Blocks ,  Momentum Shift,   Supply&Demand Zone/Order Blocks , Strong Imbalance, HH/LL/HL/LH,    Fair Value Gap, FVG,  Premium  &   Discount   Zones, Fibonacci Retracement, OTE, Buy Side Liquidity, Sell Side Liquidity, BSL/SSL Taken, Equal Highs & Lows, MTF Dashboard, Multiple Time Frame, BigBar, HTF OB, HTF Market Structure, 
作者的更多信息
HFTHackerMT5
Thomas Bradley Butler
5 (3)
由於優化過程的複雜性和用戶的混亂,這已經回到了簡單版本而沒有恢復。 如果您購買了低於 15 的先前版本且具有恢復功能,請勿使用 15。 如果它太複雜用戶就不會使用。 在測試和使用之前優化 EA。僅在優化後才購買。這適合那些知道如何優化並希望憑藉自身優勢獲利的交易者。 您設定您的風險參數。如果您選擇不成功的交易,則可透過停損獲得高勝率。降低長壽風險。 這適用於所有帳戶,是一個風險管理工具,請閱讀所有評論、描述和部落格。 MT4版本: https://www.mql5.com/en/market/product/73834 此智慧交易系統 (EA) 使用每個部位的固定手數自動執行買賣交易。其核心特點是無論帳戶餘額如何,都保持一致的交易規模,確保交易者完全控制每筆交易的風險。這種方法可以實現簡單且可預測的交易策略,無需根據帳戶規模或波動進行調整。透過保持手數大小固定,交易者可以避免動態大小的複雜性,同時堅持他們首選的風險管理策略。 透過購買和使用此 Expert Advisor (EA),您承認您已在策略測試器上徹底測試了 EA,並了解自動交易中涉及的相關風險。您進一步承認,
Gold M1
Thomas Bradley Butler
没有 EA 会在短时间内将数亿变成数百万,这是一个谎言。 EA 的交易 1 分钟图表并不多,更不用说黄金了。 这个 EA 是独一无二的,它使用烛台和商品通道指数在 1 分钟的时间范围内交易 XAU/USD。 相应地调整输入,优化。 使用 VPS 进行交易或仅用于日间交易目的。 推荐用于日间交易,但如果您选择这样做,请尝试不同的设置和时间范围。 在需要时进行优化以供您使用。 EA 需要持续优化以获得最佳结果 设置文件位于测试的评论中。 没有 EA 会在短时间内将数亿变成数百万,这是一个谎言。 EA 的交易 1 分钟图表并不多,更不用说黄金了。 这个 EA 是独一无二的,它使用烛台和商品通道指数在 1 分钟的时间范围内交易 XAU/USD。 相应地调整输入,优化。 使用 VPS 进行交易或仅用于日间交易目的。 推荐用于日间交易,但如果您选择这样做,请尝试不同的设置和时间范围。 在需要时进行优化以供您使用。 EA 需要持续优化以获得最佳结果 设置文件位于测试的评论中。
Matrix Hacker
Thomas Bradley Butler
MT4 Version :   https://www.mql5.com/en/market/product/87060 Matrix Hacker 仅适用于对冲账户并使用随机游走,过去无关紧要。 EA 将在市场中保持稳定并涵盖询价和出价。根据交易者的不同,买卖大小和交易量不同的买盘和卖盘。不建议初学者这样做,因为它仍然需要了解优化而不是过度杠杆化。我建议使用设置来剥削较小的点并保持在范围内。 此 EA 可能会打开 4 笔交易,因此了解这一点可确保输入的大小正确。它使用固定手数,因此需要考虑 4 笔固定手数的交易。在进行实时交易之前先在演示中使用此 EA,并且只有在有信心之前才能使用增量手数。建议每微手 1000 美元。对于日间交易,如果使用 DMA 经纪商和小点差和滑点,则降低 tp。然后,如果在一天结束时整体获利,则退出所有头寸。最后,是否有利润很重要,而不是有多少是正确的。您也可以在不同对之间分配。有很多方法可以对冲以降低风险。一起交易不相关和相关的货币对。 重要的事情是优化输入。优化策略测试器中的上个月选项。保存设置文件并在交易中使用它们。随着市场动态的变化,设置
Black Gold M1
Thomas Bradley Butler
OPTIMIZE BEFORE BACKTEST AND USE Trade crude oil with this EA.  No EA turns hundreds into millions in a year or 2, This is a lie if presented this way.  Black Gold trades Brent Crude on 1 min charts.  It uses RSI, moving averages and directional indicators.  Try it out, load it onto the tester if you have the history and ability to trade Brent crude.    Adjust and optimize to get the most out of the expert advisor
NeuroScalperMT5
Thomas Bradley Butler
MT4 indicator version https://www.mql5.com/en/market/product/72342 I personally use this indicator to scalp.  Accurate for accessing extremes and supports for buy positions primarily for 1 minute time frames.  Other time frames can be used but the levels are different. Its a better oscillator and compare with others to see the difference.          Day trade using neuro network concepts.  This indicator uses elementary forms of neuro networks to generate signals to buy and sell. Use the indicat
Bitcoin White Hat Hacker
Thomas Bradley Butler
Optimize before use in back test or live for better results for you  and don't forget to account for spreads and slippage in optimization. This Expert is for 1 minute charts trading BTC/USD.  Bitcoin on 1 minute use MACD, CCI and RSI for entry and exit logic.  This EA was back tested and traded out of sample.  Each trade has a stop loss and take profit.   BTC compared to the indexes and Gold have huge differences, look at the example of traditional investing vs. Bitcoin.  Yellow line represents
ForexReversal
Thomas Bradley Butler
4 (1)
耐心是无压力剥头皮的关键。 当您看到它通过 200 移动平均线时交易箭头,并通过扩大或从没有移动平均过滤器的最后一个摆动点形成趋势。 适用于 1 分钟时间框架,捕捉日内动量走势。 使用追踪止损轻松获得 20 个点或为更大的趋势停留更长时间。 查看该指标中真正大笔交易的照片中的示例。 1 分钟的时间框架效果最好。 缩小以查看趋势。 箭头不会重新绘制或重新计算。 附加到 1 分钟的时间框架并研究交易,看看它是否可用于您的策略。 一世 规则: 买蓝色 红色出售 远离横盘整理 交易量大,交易动量 使用止损 耐心是无压力剥头皮的关键。 当您看到它通过 200 移动平均线时交易箭头,并通过扩大或从没有移动平均过滤器的最后一个摆动点形成趋势。 适用于 1 分钟时间框架,捕捉日内动量走势。 使用追踪止损轻松获得 20 个点或为更大的趋势停留更长时间。 查看该指标中真正大笔交易的照片中的示例。 1 分钟的时间框架效果最好。 缩小以查看趋势。 箭头不会重新绘制或重新计算。 附加到 1 分钟的时间框架并研究交易,看看它是否可用于您的策略。 一世 规则: 买蓝色 红色出售 远离横
NeuroScalper
Thomas Bradley Butler
5 (1)
更新!箭头被添加到 100 和 200 级别。 该指标可准确访问极端情况,并主要支持 1 分钟时间范围内的买入头寸。可以使用其他时间范围,但级别不同。它是一个更好的振荡器,并与其他振荡器进行比较以查看差异。 使用神经网络概念的日间交易。该指标使用神经网络的基本形式来生成买卖信号。在 1 分钟图表上使用该指标。指示器不会重新绘制。下载并使用 1 分钟图表或其他使用不同级别的图表在测试仪上运行,分析交易以亲自查看。剥头皮市场的许多机会。可用于更高的时间范围,但应根据您的判断更改水平。较高的时间范围具有较高的范围。 使用此模型要考虑的概念和事项: 使用了多个指标,应用了权重,最大值和最小值为 2 个数据点。该指标主要用于交易上升趋势在振荡器的设置(见图)100 和 200 中添加级别,如果使用不同的时间框架,则添加其他级别。
VolumeDayTrader
Thomas Bradley Butler
僅限股票(差價合約)的日間交易。 交易需要工作。 沒有捷徑或指標可以告訴您所有的進入和退出。 利潤來自心態。 指標是與資金管理和成功心理學結合使用的工具。 查找音量配置文件中的不平衡。 貿易價格量不平衡。 許多不平衡發生在收盤、開盤和新聞中。 查看股票中的買家與賣家。 使用 5 分鐘到 1 小時來查看誰可以控制價格並發現價格不平衡。 更大的股票是 15 分鐘及以上。 將鼠標懸停在顏色音量條上以查看過去條的數量。 當前條形圖的音量寫在右上角。 找出交易量的不平衡,看看價格在一段時間內可能走向何方。 跟隨主導趨勢以獲得最佳結果 如果趨勢發展尋找交易趨勢。 使用追踪止損並留意大量反轉不平衡。 交易 Apple、SPY、GOOLE、TESLA。 所有你最喜歡的股票
GoldBuyBackScalper
Thomas Bradley Butler
4 (1)
该指标仅适用于 XAU/USD,1 分钟图表。 每对都有独特的特征和价格走势。 使用该指标交易 V 形反转。 头皮使用追踪止损购买并避免新闻,因为它们更加极端并且可能导致突然抛售。 在回测中附加到 1 分钟的时间范围并查看反转购买。 指标从不重新绘制或重新计算。 仅在营业时间内交易 该指标仅适用于 XAU/USD,1 分钟图表。 每对都有独特的特征和价格走势。 使用该指标交易 V 形反转。 头皮使用追踪止损购买并避免新闻,因为它们更加极端并且可能导致突然抛售。 在回测中附加到 1 分钟的时间范围并查看反转购买。 指标从不重新绘制或重新计算。 仅在营业时间内交易 该指标仅适用于 XAU/USD,1 分钟图表。 每对都有独特的特征和价格走势。 使用该指标交易 V 形反转。 头皮使用追踪止损购买并避免新闻,因为它们更加极端并且可能导致突然抛售。 在回测中附加到 1 分钟的时间范围并查看反转购买。 指标从不重新绘制或重新计算。 仅在营业时间内交易
TrueSupplyandDemand
Thomas Bradley Butler
This is based on short term strength or weakness and not on moving averages.  Moving averages are used for filter only. Trade supply and demand with arrows. Supply and demand breakouts and strength of the buyers or sellers .  Don't trade buy arrow to sell arrow.  Trade the strength with trendlines or moving averages and use stops.  The arrow can have some strong moves.  Trade on all time frames.  Try it out in the back tester. The pips can be made with this indicator, follow the arrows and mak
ScalpingMaster
Thomas Bradley Butler
Master scalping with this indicator.  Trade on any time frame for scalps on buy or sells.  Follow trends using a 200 moving average and stops and targets.  Use with your own system.  This indicator can give pips if following it correctly.  Stick to rules and pick up pips daily.  Use as entries in a trend, scalp for a few pips or exit on opposite signal.  Best to follow higher time frame trends. Indicator doesn't repaint or recalculate. Rules: Don't trade overnight, only trade during active sessi
DayTradeKing
Thomas Bradley Butler
This indicator is good for small time frames like 1 and 5 minutes and made for day trading. The indicator never repaints or recalculates. The indicator works is for trading swing points in day trading, following bulls or bears.  Its a simple to use, non cluttered indicator with a high success rate.  This indicator works well to capture ranges.  All indicators come with limitations and no indicator or system is always accurate. Use money management for long term trading success.   Place in backte
DTKGold
Thomas Bradley Butler
This is the DayTradeKing for gold on a 1 minute time frame.  It is a different calculation for the range. Use a 200 period moving average as a filter.  Always use stops and avoid news, wait for more conformation.  This looks to capture intraday ranges. Put it in the back tester on 1 minute to see the price action and how it works. Trade with trend Use filter Use stops Alerts are added for pop ups and sound. 
SuperArrowScalper
Thomas Bradley Butler
Trade trends with the Super Scalper Use on all time frames and assets it is  designed for scalping trends. Works good on small time frames for day trading.  The arrows are easy to follow.  This is a simple no repaint/no recalculate arrow indicator to follow trends with.  Use in conjunction with your own system or use moving averages.  Always use stops just below or above the last swing point or your own money management system The indicator comes with push notifications, sound alerts and email
Levels Trading
Thomas Bradley Butler
This indicator is a simple stripped down version of any advanced support and resistance indicator.  All the support and resistance indicators work from a number of bars that have developed over time. Get rid of clutter and confusing levels.  Find levels according to a number of bars. Look at days, session, numbers of hours, periods of consolidation.  Watch levels develop and use as breakout points, or areas of buyers and sellers.  Features and things to consider This indicator is for a frame of
ForexReversalEA
Thomas Bradley Butler
https://www.mql5.com/en/market/product/57345 该 EA 基于外汇反转指标。 如果您更喜欢手动交易系统,请下载指标并试用。 EA 将跟随趋势并相应地开仓。 结果显示具有较低回撤的稳定收益,但在回测器、优化器和时间框架中进行试验,看看什么有效。 显示的所有结果都是假设的。 注意:这不是鞅或网格。 该指标确实具有对冲能力 此 EA 具有以下功能,并根据您的风险进行更改。 EA根据可用保证金添加,根据参数买卖。 通过输入控制风险。 inp 5 是卖 inp 7 是购买 固定止损手数 固定获利   可用保证金百分比 该 EA 基于外汇反转指标。 如果您更喜欢手动交易系统,请下载指标并试用。 EA 将跟随趋势并相应地开仓。 结果显示具有较低回撤的稳定收益,但在回测器、优化器和时间框架中进行试验,看看什么有效。 显示的所有结果都是假设的。 注意:这不是鞅或网格。 该指标确实具有对冲能力 此 EA 具有以下功能,并根据您的风险进行更改。 EA根据可用保证金添加,根据参数买卖。 通过输入控制风险。
HFTHacker
Thomas Bradley Butler
由於優化過程的複雜性和用戶的混亂,這已經回到了簡單版本而沒有恢復 在測試和使用之前優化 EA。僅在優化後才購買。這適合那些知道如何優化並希望憑藉自身優勢獲利的交易者。 您設定您的風險參數。如果您選擇不成功的交易,則可透過停損獲得高勝率。降低長壽風險。 這適用於所有帳戶,是一個風險管理工具,請閱讀所有評論、描述和 MT5版本: https://www.mql5.com/en/market/product/74421 此智慧交易系統 (EA) 會自動執行買賣交易,同時根據交易者的帳戶餘額調整部位規模。其核心功能是動態調整交易規模,確保隨著帳戶的成長或收縮,風險與可用資本保持成比例。這有助於保持一致的交易策略,而不會在任何特定交易中過度槓桿化或風險過低。我不提供文件。透過購買和使用此 Expert Advisor (EA),您承認您已在策略測試器上徹底測試了 EA,並了解自動交易中涉及的相關風險。您進一步承認,過去的表現並不能保證未來的結果,並且使用此 EA 存在固有風險,包括潛在的投資資本損失。 設定: 輸入 int inp1_CompareCount = 0;
MarketMaker
Thomas Bradley Butler
自动化供需交易。做一个市场。 这个 EA 的制作和灵感来自于每个人都在销售和模仿的流行供需指标。 EA 继续交易和对冲,做市。也可以在非对冲账户上交易。需要评估风险并使用时间框架、手数、对冲能力。我已经在一个月左右的时间里一次断断续续地交易了多对。 系统概念: EA 交易供需水平。水平发生变化,因此 EA 将继续交易新水平。在手数较低的多对之间进行分配是系统中的一项功能。在保持稳定收益的同时,应避免大幅回撤。 SL 可以使用,但我解释的对冲方面允许这是一种选择。我在多对小手上得到的回撤是 4%,这是没有止损的。较大的地块显示为 6%。因此,较小的尺寸是保守的,而较大的则更具侵略性。这些是保持交易手数低于余额的原因。行业需要发展空间。 特征: 贸易计数 固定手数 音量上限 止损 获利
Top Trader
Thomas Bradley Butler
Top Trader Indicator This is an arrow reversal indicator. This is with deviations and arrows.  Trade a blue arrow for buy and trade a red arrow for sell.  Change the time period and the deviations of the bands.  This is similar to others but these arrows don't repaint.  Load in back tester and study which periods and deviations work the best.  It works on all time frames.  15 min to 1 hr would give good results for take profits.  Try according to your own risk management.
Quant Bot
Thomas Bradley Butler
Quant Bot 用于欧元/美元一小时时间框架内的趋势交易。 没有设置文件,但如果使用其他对,则可能需要优化。 关于机器人: 它使用基因生成并使用 ATR 进行交易。 前行期用于防止曲线拟合 EA 在每笔交易中都使用止损。 资金管理是按余额百分比放大 回溯期为 2003-2020 年,前进期为 2020-2022 年。(见图)。 Quant Bot 用于欧元/美元一小时时间框架内的趋势交易。 没有设置文件,但如果使用其他对,则可能需要优化。 关于机器人: 它使用基因生成并使用 ATR 进行交易。 前行期用于防止曲线拟合 EA 在每笔交易中都使用止损。 资金管理是按余额百分比放大 回溯期为 2003-2020 年,前进期为 2020-2022 年。(见图)。
Crypto Net
Thomas Bradley Butler
Crypto Net 用于在  BTCUSD。 它使用基因进化来进化策略。 该 EA 交易趋势遵循 ATR 和 Ichimoku 指标。 这是构建并通过了一系列强大的测试,包括 Monte Carlo 和 Walk Forward。 输入: 最低风险的账户百分比。 最大手数 停止交易的时间 没有其他任何改变。 Crypto Net 用于在 BTCUSD。 它使用基因进化来进化策略。 该 EA 交易趋势遵循 ATR 和 Ichimoku 指标。 这是构建并通过了一系列强大的测试,包括 Monte Carlo 和 Walk Forward。 输入: 最低风险的账户百分比。 最大手数 停止交易的时间 没有其他任何改变。 输入: 最低风险的账户百分比。 最大手数 停止交易的时间 没有其他任何改变。 输入: 最低风险的账户百分比。 最大手数 停止交易的时间 没有其他任何改变。
PropTrader
Thomas Bradley Butler
*使用前优化 EA* 欧元/美元优化外汇交易策略 通过专家顾问 (EA) 在一两年内获得巨额财富是一个不切实际的说法。 回测和真实交易重点关注欧元/美元货币对。 关于该策略: 这代表了我们战略的初始迭代,并有进一步发展的潜力。 经过 100% 质量数据的严格测试,没有 MT4 错误。 该策略按照趋势跟踪的逻辑原则运作。 当趋势看涨时,EA 启动并部署追踪止损,反之亦然。 本质上,这是一种简单的趋势跟踪方法。 主要优点和注意事项: 轻松设置:坚持使用默认设置,仅根据您的喜好修改批量大小。 风险管理:该策略不采用鞅或对冲。 风险缓解:每笔交易都配备了追踪止损和止盈水平,由平均真实波动幅度 (ATR) 确定,有助于更好的风险管理。 趋势识别:此方法旨在帮助交易者识别并利用更持久的趋势。 外汇交易风险免责声明: 外汇交易涉及保证金交易外币,风险较高,可能并不适合所有投资者。 过去的表现并不是未来业绩的保证。
Down Under
Thomas Bradley Butler
Down Under 在 1 小时的时间范围内交易澳元/美元对。 该 EA 交易 ATR 和 OHLC。 它在这个时间范围内为这对格式化。 复合使用分钟。 手数和最大。 批量。 余额的百分比是在获胜交易中复合的。 随着余额波动,手数也会波动。 设置: 毫米风险% 毫米批次 最大手数 没有什么可以改变的。 这没有马丁格尔或对冲能力。 唯一需要更改的其他功能是,如果您交易的是澳元/美元的差价合约。 在经纪人平台上按小数点更改。 风险免责声明 期货、期权和货币交易都有很大的潜在回报,但也有很大的潜在风险。 为了投资这些市场,您必须意识到风险并愿意接受它们。 Down Under 在 1 小时的时间范围内交易澳元/美元对。 该 EA 交易 ATR 和 OHLC。 它在这个时间范围内为这对格式化。 复合使用分钟。 手数和最大。 批量。 余额的百分比是在获胜交易中复合的。 随着余额波动,手数也会波动。 设置: 毫米风险% 毫米批次 最大手数 没有什么可以改变的。 这没有马丁格尔或对冲能力。 唯一需要更改的其他功能是,如果您交易的是澳元/
Cable Trader
Thomas Bradley Butler
GBP/USD 1hr. 该 EA 交易动量和会话。 这有一个固定的手数组成部分,并将随着它的发展继续修改 TP。 设置: 批量 没有什么可以改变的。 这没有马丁格尔或对冲能力。 唯一要更改的其他功能是,如果您交易的是英镑/美元的差价合约。 在经纪人平台上按小数点更改。 风险免责声明 期货、期权和货币交易都有很大的潜在回报,但也有很大的潜在风险。 为了投资这些市场,您必须意识到风险并愿意接受它们。 Cable Trade 在 1 小时的时间范围内交易 GBP/USD 对。 现场交易前的演示。 该 EA 交易动量和会话。 这有一个固定的手数组成部分,并将随着它的发展继续修改 TP。 设置: 批量 没有什么可以改变的。 这没有马丁格尔或对冲能力。 唯一要更改的其他功能是,如果您交易的是英镑/美元的差价合约。 在经纪人平台上按小数点更改。 风险免责声明 期货、期权和货币交易都有很大的潜在回报,但也有很大的潜在风险。 为了投资这些市场,您必须意识到风险并愿意接受它们。
Euclidean
Thomas Bradley Butler
欧几里得是我 8 年前提出的一种独特的交易算法。 该 EA 是该系统的一部分。 它作为一个封闭系统工作。 当角度正确以捕捉趋势时,EA 将启动买入。 止损是角度的10%。 就是这么简单。 输入: 手数余额百分比 1 微手 1,000 美元 获利水平 = 默认为 50 点 如何和需要考虑的事项: 止损是内置的,并根据价格以 10% 的角度进行交易。 止盈设置为 50 点,但可以是您想要的金额。 在 1 到 5 分钟的小时间范围内进行交易。 在回测器中对此进行测试的错误为零。 不同的平台和经纪人有不同的数据,因此请检查下载数据以进行测试。 外汇交易风险免责声明 欧几里得是我 8 年前提出的一种独特的交易算法。 该 EA 是该系统的一部分。 它作为一个封闭系统工作。 当角度正确以捕捉趋势时,EA 将启动买入。 止损是角度的10%。 就是这么简单。 输入: 手数余额百分比 交易量上限 = 最大手数 获利水平 = 默认为 50 点 如何和需要考虑的事项: 止损是内置的,并根据价格以 10% 的角度进行交易。 止盈设置为 50 点,但可以是您想要的金额。
Pip Scalper
Thomas Bradley Butler
每个人的指标 Pip Scalper 用于剥头皮趋势。 使用此指标更长时间地保持趋势。 它适用于所有时间框架和资产。 使用此工具获取每日点数。 使用 200 移动平均线过滤交易。 建议使用较小的时间范围。 用于日间交易。 关于和如何使用: Pips Scalper 基于长期趋势交易。 买蓝色 卖出红色 在活跃期间使用 200 移动平均线作为过滤器和交易。 Pip Scalper 用于剥头皮趋势。 使用此指标更长时间地保持趋势。 它适用于所有时间框架和资产。 使用此工具获取每日点数。 使用 200 移动平均线过滤交易。 建议使用较小的时间范围。 用于日间交易。 关于和如何使用: Pips Scalper 基于长期趋势交易。 买蓝色 卖出红色 在活跃期间使用 200 移动平均线作为过滤器和交易。
Evolved Trends
Thomas Bradley Butler
OPTIMIZE BEFORE TEST AND USE TO FIND BEST INPUTS Hey there traders! Want a cutting-edge Expert Advisor for your MT4 platform? Look no further than Evolved Trends! This powerful trading algorithm, created with machine learning technology, focuses on trading GBP/USD on 1 Hour time frames. But hey, feel free to experiment with other assets and time frames for optimization! Just customize the inputs to match your own risk tolerance. With stops based on ATR and the ability to lock in profits and c
Combine Winner
Thomas Bradley Butler
Trade any Forex combine out there.  Many prop firms offer challenge or instant funding combines.  The biggest problem is controlling the loss.  With this indicator you can get a visual system that can limit loss and teach discipline.  This uses the MACD and the strategy is scalping.  You can determine the risk and reward.  Visually follow small trends for scalps.  Trade during active sessions.  It's just a simple system to instill discipline while limiting loss and scalping pips with the paramet
Holy Grail Arrow
Thomas Bradley Butler
Holy Grail arrow is for scalping.  The period you use will determine the trend.  You can try different time frames and periods to see what works best for your strategy.  Filters can be applied like a moving average or trendlines.  The 1 minute works good for scalps and always trade during active periods and avoid consolidation times.  Using other indicators to determine trends is recommended but this can also be a free flowing scalping system alone with tp and sl. Inputs: Period = trend period
筛选:
无评论
回复评论
版本 2.0 2024.04.30
added denit to delete objects when removed