• 概述
  • 评论
  • 评论
  • 新特性

DYJ SignalSourceOfMACD

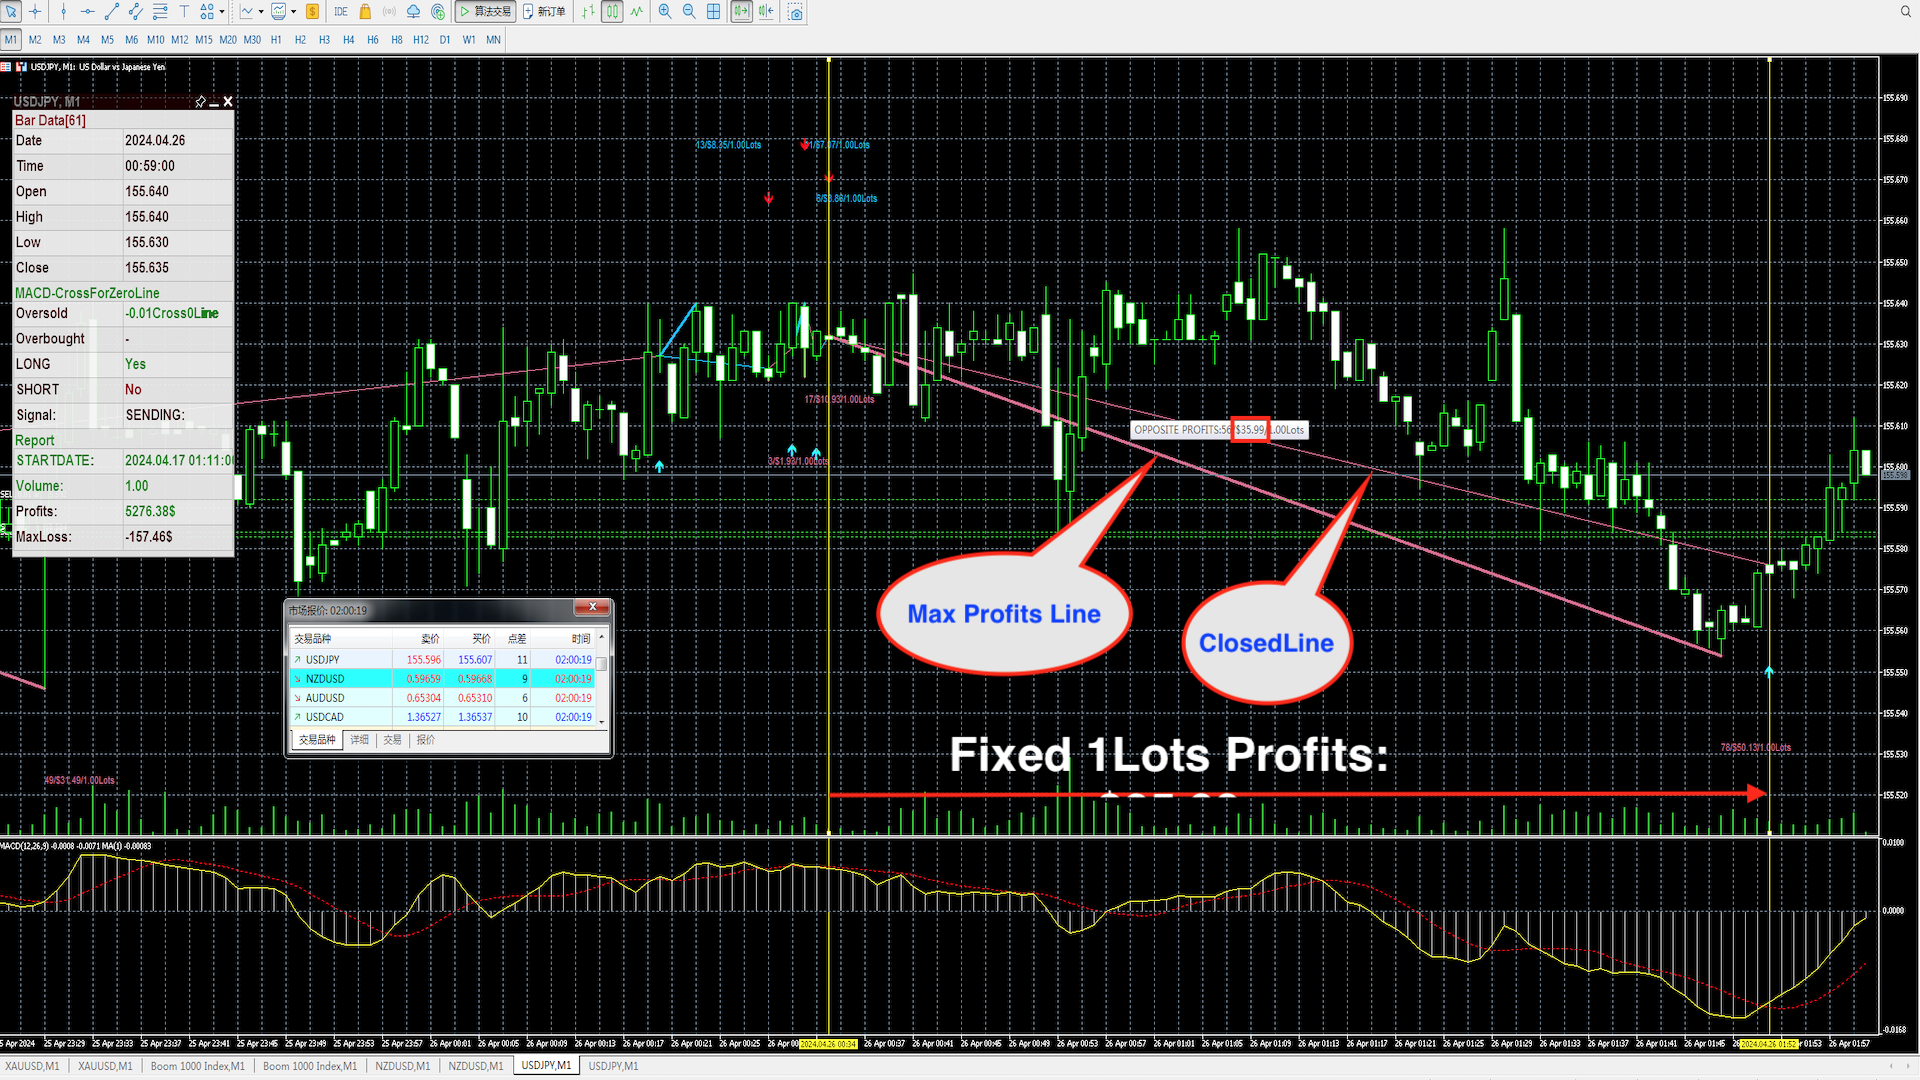
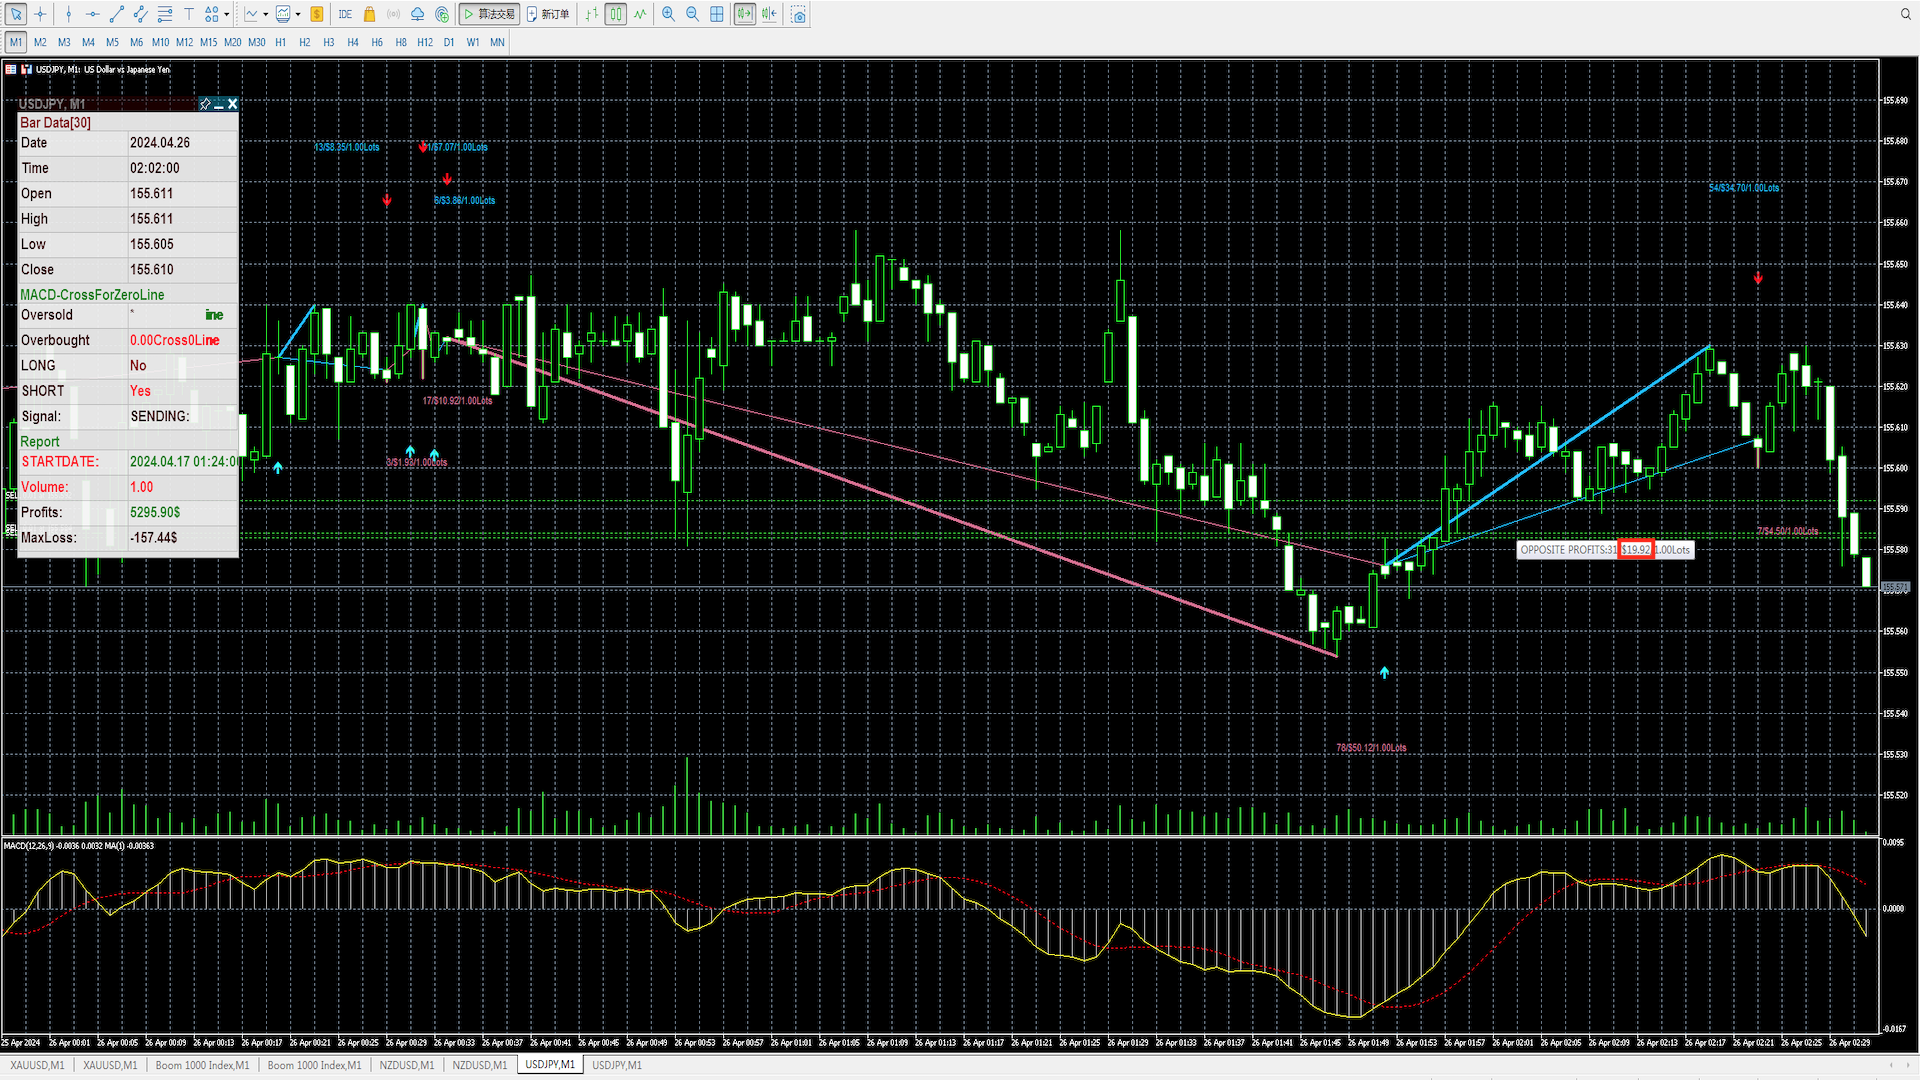
该DYJ SignalSourceOfMACD软件基于MACD指标。一般而言,当 MACD 和 MACD 指标的信号线交叉时会产生信号。

如果在 MACD 开仓参考位置下方的负数区,MACD 线向上穿越信号线,则产生买进信号。 负数区是 MACD 和信号线的值小于零的区域。

MACD 开仓参考位置的参数以点数设置。但是在代码中它被转化为:MACD 开仓参考位置 * 商品的每点大小。 例如,如果您将该值设为“3”,并对 EUR/USD 应用策略,MACD 开仓参考位置将等于 0.0003(3 点 * 每点大小 0.0001)。请注意,对于买进信号,该参数被解读为一个负值。

如果在 MACD 开仓参考位置上方的正数区,MACD 线向下穿越信号线,则产生卖出信号。 正数区是 MACD 和信号线的值大于零的区域。

请使用高概率开仓参数OpenLevel($)控制开仓位置,它决定低买高卖的深度,从而有机会获得更大利润!

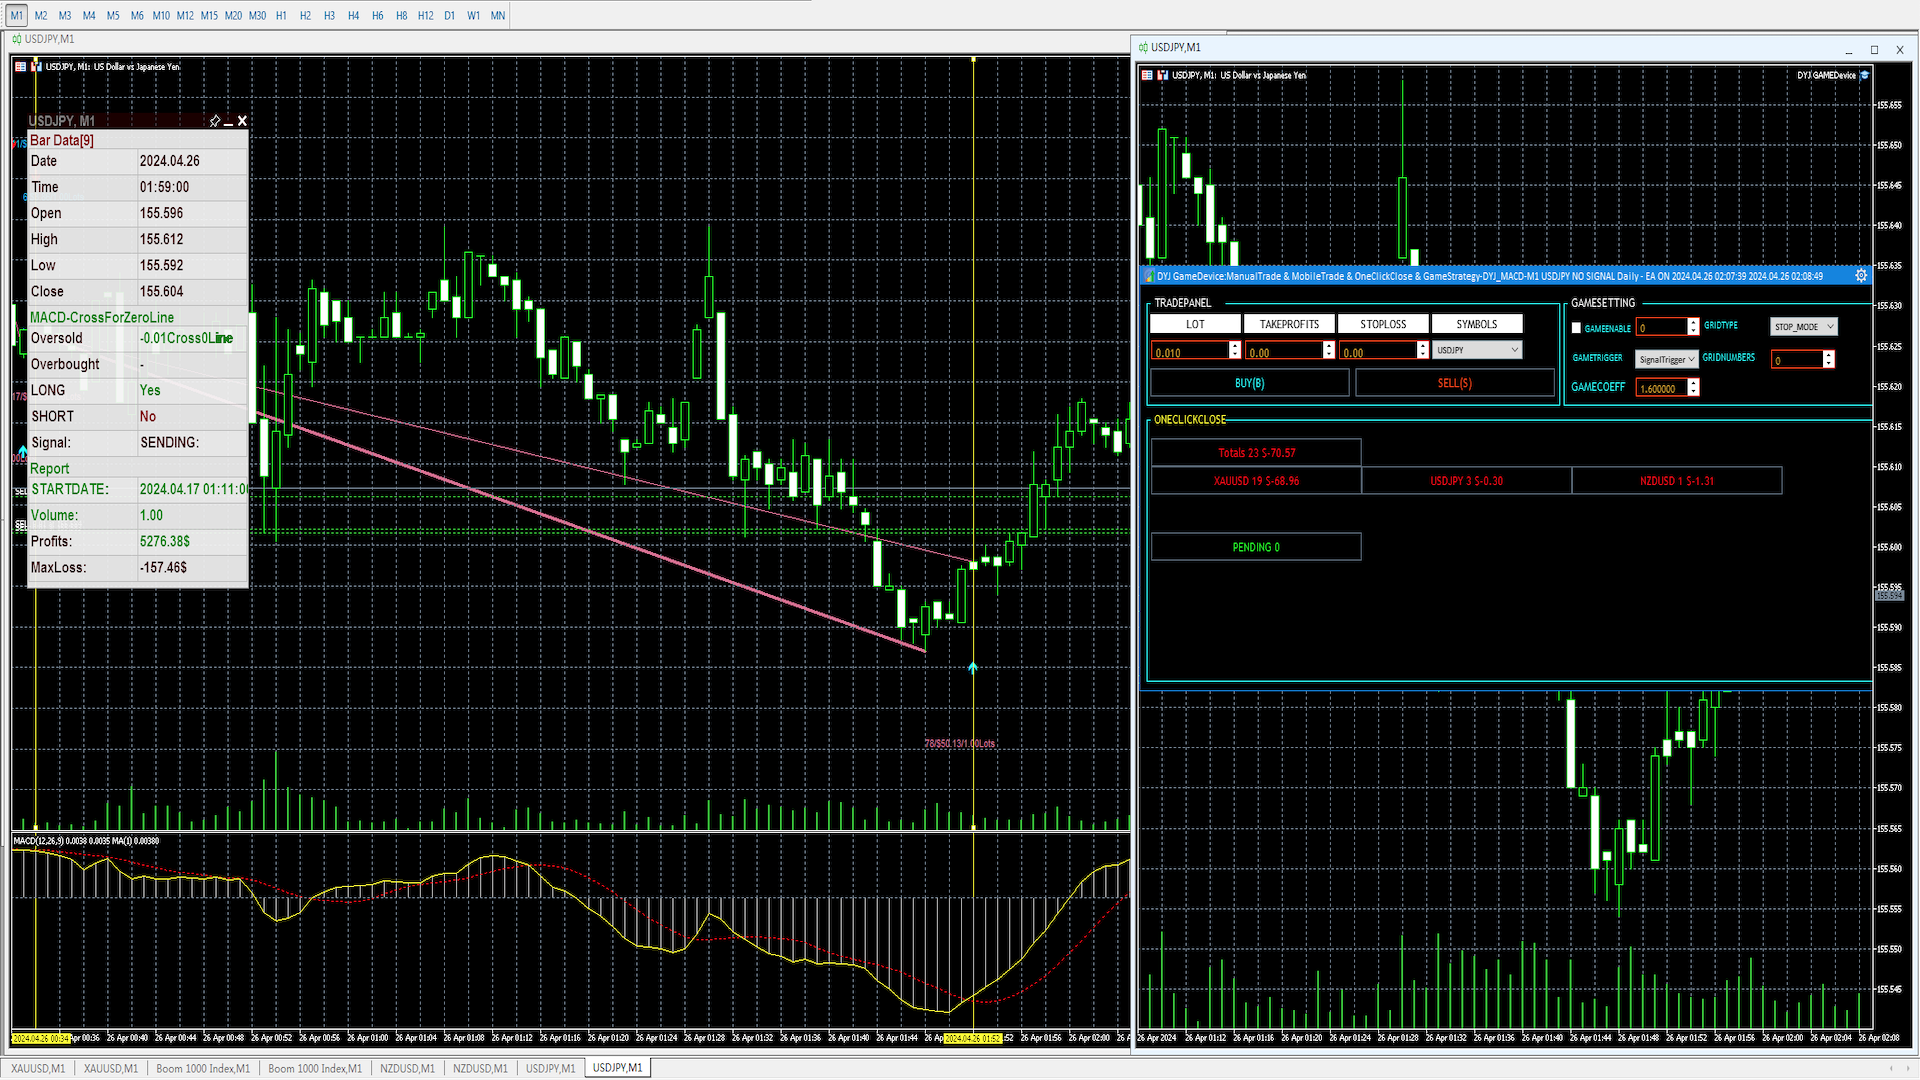
并且这些BUY与SELL信号被发送出去,您使用DYJ GameDevice跟单软件能接收这些信号,并实现自动开仓和关仓,并能使用博弈策略功能,使得亏损订单变为获利。

您能使用DYJ Mathematical model trader指标交易分析模型,显示指标真实交易开仓和关仓以及计算总体利润和最大浮动亏损!

此外, DYJ SignalSourceOfMACD指标还在入场点和出场点标记了彩色箭头,并且还根据这些位置实时统计总利润和最大浮亏2项判断交易概率的重要数据

Input

[General]

  • InpUseLanguage                          = English/Chinese | 英语/中文
  • signal_source_name="MACD"

[Indicator]

  • fast_ema_period=12 -- FAST PERIOS |MACD快线周期 
  • slow_ema_period=26 -- SLOW PERIOD | MACD慢线周期 
  • signal_period=9 -- SIGNAL PERIOD | MACD信号线周期 
  • price_field=PRICE_CLOSE -- PriceField | 价格域计算方法  
  • InpSignalMode                        = CrossForZeroLine -- Signal Mode | 信号模式
CrossForZeroLine = 0  -- 区域交叉模式 :  零轴之上死亡交叉是空头,零轴之下黄金交叉是多头 CrossOnly        = 1 --  交叉模式 : 仅仅交叉模式不区分零轴 ;金叉是多,死叉是空 InZearLineArea   = 2 --  在零线区域模式: MACD线穿越零轴是多空分界线,0轴之上多头,0轴之下空头。 建议 fast_ema_period=55,slow_ema_period=89,signal_period=1
  • InpSimulatedVolume                   = 1 -- Lots
    [EstimateSystem]
    • InpOnlyOppositeClosedLine            = false
    • InpIsDisplayChartText                = true
    • InpIsDisplayProfitsLine              = true
    • MaxProfitsTextHigh                   = 40
    • MaxProfitsTextLow                    = 20
    • UpLineClr            = DeepSkyBlue                // Arrow Up Color
    • DnLineClr            = PaleVioletRed              // Arrow Down Color
    • alertsMessage   = true
    • alertsSound     = true
    • alertsEmail     = false
    • alertsPush      = false
    • InpIsMultipleLinesTextForAlertsMessage = true


    推荐产品
    Технический индикатор Universal Oscillator является комбинацией торговых сигналов самых популярных и широко используемых осцилляторов. Индикатор представлен гистограммами, а также линиями fast и slow MA, что позволяет расширить список получаемых торговых рекомендаций и работать как по тренду, так и в боковом движении рынка. Таким образом, гистограммы позволяют определить момент пробоя ценовых значений и движение в новой фазе рынка, а линии указывают на зоны перекупленности и перепроданности.  Ос
    ChzhshchMACD
    Xiaoyu Huang
    缠中说禅 MACD 指标 四色双线MACD 显示柱子的面积的和 InpFastMA=12;               // Fast EMA period  InpSlowMA=26;               // Slow EMA period InpSignalMA=9;              // Signal SMA period InpAppliedPrice=PRICE_CLOSE;// Applied price  InpMaMethod=MODE_EMA;        //Ma_Method input bool               ChArea= false;               //chzhshch Area Fast EMA period 快线参数  Slow EMA period 慢线参数 Signal SMA period 信号线参数 应用价格 可选 缠论里面定义的趋势力度的对比,2段趋势进行对比,对比柱子面积的和 本指标计算了相应面积的和方便对比
    Schaff Trend Cycle STC
    Mohammad Taher Halimi Tabrizi
    The Schaff Trend Cycle indicator is the product of combining Slow Stochastics and the moving average convergence/divergence (MACD). The MACD has a reputation as a trend indicator, but it's also notorious for lagging due to its slow responsive signal line. The improved signal line gives the STC its relevance as an early warning sign to detect currency trends. this indicator is converted from Trading View code of STC Indicator - A Better MACD [SHK]
    Introducing the Consecutive Green/Red Candle Alert Indicator for MT5 - Your Trend Spotting Companion! Are you ready to take your trading to the next level? We present the Consecutive Green/Red Candle Alert Indicator, a powerful tool designed to help you spot trends and potential reversals with ease. Whether you're a new trader looking for clarity in the market or an experienced pro seeking additional confirmation, this indicator is your trusted companion. Key Features of the Consecutive Gre
    Implements a channel based on the moving average indicator with improved functionality. Moving average, moving average (English Moving average, MA) is a general name for a family of functions, the values ​​of which at each point of determining the level of some average value of the original function for the previous period. The channel moves up and down relative to the moving average by a specified number of points. This indicator is suitable for those who are interested in the classic calc
    Introduction The "Two Moving Average Crossover" indicator for MetaTrader 5 (MT5) is a technical analysis tool that displays two moving averages and notifies when the moving averages cross each other. The indicator calculates and plots two moving averages, one of which is faster and the other is slower. When the faster moving average crosses above the slower moving average, it is considered a bullish signal, indicating a potential trend reversal or the start of a new uptrend. Conversely, when th
    Stochastic R
    Antony Augustine
    Stochastic  Reversal  allows you to recognize reversals professionally. Stochastic Indicator: This technical indicator was developed by George Lane more than 50 years ago. The reason why this indicator survived for so many years is because it continues to show consistent signals even in these current times. The Stochastic indicator is a momentum indicator that shows you how strong or weak the current trend is. It helps you identify overbought and oversold market conditions within a trend.  Rules
    AW Prime Oscillator MT5
    AW Trading Software Limited
    两个振荡器的组合。第一个显示入场点,第二个显示当前趋势。该指标可以通过两种模式的箭头显示振荡信号,所有快速振荡信号或仅在当前趋势方向的信号。它具有多时间范围面板和三种类型的信号通知。 好处: 适合当日交易和倒卖交易 趋势过滤 简单而灵敏的设置 多时间框架面板 适合融入顾问。 适用于任何交易品种和任何时间范围 三种类型的通知 MT4版本 ->   这里 / 问题解决 ->   这里 指标策略 该指标由两个不同的振荡器组成: 慢趋势线(粗) - 当指标的最高水平从上到下交叉时,它是下降趋势的指标,当较低的水平水平(指标的低水平)从下到上交叉时,它是下降趋势的指标上升趋势。此外,在较低区域找到一条慢线表明当前趋势是下降趋势,反之亦然,在上方区域找到一条慢线表明当前趋势是上升趋势。这就是该指标确定当前市场趋势的方式。 快速入场线(细):识别从下到上与下线相交处的入场点,这是买入信号,在从上到下穿越上线时,这是卖出信号。除了振荡线之外,调整指标线也很重要,因为这会影响信号的数量和准确性。 本产品使用不同的振荡器来显示慢线和快线,每个振荡器必须单独调整。 为了便于操作,该指标在多时间框架面板中显
    Buy CTS scalping indicator, provide buying and selling signals, automatic channeling and sending signals to mobile phones Using technical analysis and price action methods and modern methods, CTS indicator can draw price channels and recognize price trends with high accuracy and issue entry and exit signals according to them. Traders can easily fluctuate using this indicator in different time frames and in different markets. With the CTS indicator, you can signal in different ways. This indicat
    其中一个数字序列称为“森林火灾序列”。它被公认为最美丽的新序列之一。它的主要特点是该序列避免了线性趋势,即使是最短的趋势。正是这一属性构成了该指标的基础。 在分析金融时间序列时,该指标试图拒绝所有可能的趋势选项。只有当他失败时,他才会认识到趋势的存在并给出适当的信号。这种方法可以让人们正确地确定新趋势开始的时刻。然而,误报也是可能的。为了减少它们的数量,该指标添加了一个额外的过滤器。当新柱打开时会生成信号。在任何情况下都不会发生重绘。 指标参数: Applied Price   - 应用价格常数; Period Main   - 指标的主要周期,其有效值在 5 - 60 之间; Period Additional   - 附加周期,此参数的有效值为 5 - 40; Signal Filter   - 附加信号滤波器,有效值 0 - 99; Alerts   - 启用后,指示器会在出现新信号时提醒您; Send Mail   - 允许指标向电子邮件发送消息; Push   - 允许您发送 Push 消息。
    The Jackson Auto Candlestick Pattern . It a powerful price action tool which auto detect and alert a hided powerful candlestick patterns . It came with few different chart skins. You can use this indicator alone to make profit, but it powerful when you combine it with trendlines, You can download The Jackson Auto Trendlines for free Link : UCRW695l9Wgg2ucnnf5DL5Vw  List of Candlestick Pattern it detect   1. Bullish & Bearish Engulfing's 2. Top and Bottom Tweezer 3. Bullish and Bearish Harams 4.
    GGP SuperTrend Alerts MT5
    Mohammadmahmood Pirayeh
    The GGP SuperTrend MT5  Indicator is a technical analysis tool that can assist investors in identifying market trends. The indicator is based on ATR and is very useful for capturing the direction of an asset’s momentum and is widely employed when looking at stocks, currencies, and commodities. It plots a line on the price chart, which acts as a dynamic level of support or resistance, helping traders and investors make informed decisions about entry and exit points. This indicator is MT5 conversi
    这种用于从无穷远衡量货币强弱的创新指标是长期交易的黄牛和交易者不可或缺的助手。 分析货币强弱的系统早已被世界领先的交易者所熟知并在市场上使用。 没有这种分析,任何套利交易都是不完整的。 我们的指标很容易确定基础货币相对于彼此的强弱。 它显示所有或当前货币对的折线图,允许即时分析和搜索最强的入口点。 该指标直观,允许您快速找到并切换到任何一对,具有可放置在地下室和主图表上的移动面板。 通知货币强度变化的计时器模式使交易者有机会在手机上收到通知。  使用货币功率计无穷大指示器的几种策略: 1. 使用货币强度的线性显示图表搜索交叉点作为新兴趋势的信号 2. 在趋势反转信号出现后,向强势货币方向反弹 3. 使用货币强度发散分析扭转当前趋势 4. 使用其他无限指标向强势货币方向交易 
    Real MACD for MT5
    Steven Van Ingelgem
    The built-in MACD does not properly display all the different aspects of a real MACD. These are: The difference between 2 moving averages A moving average of (1) A histogram of the difference between (1) and (2) With this indicator you can also tweak it as much as you want: Fast Period (default: 12) Slow Period (default: 26) Signal Period (default: 9) Fast MA type (default: exponential) Slow MA type (default: exponential) Signal MA type (default: exponential) Fast MA applied on (default: close)
    US30NinjaMT5
    Satyaseelan Shankarananda Moodley
    US30 Ninja is a 5 minute scalping indicator that will let know you when there is a trade set up (buy or sell). Once the indicator gives the trade direction, you can open a trade and use a 30 pip stop loss and a 30 pip to 50 pip take profit. Please trade at own own risk. This indicator has been created solely for the US30 market and may not yield positive results on any other pair. 
    You can avoid constant monitoring of computer screen waiting for the DeMarker signal while receiving push notifications to a mobile terminal or a sound alert on the screen about all required events, by using this indicator - DeMarker Alerts. In fact, it is the replacement of the standard indicator with which you will never miss the oscillator signals. If you don't know the benefits of DeMarker or how to use it, please read here . If you need signals of a more popular RSI indicator, use RSI Alert
    Volality Index Scalper
    Lesedi Oliver Seilane
    5 (1)
    Volality Index scalper indicator  Meant for Volality pairs such as Volality 10, 25, 50, 75 and 100 The indicator works on all timeframes from the 1 minute to the monthly timeframe the indicator is non repaint the indicator has 3 entry settings 1 color change on zero cross 2 color change on slope change 3 color change on signal line cross Orange line is your sell signal Blue line is your buy signal.
    Wavetrend for MT5
    Antonello Belgrano
    Here is a version for MetaTrader 5 of the famous Wave Trend indicator. Introducing the Wave Trend Oscillator Indicator for MT5 We are excited to present our Wave Trend Oscillator Indicator, exclusively designed for MetaTrader 5. This advanced tool is a must-have for traders who seek precision and efficiency in their trading journey. Our oscillator is built on the principles of wave trend analysis, capturing the ebb and flow of market trends with unparalleled accuracy. It helps traders identify p
    Multi MACD MT5
    Vladimir Pokora
    This tool monitors MACD indicators on all time frames in the selected markets. Displays a table with signals to open a BUY trade (green) or SELL trade (red). You can set the conditions for the signal. You can easily add or delete market names / symbols. If the conditions for opening a trade on multiple time frames are met, you can be notified by e-mail or phone message (according to the settings in MT5 menu Tools - Options…) You can also set the conditions for sending notifications. The list of
    Predictor PRO MT5
    Evgenii Aksenov
    5 (1)
    来自无限的新一代渐进指示器. Predictor PRO使用自己的进入和退出计算策略。 指标没有重绘信号! 这对真实交易非常重要。 该指标可用于任何货币对,金属,加密货币或指数。 H1图表的最佳时间。 Predictor PRO显示买入/卖出入口点和收盘出口点。 以点数计算利润有助于为选定的历史周期选择最佳设置。 预测器PRO指标可以提供自己的虚拟交易关闭点或根据指定的SL和TP参数修复它们。 购买后与我联系,以获得优化设置的文件,邀请VIP组 指标的优点 无需重绘的输入信号 预测Pro适用于任何资产 它既适用于趋势,也适用于平面 每个信号都有一个特定的入口和出口点,计算交易的结果 所有交易的总体结果有助于快速调整指标的参数到每个符号 电话上的通知和弹出的警报窗口将提醒您出现的信号 Predictor PRO适用于专家和初学者,并与其他无限指标和策略兼容 INFINITY:  https://www.mql5.com/en/users/neurofx/seller 指标参数 Calculation range (Days) -计算范围(天)。 在图表上安装指标之前
    Ichimoku Kinko Hyo 的目的-建立在几乎每一个交易市场被成功应用的趋势交易系统。它在许多方面都是独一无二的,但它的主要优势是其使用多个数据点,为交易者提供一个更深入,更全面的价格走势视角。这种深入视角,事实上,Ichimoku 是一款非常优秀的可视系统,能够令交易者从那些高概率中 "一目了然" 地快速识别和过滤低概率的交易设置。 本指标基于标准的 MT5 Ichimoku Kinko Hyo 指标,但我已经将它设计为跟踪其它数值 (RSI, CCI, Momentum, TEMA, ...),且替换至子窗口。 您可以使用它作为其它策略的确认,或者如果您是一个专门的 Ichimoku 用户,您可以将它作为您的 Ichimoku 图表一个梦幻般的辅助。 这是免费版本, 您只能在子窗口里使用 RSI-Ichimoku/原始 Ichimoku。 参看 专业 和 专业多时间帧 版本。
    Noize Absorption Index
    Ekaterina Saltykova
    Noize Absorption Index - is the manual trading system that measures the difference of pressure between bears forces and bulls forces. Green line - is a noize free index that showing curent situation. Zero value of index shows totally choppy/flat market.Values above zero level shows how powerfull bullish wave is and values below zero measures bearish forces.Up arrow appears on bearish market when it's ready to reverse, dn arrow appears on weak bullish market, as a result of reverse expectation.
    FXC iMACD-DivergencE MT5 Indicator This is an advanced MACD indicator that finds trend-turn divergences on the current symbol. The indicator detects divergence between the MACD and the price movements as a strong trend-turn pattern. Main features: Advanced divergence settings Price based on Close, Open or High/Low prices Give Buy/Sell open signals PUSH notifications E-mail sending Pop-up alert Customizeable Information panel Input parameters: MACD Fast-EMA: The Fast-EMA variable of the MACD
    The Hull  Butterfly  Oscillator (HBO) is an oscillator constructed from the difference between a regular  Hull Moving Average  (  HMA  ) and another with coefficients flipped horizontally . Levels are obtained from cumulative means of the absolute value of the oscillator. These are used to return dots indicating potential reversal points . This indicator draw line in separate window, plus blue dot (for buy signal) when hull oscillator is peak and red when sell signal. It  also includes integrate
    Rainbow EA MT5
    Jamal El Alama
    Description : Rainbow EA MT5 is a simple Expert advisor based on   Rainbow MT5 indicator witch is based on Moving average with period 34. The indicator is incorporated in the EA, therefore, it is not required for the EA to operate, but if you wish, you can download it from   my product page . The Expert Advisor settings are as follows : Suitable for Timeframes up to H1 The parameters below can be set according to your trading rules. StopLoss ( Stop Loss in pips) TakeProfit ( Take Profit in pi
    Renko Gold
    Ignacio Agustin Mene Franco
    Renko Gold! clearly indicates the floors and ceilings where it goes from 4 lines, the line below that marks the floor in green confirming with the thinnest line clarifies the purchase entry, the same is for sale, the top line marks the ceiling and the thinnest red line marks the sale, This indicator works for all temporalities! For Forex and Synthetic Indices markets! It also works for crypto markets! Good profit! World Investor.
    The Best RSI MT5
    Szymon Palczynski
    The relative strength index (RSI) is a popular momentum oscillator introduced in 1978. The RSI provides technical traders with signals about bullish and bearish price momentum, and it is often plotted beneath the graph of an asset's price. An asset is usually considered overbought when the RSI is above 70 and oversold when it is below 30. The Best RSI uses the input signal from the RSI indicator. Unlock the potential of the markets with The Best RSI, the fully automated and ready-to-use trading
    PipFinite Trend PRO MT5
    Karlo Wilson Vendiola
    4.87 (666)
    Breakthrough Solution For Trend Trading And Filtering With All Important Features Built Inside One Tool! Trend PRO's smart algorithm detects the trend, filters out market noise and gives entry signals with exit levels. The new features with enhanced rules for statistical calculation improved the overall performance of this indicator. Important Information Revealed Maximize the potential of Trend Pro, please visit www.mql5.com/en/blogs/post/713938 The Powerful Expert Advisor Version Automa
    Historical Memory B150
    Marat Sultanov
    5 (2)
    The B150 model is a fully revised version of the Historical Memory indicator with a significantly improved algorithm. It also features a graphical interface what makes working with this perfect tool quick and convenient. Indicator-forecaster. Very useful as an assistant, acts as a key point to forecast the future price movement. The forecast is made using the method of searching the most similar part in the history (patter). The indicator is drawn as a line that shows the result of change of the
    Gecko EA MT5
    Profalgo Limited
    5 (1)
    NEW PROMO: Only a few copies copies available at 349$ Next price: 449$ Make sure to check out our " Ultimate EA combo package " in our   promo blog ! Gecko runs a simple, yet very effective, proven strategy.  It looks for important recent support and resistance levels and will trade the breakouts.  This is a "real" trading system, which means it will use a SL to protect the account.  It also means it will not use any dangerous techniques like martingale, grid or averaging down. The EA shows its
    该产品的买家也购买
    Atomic Analyst MT5
    Issam Kassas
    4.79 (19)
    首先值得强调的是,该交易指标是非重绘、非延迟的指标,这使其成为手动和机器人交易的理想选择。 用户手册:设置、输入和策略。 Atomic Analyst是一种PA价格行动指标,利用价格的力量和动量来寻找市场上更好的机会。配备了高级过滤器,可帮助去除噪音和假信号,并提高交易潜力。使用多层复杂的指标,Atomic Analyst扫描图表,并将复杂的数学计算转化为任何初学者都能理解并用来做出一致交易决策的简单信号和颜色。 “Atomic Analyst”是专为新手和经验丰富的交易者量身定制的综合交易解决方案。它将高级指标和一流功能融合为一体的交易策略,使其成为所有类型交易者的多功能选择。 日内交易和剥头皮策略:专为快速准确的日内交易和短期交易而设计。 日内和摆动交易策略:可用作追求价格大幅波动的日内和摆动交易者的可靠工具。 多货币和市场:凭借其可靠的精度,在不同的工具和市场上运作。 多个时间框架:可在多个时间框架上使用,性能良好。 稳定性:所有指标均不重绘、不重绘和不滞后,确保可靠的信号。 信号清晰度:提供箭头信号,用于清晰的入场和出场点。 实时警报:通过交易入场、SL和TP警报通知交
    Atbot
    Zaha Feiz
    4.96 (28)
    AtBot: 它是如何工作的以及如何使用它 ### 它是如何工作的 “AtBot”指标用于MT5平台,通过结合技术分析工具生成买入和卖出信号。它集成了简单移动平均线(SMA)、指数移动平均线(EMA)和平均真实波幅(ATR)指标,以识别交易机会。此外,它还可以利用Heikin Ashi蜡烛来增强信号的准确性。 购买后留下评论,您将获得特别的奖励礼物。 ### 主要特点: - 不重绘: 信号在绘制后不会改变。 - 不变动: 信号保持一致,不会被更改。 - 无延迟: 提供及时的信号,没有延迟。 - 多种时间框架: 可在任何时间框架上使用,以适应您的交易策略。 ### 操作步骤: #### 输入和设置: - firstkey (TrendValue): 调整趋势检测的灵敏度。 - Secondkey (SignalValue): 定义买入/卖出信号生成的灵敏度。 - masterkey (ExitValue): 控制信号的退出策略。 - h: 切换是否根据Heikin Ashi蜡烛生成信号(真/假)。 - notifications: 启用或禁用信号提醒。 #### ATR计算: ATR测
    首先,值得强调的是,这个交易系统是一个非重绘、非重画和非滞后的指标,这使得它非常适合手动和机器人交易。 在线课程,手册和下载预设。 “智能趋势交易系统 MT5”是专为新手和经验丰富的交易者量身定制的综合交易解决方案。它结合了超过 10 个优质指标,具有 7 多个强大的交易策略,使其成为适用于各种市场条件的多功能选择。 趋势跟随策略:提供精确的入场和止损管理,以有效地跟随趋势。 反转策略:识别潜在的趋势反转,使交易者能够利用区域市场的机会。 剃头策略:专为快速准确的日内交易和短期交易而设计。 稳定性:所有指标都不会重绘、不会重画和不会滞后,确保可靠的信号。 定制:支持自定义策略,以满足个人交易偏好。超过 7 种策略和组合可帮助您找到最佳策略。 信号清晰度:提供箭头信号,以指示清晰的入场和退出点。 实时警报:通过交易进出警报使交易者保持了解。 深入分析:提供更高时间框架的趋势分析和实时交易监控。 自适应颜色编码:利用蜡烛颜色编码来显示成交量、趋势和反转蜡烛信号。通过蜡烛颜色分析市场方向。 “智能趋势交易系统 MT5”赋予交易者必要的工具,以便在各种市场条件下做出明智和战略性的交易决策。无论
    Gold Stuff mt5
    Vasiliy Strukov
    4.9 (185)
    Gold Stuff mt5 是专为黄金设计的趋势指标,也可用于任何金融工具。 该指标不会重绘,也不会滞后。 推荐时间框架 H1。 购买后立即联系我以获得设置和个人奖励!   你可以在我的个人资料中找到它。   重要! 购买后立即与我联系,以获得说明和奖金!   您可以免费收到我们的强力支持和趋势扫描指标的副本,请私信。大部头书!   设置 绘制箭头 - 打开关闭。 在图表上绘制箭头。 警报 - 打开关闭声音警报。 电子邮件通知 - 打开关闭。 电子邮件通知。 Puch-notification - 打开关闭。 推送通知。 接下来,调整色域。 Gold Stuff mt5 是专为黄金设计的趋势指标,也可用于任何金融工具。 该指标不会重绘,也不会滞后。 推荐时间框架 H1。 购买后立即联系我以获得设置和个人奖励!   设置 绘制箭头 - 打开关闭。 在图表上绘制箭头。 警报 - 打开关闭声音警报。 电子邮件通知 - 打开关闭。 电子邮件通知。 Puch-notification - 打开关闭。 推送通知。 接下来,调整色域。
    TPSpro RFI Levels MT5
    Roman Podpora
    4.67 (9)
    Reversal First Impulse levels (RFI)      INSTRUCTIONS        RUS       -       ENG              R ecommended to use with an indicator   -   TPSpro  TREND PRO -  Version MT4                 A key element in trading is zones or levels from which decisions to buy or sell a trading instrument are made. Despite attempts by major players to conceal their presence in the market, they inevitably leave traces. Our task was to learn how to identify these traces and interpret them correctly. Main functi
    Entry Points Pro for MT5
    Yury Orlov
    4.56 (163)
    这款指标用于 MT5,可提供准确的入场交易信号,且无重绘。 它可应用在任何金融资产:外汇、加密货币、贵金属、股票、指数。 它将提供极其精准的评估,并告诉您何时开仓和平仓的最佳时机。 观看 视频 (6:22),其中包含一个仅处理单一信号的示例,该信号即可值回指标购价! 大多数交易者在 Entry Points Pro 指标的帮助下,在第一个交易周内即改善了他们的交易结果。 订阅我们的 Telegram 群 ! Entry Points Pro 指标的益处。 入场信号无重绘 如果信号出现,并得到确认,则它不会再消失;不像是重绘指标,它会导致重大的财产损失,因为它们可以在显示信号后再将其删除。 无差错开仓 指标算法可令您找到入场交易(买入或卖出资产)的理想时机,从而提高每位交易者的成功率。 Entry Points Pro 可操作任何资产 它允许您在 MT5 平台上交易任何经纪商的加密货币、股票、贵金属、指数、大宗商品和货币。 提供任何方向的信号 Entry Points Pro 指标提供针对任意价格走势的入场交易信号 - 上涨、下跌或横盘(横向)。
    首先,值得强调的是,这个交易工具是非重绘、非重画和非滞后的指标,非常适合专业交易。 在线课程,用户手册和演示。 智能价格行动概念指标是一个非常强大的工具,既适用于新手,也适用于经验丰富的交易者。它将超过20个有用的指标合并到一个指标中,结合了高级交易思想,如内圈交易员分析和智能资金概念交易策略。该指标侧重于智能资金概念,提供有关大型机构交易方式的见解,帮助预测它们的动向。 它在流动性分析方面尤其擅长,有助于理解机构的交易方式。它擅长预测市场趋势,并仔细分析价格波动。通过将您的交易与机构策略对齐,您可以更准确地预测市场走向。该指标多才多艺,擅长分析市场结构,识别重要的订单区块,并识别各种模式。 它擅长识别BOS和CHoCH等模式,理解动量的转变,并突出显示供需强劲的关键区域。它还擅长发现强大的不平衡,并分析价格创造更高高点或更低低点的模式。如果您使用斐波那契回撤工具,该指标可以满足您的需求。它还可以识别相等的高点和低点,分析不同的时间框架,并通过仪表板显示数据。 对于使用更高级策略的交易者,该指标提供了工具,如公平价值差指标和优惠和折扣区域的识别。它特别关注高时间框架订单
    Quantum Trend Sniper
    Bogdan Ion Puscasu
    4.92 (48)
    介绍   量子趋势狙击指标 ,突破性的 MQL5 指标,正在改变您识别和交易趋势反转的方式!由拥有超过13年交易经验的资深交易员团队开发,     量子趋势狙击指标   旨在通过其创新的方式以极高的准确度识别趋势反转,将您的交易之旅推向新的高度。 ***购买量子趋势狙击指标,即可免费获得量子突破指标!*** 当量子突破指标识别出趋势反转时,它会向您发出警报和信号箭头,并建议您三个止盈水平。 它既适合新手交易者,也适合专业交易者。 量子 EA 通道:       点击这里 MT4版本:       点击这里 建议: 时间范围: 所有时间范围。为了获得最佳结果,我们建议在 M15、M30 和 H1 时间范围内使用它。 货币对:欧元兑美元、英镑兑美元、澳元兑美元、欧元兑英镑、, EURAUD,  XAUUSD 账户类型:ECN、Raw 或 Razor,点差极低 经纪时间:任意 经纪商:IC Markets、Pepperstone with Raw 和 Razor 的点差最低 建议止损:50 点 建议止盈水平:20 点、50 点和
    Trend Screener Pro MT5
    STE S.S.COMPANY
    4.88 (67)
    使用趋势筛选指标释放趋势交易的力量:由模糊逻辑和多货币系统提供支持的终极趋势交易解决方案! 使用趋势筛选器(由模糊逻辑提供支持的革命性趋势指标)提升您的趋势交易。 它是一个强大的趋势跟踪指标,结合了超过 13 种高级工具和功能以及 3 种交易策略,使其成为使您的 Metatrader 成为趋势分析器的多功能选择。 限时优惠:趋势筛选指标终身仅需 50 美元。 ( 原价 125$ ) (优惠延长) 体验趋势筛选器 100% 无需重新绘制的准确性,确保您的交易决策不受过去价格变化的影响。 释放多时间框架和多货币功能的多功能性,使您能够以无与伦比的信心在外汇、商品、加密货币和指数领域进行交易。 利用 Trend Screener 的综合策略套件增强您的交易: - 趋势跟踪策略和趋势延续策略 :趋势筛选器的趋势跟踪策略提供清晰的趋势延续信号,让您有效捕捉趋势走势并管理风险。 - 反转策略和早期入场点策略 :趋势筛选器的反转策略可检测市场方向的潜在变化,使您能够预测趋势反转并利用疲弱的市场趋势。通过早期入场点,您可以在潜在的趋势变化之前定位自己 获取可观的利润。 - 倒卖策略: 趋势筛选器的倒卖
    FX Power MT5 NG
    Daniel Stein
    5 (6)
    通过 mql5 和 Telegram 上 的晨间简报获取每日市场更新,包括详细信息和屏幕截图 ! FX Power MT5 NG 是我们长期以来非常受欢迎的货币强度计算器 FX Power 的下一代产品。 这款下一代强度计算器能提供什么?您所喜爱的原版 FX Power 的所有功能 附加功能 黄金/XAU 强度分析 更精确的计算结果 可单独配置的分析周期 可自定义计算限制,以获得更好的性能 为希望查看更多信息的用户提供特殊的多实例设置 无尽的图形设置,可在每个图表中设置您最喜欢的颜色 无数的通知选项,让您再也不会错过任何重要信息 采用 Windows 11 和 macOS 风格的全新圆角设计 神奇的移动指标面板 FX Power 主要功能 所有主要货币的完整强势历史 所有时间框架内的货币强弱历史 所有经纪商和图表的计算结果完全相同 100% 可靠的实时计算 -> 无重绘 可通过下拉列表选择分析时段 通过自定义模式单独配置分析时段 可在一个图表中使用多个实例 可移动 FX Power 显示屏(通过拖放) 适用于高分辨率 QHD、UHD 和 4K 显示器 自动终端配置 针对平板电脑
    FX Volume MT5
    Daniel Stein
    4.94 (17)
    通过 mql5 和 Telegram 上 的 " 晨间简报 "获取每日市场更新,包括详细信息和屏幕截图 ! 外汇交易量(FX Volume)是第一个也是唯一一个从经纪商角度真正洞察市场情绪的交易量指标。 直接在您的图表上看到这些信息是真正改变游戏规则和突破性的交易解决方案。 受益于独特的市场数据洞察,如 比率(Ratios )显示货币多头和空头头寸的比率(百分比 比率变化 显示所选时间段内的多头比率及其百分比变化 总交易量 显示货币的总交易量(多头和空头),以手为单位 多头 交易量显示货币所有多头头寸的交易量 空头 交易量显示所有货币空头头寸的交易量 净多头 显示净多头交易量,即所有多头头寸减去所有空头头寸(以手为单位)。 净多头百分比 显示货币净多头交易量的变化 请阅读我们的基本教程 -> "如何使用外汇交易量进行交易 " 获取更多信息,如常见问题、交易技巧和教程视频,请访问我们的 外汇交易量公共信息频道 请 安装并运行 SI Connect 以建立与我们数据中心的持续连接 背景信息 我们都知道,外汇是一个分散的市场。这就是为什么我们必须打破常规思维,开发一个独
    IX Power MT5
    Daniel Stein
    4.17 (6)
    IX Power 终于将 FX Power 的无与伦比的精确性带到了非外汇交易符号中。 它能准确判断您喜爱的指数、股票、商品、ETF 甚至加密货币的短期、中期和长期趋势强度。 您可以 分析 终端提供的 一切 。试试吧,体验一下您在交易时如何把握 时机 。 IX Power 主要功能 100% 精确的非重绘计算结果 - 适用于您终端中的所有交易符号 下拉式选择预配置以及可单独配置的强度分析周期 通过电子邮件、消息和手机通知的无数种通知选项 可访问的 EA 请求缓冲区 可自定义计算限制,以获得更好的性能 为希望查看更多信息的用户提供特殊的多实例设置 无尽的图形设置,让您在每个图表中都能找到最喜欢的颜色 采用 Windows 11 和 macOS 风格的圆角新面板设计 神奇的移动指标面板,可在子窗口和主图表之间无缝移动 适用于高分辨率 QHD、UHD 和 4K 显示器,并针对平板电脑和触摸屏进行了优化 IX Power 参数 最重要的参数不言自明,但我们很快会在另一篇文章中为您提供所有 IX Power 参数的完整说明。 使用别名 "参数可为技术交易符号
    XQ Indicator MetaTrader 5
    Marzena Maria Szmit
    3.5 (2)
    Step into the realm of Forex trading with confidence and precision using XQ, a cutting-edge Forex indicator designed to elevate your trading game to unprecedented heights. Whether you're a seasoned trader or just stepping into the world of currency exchange, XQ Forex Indicator empowers you with the insights and signals needed to make informed trading decisions. The signal conditions are a combination of three indicators, and XQ Forex Indicator only display  medium and long-term trends . The ind
    Easy Buy Sell Signal Alert
    Franck Martin
    4.86 (7)
    Easy By Sell is a market indicator for opening and closing positions. It becomes easy to track market entries with alerts. It indicates trend reversal points when a price reaches extreme values ​​and the most favorable time to enter the market. it is as effective as a Fibonacci to find a level but it uses different tools such as an algorithm based on ATR indicators and Stochastic Oscillator. You can modify these two parameters as you wish to adapt the settings to the desired period. My othe
    该仪表盘显示所选符号的最新可用谐波形态,因此您可以节省时间并提高效率 /  MT4 版本 。 免费指标:  Basic Harmonic Pattern 指标列 Symbol:   显示所选符号 Trend:     看涨或看跌 Pattern:    形态类型(Gartley、蝴蝶、蝙蝠、螃蟹、鲨鱼、Cypher 或 ABCD) Entry:     入口价格 SL: 止损价 TP1: 第一止盈价 TP2: 第二次获利价格 TP3: 第三次获利价格 Current price:    当前价格 Age (in bars):   最后绘制的模式的年龄 主要输入 Symbols :   从 "28 种主要货币对 "或 "选定符号 "中选择。 Selected Symbols :   希望监控的符号,用逗号分隔("EURUSD,GBPUSD,XAUUSD")。如果您的经纪商为货币对设置了后缀或前缀,您必须在以下两个参数中添加(货币对前缀或货币对后缀)。 Max Iteration:   调整模式的最大迭代次数(如果该值越小,则模式越少,性能越快;如果该值越大,则模式越多,性能
    TrendMaestro5
    Stefano Frisetti
    note: this indicator is for METATRADER4, if you want the version for METATRADER5 this is the link:  https://www.mql5.com/it/market/product/108106 TRENDMAESTRO ver 2.4 TRENDMAESTRO recognizes a new TREND in the bud, he never makes mistakes. The certainty of identifying a new TREND is priceless. DESCRIPTION TRENDMAESTRO identifies a new TREND in the bud, this indicator examines the volatility, volumes and momentum to identify the moment in which there is an explosion of one or more of these data a
    Golden Spikes Premium
    Kwaku Bondzie Ghartey
    Golden Spikes Detector Overview: The Golden Spikes Premium is a groundbreaking trading indicator meticulously crafted for the Boom and Crash indices on the Deriv market. Tailored to meet the needs of discerning traders, this powerful tool operates exclusively on the one-minute timeframe, providing timely and precise signals to maximize your trading potential. The Golden Spikes Detector stands out in its ability to deliver accurate signals, ensuring that you capitalize on market opportunities wit
    Gartley Hunter Multi
    Siarhei Vashchylka
    5 (8)
    Gartley Hunter Multi - An indicator for searching for harmonic patterns simultaneously on dozens of trading instruments and on all possible timeframes. Manual (Be sure to read before purchasing) | Version for MT4 Advantages 1. Patterns: Gartley, Butterfly, Shark, Crab. Bat, Alternate Bat, Deep Crab, Cypher 2. Simultaneous search for patterns on dozens of trading instruments and on all possible timeframes 3. Search for patterns of all possible sizes. From the smallest to the largest 4. A
    PZ Support Resistance MT5
    PZ TRADING SLU
    4.17 (6)
    厌倦了绘制支撑线和阻力线? 支撑阻力 是一个多时间指标,可以自动检测并绘制图表中的支撑线和阻力线,并具有非常有趣的变化:随着时间的推移测试价格水平及其重要性的提高,线变得越来越粗。 [ 安装指南 | 更新指南 | 故障排除 | 常见问题 | 所有产品 ] 一夜之间增强您的技术分析 无需浏览图表即可检测重要的价格水平 一目了然地识别所有价格水平的相对优势 每次交易最多可节省半小时的绘图线 指标显示所有价格水平的期限 指示器不重涂 过去和现在的价格水平因接近程度而崩溃,并根据当前的市场行为进行了调整。在动作发生的地方绘制了线条,而不一定在峰值处绘制了线条。 价格水平随着时间的推移而被拒绝,变得越来越暗 定期清除不重要的价格水平以避免噪音 可自定义的时间范围选择和崩溃因子 它实现了电子邮件/声音/推送警报的突破 输入参数 指标设置:指标将从当前时间段读取价格,但您可以选择另一个。例如,您可以在H4图表中显示D1支撑线和阻力线。您还可以使用 价格水平密度 参数选择在图表上显示多少价格水平。 颜色设置:根据重要性输入所需的支撑线和阻力线颜色。 标签设置:(可选)可以在指示器
    Matrix Arrow Indicator MT5
    Juvenille Emperor Limited
    5 (14)
    矩阵箭头指标 MT5   是一种独特的 10 合 1 趋势,遵循   100% 非重绘多时间框架指标 ,可用于所有符号/工具: 外汇 、 商品 、 加密货币 、 指数 、 股票 。 Matrix Arrow Indicator MT5 将在其早期阶段确定当前趋势,从多达 10 个标准指标中收集信息和数据,它们是: 平均定向运动指数 (ADX) 商品渠道指数 (CCI) 经典 Heiken Ashi 蜡烛 移动平均线 移动平均收敛散度 (MACD) 相对活力指数 (RVI) 相对强弱指数 (RSI) 抛物线SAR 随机振荡器 威廉姆斯的百分比范围 当所有指标给出有效的买入或卖出信号时,相应的箭头将打印在图表上,在下一根蜡烛/柱线开盘时,指示强劲的上升趋势/下降趋势。用户可以选择使用哪些指标,并可以单独调整每个指标的参数。 Matrix Arrow Indicator MT5 仅从选定的指标中收集信息,并仅根据其数据打印箭头。   Matrix Arrow Indicator MT5   还可以为所有新信号发送终端、推送通知或电子邮件警报。无论您是黄牛、日内交易者还是波段交易者, Mat
    Volume by Price MT5
    Brian Collard
    3.6 (5)
    The Volumebyprice.com Indicator for MetaTrader 5 features Volume Profile and Market Profile TPO (Time Price Opportunity). Volume and TPO histogram bar and line charts. Volume Footprint charts. TPO letter and block marker collapsed and split structure charts. Static, dynamic and flexible range segmentation and compositing methods with relative and absolute visualizations. Session hours filtering and segment concatenation with Market Watch and custom user specifications. Graphical layering, posit
    ICT, SMC, SMART MONEY CONCEPTS, SMART MONEY, Smart Money Concept, Support and Resistance, Trend Analysis, Price Action, Market Structure, Order Blocks, BOS/CHoCH,   Breaker Blocks ,  Momentum Shift,   Supply&Demand Zone/Order Blocks , Strong Imbalance,   HH/LL/HL/LH,    Fair Value Gap, FVG,  Premium  &   Discount   Zones, Fibonacci Retracement, OTE, Buy Side Liquidity, Sell Side Liquidity, BSL/SSL Taken, Equal Highs & Lows, MTF Dashboard, Multiple Time Frame, BigBar, HTF OB, HTF Market Structure
    Volatility Trend System - a trading system that gives signals for entries. The volatility system gives linear and point signals in the direction of the trend, as well as signals to exit it, without redrawing and delays. The trend indicator monitors the direction of the medium-term trend, shows the direction and its change. The signal indicator is based on changes in volatility and shows market entries. The indicator is equipped with several types of alerts. Can be applied to various trading in
    Blahtech Supply Demand MT5
    Blahtech Limited
    4.54 (13)
    Was: $299  Now: $99   Supply Demand uses previous price action to identify potential imbalances between buyers and sellers. The key is to identify the better odds zones, not just the untouched ones. Blahtech Supply Demand indicator delivers functionality previously unavailable on any trading platform. This 4-in-1 indicator not only highlights the higher probability zones using a multi-criteria strength engine, but also combines it with multi-timeframe trend analysis, previously confirmed swings
    Gold TMAF MTF - 这是一个最佳股票技术指标。该指标算法分析资产的价格走势,并反映波动性和潜在进入区域。 最佳指标信号: - 卖出 = TMA2 的红色上边界高于 TMA1 的红色上边界 + 上方的红色分形指标 + 同方向的黄色 SR 信号箭头。 - 买入 = TMA2 的蓝色下边界低于 TMA1 的蓝色下边界 + 下方的蓝色分形指标 + 同方向的水蓝色 SR 信号箭头。 该指标的优点 1. 指标产生的信号精确度高。 2. 确认的箭头信号不会重绘,分形信号可以重绘半个周期。 3. 您可以在任何经纪商的 MetaTrader 5 交易平台上进行交易。 4. 您可以交易任何资产(货币、金属、加密货币、股票、指数等)。 5. 最好在 M30-H1 时间框架(中期交易)上进行交易。 6. 在指标设置中可更改个别参数(TF、颜色等),以便每位交易者都能轻松定制适合自己的指标。 7. 该指标既可作为交易系统的主要补充,也可作为独立的交易系统使用。 注意:交易的入市准确性和盈利能力仅取决于交易者的技能。任何指标都只是交易者的助手,而非行动指南。
    Automated Trendlines MT5
    Georgios Kalomoiropoulos
    趋势线是外汇交易中最重要的技术分析工具。不幸的是,大多数交易者没有正确绘制它们。自动趋势线指标是专业交易者的专业工具,可帮助您可视化市场的趋势运动。 有两种类型的趋势线看涨趋势线和看跌趋势线。 在上升趋势中,外汇趋势线是通过价格变动的最低摆动点绘制的。 连接至少两个“最低点”将创建一条趋势线。 在下跌趋势中,趋势线是通过价格走势的最高摆动点绘制的。 连接至少两个“最高点”将创建一条趋势线。 趋势线何时突破? 当看跌蜡烛收于看涨​​趋势线下方并且蜡烛的高点在趋势线上方时,看涨趋势线会被打破。 当看涨蜡烛收于看跌趋势线上方并且蜡烛的低点低于趋势线时,看跌趋势线会被打破。 趋势线何时删除? 当一根完整的蜡烛在看涨趋势线下方形成时,看涨趋势线将被删除。 当完整的蜡烛在看跌趋势线上方形成时,看跌趋势线将被删除。 您可以从输入参数更改看涨和看跌趋势线的颜色和宽度。
    TPA True Price Action indicator reveals the true price action of the market makers through 100% non-repainting signals strictly at the close of a candle! TPA shows entries and re-entries, every time the bulls are definitely stronger than the bears and vice versa. Not to confuse with red/green candles. The shift of power gets confirmed at the earliest stage and is ONE exit strategy of several. There are available now two free parts of the TPA User Guide for our customers. The first "The Basics"
    The 1 2 3 Pattern Scanner MT5
    Reza Aghajanpour
    5 (16)
    ** All Symbols x All Timeframes scan just by pressing scanner button ** ***Contact me after purchase to send you instructions and add you in "123 scanner group" for sharing or seeing experiences with other users. After 17 years of experience in the markets and programming, Winner indicator is ready. I would like to share with you! Introduction The 123 Pattern Scanner indicator with a special enhanced algorithm is a very repetitive common pattern finder with a high success rate . Interestingly,
    Auto Order Block with break of structure based on ICT and Smart Money Concepts (SMC) Futures Break of Structure ( BoS )             Order block ( OB )            Higher time frame Order block / Point of Interest ( POI )    shown on current chart           Fair value Gap ( FVG ) / Imbalance   -  MTF      ( Multi Time Frame )    HH/LL/HL/LH  -  MTF      ( Multi Time Frame )  Choch  MTF      ( Multi Time Frame )  Volume Imbalance     ,  MTF          vIMB Gap’s Power of 3 Equal High
    作者的更多信息
    这个QuickClose帮助您一键即可立即关闭所有订单,其工作非常快。您可以选择您想要的符号或关闭所有符号,因此它将有助于您在交易中更快地管理交易。该EA可以通过选定的符号或总数快速关闭所有买入和卖出订单。此SymbolButton专为关闭订单而设计。有手动和自动预设利润关闭功能。 带有总利润追踪功能,能锁定70%的目标利润,同时新的目标利润成倍提高. 并且带有自动删除全部挂单功能或者某个货币对全部挂单功能。 参数 PROFIT -> 某个货币对的全部订单利润达到PROFIT时,仅仅这个货币对的仓位全部平仓。 TOTALPROFIT   ->   全部货币对的利润达到TOTALPROFIT时全部平仓。 InpTrailingPercentage   ->   自动锁定70%的目标利润 ISEQUITY   ->   YES_EQ/NO_EQ. YES_EQ - 选择YES_EQ则净值低于EQUITY平仓. NO_EQ - 选择NO_EQ时净值低于EQUITY也不平仓。 EQUITY   ->   1.00. 净值低于EQUITY时全部平仓. ButtonsInARow   ->   每
    SoarSignal
    Daying Cao
    专业交易者都知道,在市场价格趋势转变时是进场交易的最佳时机,趋势转变时K线状态变化最明显,SoarSignal使用随机指标可以识别这些变化,确认趋势已衰竭,它是最接近K线状态变化的指标。SoarSignal的3条线均在 0 到 100 的区间内移动。值高于 80 视为处于超买区,表明价格可能发生反转。值低于 20 视为超卖,也表明价格可能发生反转。如果 %K 线由下往上穿越 %D 线,如果 %J 线由下往上穿越 %K与%D 线,可解读为买入信号。如果 %K 线由上往下穿越 %D 线,如果 %J线由下往上穿越 %K与%D 线,可解读为卖出信号。此类交叉可频繁发生。为获取更可靠的信号,您可以等待交叉与到达超买/超卖位同时发生。当有更可靠的买卖信号时提示交易者。 输入参数 nPeriod:20-Indicator Period.KDJ指标周期,通常不需要改变。 zoneSELL:80-值高于 80 视为处于超买区,表明价格可能发生反转。 zoneBUY:20-值低于 20 视为超卖,也表明价格可能发生反转。 InpBuyColor:LighSeaGreen-多头箭头颜色。 InpSell
    StrongCurrency
    Daying Cao
    5 (1)
    StrongCurrency是基于各种技术指标,移动平均线和枢轴的完整交易系统。这些元素中的每一个都可以通过定义的规则和系数进行评估(取决于指标),为StrongCurrency提供了无限优化的方案。StrongCurrency通过评估数据创建一个趋势强度和入场信号列表显示,它显示所有货币对的数据。根据每个货币对趋势强弱获得入场信号。列表数据包括Symbol,BuyPercent,SellPercent,LastBuySignal,LastSellSignal。其中LastBuySignal和LastSellSignal内容显示入场价格,时间,货币对趋势百分比。趋势强度大于70%时,认为是强货币对;该工具适用于外汇市场,指数,金属的数据。 该工具仅在一个图表任意周期上运行,它对于多货币交易者非常有吸引力的,其简化的信息(LastBuySignal和LastSellSignal)可以提供出色的输入信号。帮助您快速,识别强弱货币对。请参见截图。 关于MT4回测多货币的限制在评论里有说明。 输入参数 Text Color = White - 常态文本颜色。 Buy Signal colo
    PowerSignal
    Daying Cao
    5 (1)
    这个PowerSignal是基于ATR技术指标的完整交易系统。该指标将分析并记录每个POWERTREND从M5-MN中每个周期和货币对趋势强度。 PowerSignal通过评估这些数据来创建一个趋势强度和入口点信号列表显示。如果趋势强度百分比达到100,则一个警告会弹出来指示这种情况。当趋势百分比达大于等于75%时认为是强货币,另外LastEntry字段提示选择一个周期入场、显示了多个入场周期,入场价格,时间.通常根据实际情况选择一个中高周期入场比较好。 输入参数 Periods = 14-indicators Periods. Text Color = While - 常态文本颜色。 Buy Signal color = LawnGreen - 多头信号颜色。 Sell signal color = OrangeRed - 空头信号颜色。 Alert_ON = false-禁止报警.true-激活报警:支持报警提示、邮件、手机推送. Alert_Min_Interval = 15 Entry_Percent = PERCENT_100 - PERCENT_100表示产生多空信号的
    这个指标显示2条移动平均线间的交叉,一个快速和慢速移动平均线。当快速MA1向上穿越慢速MA2时弹出报警。当快速MA1向下穿越慢速MA2时弹出报警。 输入参数 快速MA设置 Period = 5 -快速MA周期 Mode = SMA - type of Moving Average (SMA, EMA, SMMA, LWMA). Price = Close - type of price (Close,Open, Low, High, Median, Typical, Weighted). 慢速MA设置 Period:10 - 慢速MA周期 Mode = SMA - type of Moving Average (SMA, EMA, SMMA, LWMA). Price = Close - type of price (Close,Open, Low, High, Median, Typical, Weighted). 其他 NewBarCheckOnly = true/false - true:Check only new Bar DistanceBetweenMA = 0 - 2
    这个EA是基于经典的趋势跟踪系统监测入场信号的。它是基于ATR和CCI指标与移动平均线指标 DYJ TwoMACrossAlarm ,它使用2条移动平均线交叉查找信号,2个平均线分为一个快速和慢速移动平均线,这个EA使用了动态分配移动平均线MA1和MA2的周期,平均线周期使用了斐波那契数列,例如5,8 或 13,21 或 21,34 或......;当快速MA1向上穿越慢速MA2与CCI值向上穿越0线时,建立多单。当快速MA1向下穿越慢速MA2与CCI值向下穿越0线时,建立空单。ATR指标用于自动计算止损。如果有相反信号以及止损,止盈,追踪止损退出. 输入参数 MA Setup IsAutoAllocationMA = true - Dynamic allocation Period Fast MA Setup Period =5 - period of Faster Moving Average (value 5 ),if not automatic allocation period . Mode = EMA - type of Moving Average (SMA,
    DYJ NewsForexFactory是用于基本市场分析的日历交易工具,同时它也是宏观经济事件指标。 在这里,你可以找到全球最大经济体的金融新闻和指标——从美国、欧盟到澳大利亚和纽西兰和日本和中国,共有9个经济体,涉及60多个货币对。800多个宏观经济指标和事件是从公共来源实时收集的。每个指标都有历史、当前和预测值以及重要性特征。此外,该服务存储图表和表格中列出的大量历史数据。 指示器右侧动态绿色箭头指示最后一个事件的发生,并给出该货币的数据分析结果,Better或者Worse,你能根据结果判断货币对的多与空 指示器左边指示黄色星号表示下一个即将发生的事件 指示器时间序列栏里显示每个时间点的事件对象。 指示器具有电子邮件和推送通知功能。 所有货币对 GBPUSD、EURUSD、USDJPY、USDCHF、USDCAD、GBPJPY、EURJPY、eugbp、EURAUD、EURNZD、EURCAD、EURCHF、CADJPY、CADCHF、AUDUSD、AUDNZD、AUDCAD、AUDJPY、AUDCHF,NZDJPY、NZDUSD、NZDCAD、NZDCHF 参数
    这个指标显示了3条移动平均线之间的交叉,有快速、中速、慢速3条MA线。当快速FastMA向上穿越中速middleMA与中速middleMA向上穿越慢速slowMA,发出多头报警。当快速FastMA向下穿越中速middleMA与中速middleMA向下穿越慢速slowMA,发出空头报警。其中三线交叉包含了三线交叉于一个点的特例;当FastMA(MA1) 向下穿越middleMA(MA2),发出报警提示关闭多单,当FastMA(MA1) 向上穿越middleMA(MA2),发出报警提示关闭空单。 输入参数 快速MA设置 MAPeriod1 = 5 - 快速平均线周期. MAMethod1 = EMA - 移动平均线类型(SMA, EMA, SMMA, LWMA). MAPriceType1 = Close - 价格类型 (Close,Open, Low, High, Median, Typical, Weighted). 中速MA设置 MAPeriod2 = 20 - 中速平均线周期. MAMethod2 = EMA - 移动平均线类型 (SMA, EMA, SMMA, LWMA).
    这个 Expert Advisor 是基于3条移动平均线指标,移动平均线交叉基于下列思想:快速、中速、慢速3条移动平均线交叉时,作为开仓和关仓的信号,其中三线交叉包含了三线交叉于一个点的特例。 当FastMA(MA1) 向上穿越middleMA(MA2)与middleMA(MA2)向上穿越slowMA(MA3)时建立多单. 当FastMA(MA1) 向下穿越middleMA(MA2)与middleMA(MA2)向下穿越slowMA(MA3)时建立空单; 当FastMA(MA1) 向下穿越middleMA(MA2),关闭多单,当FastMA(MA1) 向上穿越middleMA(MA2),关闭空单。 这个专家使用了资金管理,传统的止损、止盈、追踪止损。每次交易只有一个订单,这确保交易的最大安全。 输入参数: Fast MA settings Period = 5 - period of Faster Moving Average (value 5 ). Mode = EMA - type of Moving Average (SMA, EMA, SMMA, LWMA). Pric
    The RiseTrading is a unique High quality and easy to use and affordable trading tool because we have incorporated a number of proprietary features and PowerSignal and MACD and Stochastic indicators. The main advantages of the trend trading strategy used by the Expert Advisor are opening positions only in the direction of a trend, ability for the long-term retention of profitable positions allowing users to achieve good combinations of profit/loss distributions. That can work on a real account at
    DYJ Stoch 控制器 是一个全货币对 Stoch 交易系统,它能显示每一个货币对M1到MN周期的 Stoch 值,当某个周期的 Stoch 值达到超卖区和超买区时有颜色提示,你能根据这些信息做出正确的交易 请你制作一个 Stoch 指标模板命名为DYJ Stoch ,保存它 当你用鼠标单击超卖区或者超买区时,自动打开相应货币对   周期的 图表,并加载 Stoch 指标 INPUT InpPairs                      = "GBPUSD,EURUSD,USDJPY,USDCHF,XAUUSD,USDCAD,GBPJPY,EURJPY,EURGBP,EURAUD,EURNZD,EURCAD,CADJPY,AUDUSD,AUDNZD,AUDCAD,AUDJPY,NZDJPY,NZDUSD,NZDCAD,GBPAUD,GBPNZD,GBPCAD,CHFJPY,NZDCHF,AUDCHF,EURCHF";     InpStrategyMinTimeFrame         = PERIOD_M1 -- Strategy MinPeriod  InpStra
    这个 DYJ SoarTrading 是基于 SoarSignal 指标,它能使用任何货币对和任何图表周期。 当SoarSignal交叉在oversold下方, 达到oversold区域,且它们的交叉又向上穿越oversold线时,多头进场。当SoarSignal交叉在overbought上方, 达到 overbought区域, 且它们的交叉又向下穿越overbought线时,空头进场。 当SoarSignal到达对侧的区域,如果对侧区域是overbought区域关闭多单,如果对侧区域是oversold区域关闭空单. 这个专家使用了资金管理,传统的止损、止盈、追踪止损。每次交易只有一个订单,这确保交易的最大安全。 输入参数 SoarSignal指标设置 nPeriod = 20 - 指标周期 zoneSELL = 80 - 超买水平(overbought) zoneBUY = 20 - 超卖水平(oversold) 风险管理 Risk_Management = Automatic - 自动管理风险. Auto_Risk_Percent = 2 - 2%的活动资金. Auto_Max_
    DYJ WPR - SignalSource 是基于  WPR  指标的EA . 它仅仅使用一个货币对某个周期图表运行EA,就能监控全部货币对信号开仓关仓。 WPR 推荐 指标值介于80%和100%之间,表明市场超卖。 指标值介于0到20%之间,表示市场超买。 该指标的入场信号,则是趋势转折点。 该指标使用模拟交易技术,   指标为你提供评价开盘信号和收盘信号整体盈利。   你用哪种评估模式交易都很方便。   当你选择最大利润模型评估模型时, 建议您使用跟踪止损功能。 这样可以最大程度的跟踪趋势利润。   当您选择反向信号关闭评估模式时, 建议你耐心等待反信号出现,然后关闭仓位。 这个可以一直等趋势真正结束并盈利。 如果您需要自动化跟随指标开仓关仓,请下载实用工具软件 DYJ Follow Me Input parameters  [Indicator] InpWPRPeriod    = 14 -- period for WPR    InpShowArrows      = true InpAlertsOn        = true ArrowUpClr 
    DYJ Sharp
    Daying Cao
    DYJ Sharp高级算法,可检测新趋势和当前趋势延续,策略可用于入场和出场信号。策略在图表里显示了SHARP分界区域,区域有高位价格线HighLine和低位价格线LowLine。当K线的收盘价向上穿越区域 HighLine价格时与最低价向上穿越区域LowLine价格时是上涨信号,当K线收盘价下穿区域LowLine价格与最高价下穿HighLine价格时是下跌信号。每个货币对的信号显示在LAST SIGNALLED字段 输入参数 Paris - 指定货币对,以逗号分隔,例如 EURUSD,USDJPY,CADJPY MAX_BARS = 100 - 最大K线数量 nMinPeriod = D1 - 最小入场周期 nMaxPeriod = D1 - 最大入场周期 SendEmail = false - 通知你的邮箱 ShowAlert = true - 显示弹出报警窗口. MobileAlert = true - 通知到你的移动设备. MyMessage = 来自SHARP的消息. - 自定义消息 作者 Daying Cao, 我是一个具有丰富经验的软件工程师.
    DYJ TRENDWAVE高级算法,检测新的趋势和当前趋势的延续,作为策略的入场信号。DYJ TRENDWAVE指标基于衡量多空双方的力量百分比,当空头(-)多头(+)趋势大于100%时产生信号。如果当前K线是阳线为多头入场信号,如果当前K线是阴线为空头入场信号,它使用多种滤波器对虚假信号过滤。 特点: 同时监视所有交易品种。 如果Pairs是空,指标默认监控报价窗口全部货币对,但用户可以选择喜欢的货币对. 监控每个时间段,从M1到MN。 仅在一个货币的某个图表周期(推荐H4或D1)运行指标. 输入参数: Pairs  --指定多货币符号,例如 EURUSD,USDJPY,CADJPY";为空时代表MARKET WATCH窗口的全部货币对 MinTimeFrame  = H1   --最小入场周期 MaxTimeFrame = MN   --最大入场周期 InpBuyColor = clrLime    --空头颜色. InpSellColor = clrWhite  --多头颜色. Send_Email = true       --发送邮件通知. Snow_Alert =
    DYJTRENDWAVE高级算法,检测新的趋势和当前趋势的延续,作为策略的入场信号。DYJTRENDWAVE交易系统基于衡量多空双方的力量百分比,当空头(-)多头(+)趋势大于100%时产生信号。如果当前K线是阳线为多头入场信号,如果当前K线是阴线为空头入场信号,它使用多种滤波器对虚假信号过滤。EA离场规则是当有反信号时或止损或追踪止损或止盈。 EA的新闻交易是基于经典DYJTRENDWAVE趋势波策略的。您只需要从EA属性进行新闻时间和入场周期配置,其余部分由机器人自动处理。 EA默认是任何时间都能交易。3段工作时间参数是日内范围的。 例如,如果要设置从19:00 PM到05:00 AM的工作时间,则必须定义两个不同的时间间隔,例如19:00至23:59和00:00至05:00。 例如设置新闻时间是19:59 到 20:05,入场周期选择MinTimeFrame=M1至MaxTimeFrame=H1. 这个专家使用了资金管理,传统的止损、止盈、追踪止损。每次交易限定的订单数量,这确保交易的最大安全。 特点: 同时监视所有交易品种。 EA默认监控23个主流货币对,但用户可以选择喜欢的货
    DYJ Scalping是一个全自动专家顾问。 随机指标过滤器用于入场条件。顾问需要对冲型、ECN账户类型 EA具备解套辅助策略,当方向错误时,自动激活解套策略,使其变为获利. 你可以随时禁用解套策略. 一般性建议 推荐ECN账户,XAUUSD点差在8到11或更低,EURUSD点差1 最低存款为200美元。 请在产品评论区下载XAUUSD and EURUSD设置文件 输入参数 InpLotsRisk                = 0.002  -- 批量风险x%, 如果余额为$10000与500杠杆,则默认为0.002%; 如果余额是$100或$200 与500杠杆 ,设置risk 0.1%; 如果 余额为$10000与 是2000杠杆,则rsik 0.008% 如果 余额为$100或$200与 是2000杠杆,则rsik 0.4% InpLots                      = 0      --  InpLots: 0-->自动 InpBlanceLimitMode   = EQUITY_LIMIT -- 净值限额模式,或删除EA               
    DYJ T3ModeMA基于T3算法。 T3算法是在美国杂志《TASC》发表的文章《更好的移动平均线》中被引入技术分析领域的。 T3可以平滑价格序列,同时减少趋势跟踪系统的典型滞后。 该指标的柱形线尺寸决定入场信号,当柱形线尺寸趋于0时,则是趋势转折点。 该指标使用模拟交易技术, 指标为你提供评价开盘信号和收盘信号整体盈利。 你用哪种评估模式交易都很方便。 当你选择最大利润模型评估模型时, 建议您使用跟踪止损功能。 这样可以最大程度的跟踪趋势利润。 当您选择反向信号关闭评估模式时, 建议你耐心等待反信号出现,然后关闭仓位。 这个可以一直等趋势真正结束并盈利。 如果您需要自动化跟随指标开仓关仓,请下载实用工具软件 DYJ Follow Me Input [Indicator] InpMaMetod         = 2 -- Moving Average method(0~3):0-Simple averaging; 1-Exponential averaging; 2-Smoothed averaging;3-Linear-weighted averagin InpMaPer
    DYJ Long term Strategy EA 是一个长线RSI交易系统。 我们在蜡烛中寻找最低价格作为多头趋势开始, 寻找最高价格位空头趋势开始, 我们会以最长时间持仓, 并且获得最大利润。 当订单方向错误时,策略能使其扭亏为盈。 EA仅仅在一个货币对图表任意周期运行 信号网址   参数 InpMagicNumber = 8257 InpIsDisplayInterface = true InpEAComment = LTS InpRStrategyTimeFrame = 1 Day InpLotsRisk = 0.0002 -- Lots Risk x%,default 0.002% if blance is 10000$ InpLots = 0.01 -- fixed lot [0-->Auto] InpMaxSpread = 100 Maxtrades = 1 InpDirection = Both InpFristOrderStep = 200 InpOrderStep = 200 InpTakeProfit = 0 InpStopLoss = 0 InpIsHi
    DYJBands使用Bands带信号开仓关仓:当价格回落时,它在较低频段买进,而在较高频段卖出.在相反的信号下或通过止盈,止损,追踪止损关仓. 这个专家使用了资金管理,传统的止损,止盈,追踪止损.每次交易限定的订单数量,这确保交易的最大安全.EA不使用高风险的交易方法,并且可以在大多数货币对和时间范围内进行交易.此外,它不会花费太多,而且它的设置非常简单,这对有经验的和新手交易者都是有好处的.EA默认设置参数设置适合GBPUSD在图表周期H1运行.此外, EURUSD, USDJPY, USDCAD和XAUUSD或其他等货币对的设置将在评论部分提供. EA的新闻交易是基于经典DYJBands策略的。您只需要从EA属性参数进行新闻时间和入场周期配置,其余部分由机器人自动处理。例如设置新闻时间是19:59 到 20:05,入场周期选择TimeFrame=M1至TimeFrame=H1.EA默认是任何时间都能交易。3段工作时间参数是日内范围的。 例如,如果要设置从19:00 PM到05:00 AM的工作时间,则必须定义两个不同的时间间隔,例如19:00至23:59和00:00至05:00。
    这个专家是一个独特的、易于使用的高质量的工具,因为我们纳入了MACD、Stochastic,RSI和ADX指标,EA使用趋势策略的优点在于保持长期盈利方向上才做单。它使用户的利润/损失有良好的组合实现。EA使用MACD与Stochastic,RSI和附属入场策略ADX指标查找信号。 入场规则: 多单:当在负值区域,MACD线向上穿越SIGNAL时,并且在MACD开仓水平下方时,同时Stochastic交叉在zoneBuy下方,然后又穿越zoneBuy线到zoneBuy上方时做多。 空单:当在正值区域,MACD线向下穿越SIGNAL线时,并且在MACD开仓水平的上方时,同时Stochastic交叉在zoneSell上方,然后又穿越到zoneSell的下方时做空。 退出规则: 多单:当在正值区域,MACD线向下穿越SIGNAL线时,并且在MACD关仓水平上方时关闭多单。 空单:当子啊负值区域,MACD线向上穿越SIGNAL线时,并且在关仓水平下方时关闭空单。 EA的新闻交易是基于经典DYMacdSto策略的。您只需要从EA属性参数进行新闻时间和入场周期配置,其余部分由机器人自动处理。
    DYJ StrongCurrency EA是基于各种技术指标,移动平均线和枢轴的完整交易系统。这些元素中的每一个都可以通过定义的规则和系数进行评估(取决于指标),为DYJ StrongCurrency EA提供了无限优化的方案。DYJ StrongCurrency EA通过评估数据创建一个趋势强度和入场信号列表显示,它显示所有货币对的数据。根据每个货币对趋势强弱获得入场信号。列表数据包括Symbol,LastEntryies,LastPercent。其中LastEntryies,LastPercent内容显示入场价格,时间,货币对趋势百分比。趋势强度大于70%时,认为是强货币对;该工具适用于外汇市场,指数,金属的数据。 EA默认是任何时间都能交易。3段工作时间参数是日内范围的。 例如,如果要设置从19:00 PM到05:00 AM的工作时间,则必须定义两个不同的时间间隔,例如19:00至23:59和00:00至05:00。 EA的新闻交易是基于经典StrongCurrency趋势策略的。您只需要从EA属性进行新闻时间和入场周期配置,其余部分由机器人自动处理。 例如设置新闻时间是19:5
    这个策略是基于自适应算法指标,自动寻找价格新低点与高点。这个DYJ TrendPending EA是实施这个规则开仓关仓的, 它使用风险最小的网格和加仓方法。并且可以附加正向和反向挂单,正向挂单可以降低网格和加仓次数,而反向挂单降低亏损概率。 EA的新闻交易是基于经典TrendPending策略的。您只需要从EA属性参数进行新闻时间和入场周期配置,其余部分由机器人自动处理。例如设置新闻时间是19:59 到 20:05,入场周期选择TimeFrame=M1至TimeFrame=H1.EA默认是任何时间都能交易。3段工作时间参数是日内范围的。 例如,如果要设置从19:00 PM到05:00 AM的工作时间,则必须定义两个不同的时间间隔,例如19:00至23:59和00:00至05:00。 EA默认设置参数设置适合EURGBP在图表周期H1运行. 此外, GBPUSD,EURUSD和XAUUSD或其他等货币对的设置将在评论部分提供. 推荐: EA 设置: 使用默认设置或set files. 货币对: EURGBP. 图表: H1. 账户:ECN经纪商, 低点差/手续费, 1:500 lev
    这是一个多货币和多策略EA。该EA是在交易中创建一个或多个轮询交易的策略。 在轮询模式中,这些策略能应对各种复杂的市场环境,在交易中含有逆向策略。在趋势跟踪模式下,通过附加的主要趋势过滤器, DYJ's ArtOfForexWar 还可以在亏损趋势期间进行回撤交易。通常是在3单或3次平仓以内获利概率大于95%。 DYJ's ArtOfForexWar的新闻交易是基于多个趋势波策略的。您只需要从EA属性进行新闻时间和入场周期配置,其余部分由机器人自动处理。 DYJ's ArtOfForexWar默认是任何时间都能交易。3段工作时间参数是日内范围的。 例如,如果要设置从19:00 PM到05:00 AM的工作时间,则必须定义两个不同的时间间隔,例如19:00至23:59和00:00至05:00。 例如设置新闻时间是19:59 到 20:05,入场周期选择MinTimeFrame=M1至MaxTimeFrame=H1. 这个专家使用了资金管理,传统的止损、止盈、追踪止损。每次交易限定的订单数量,这确保交易的最大安全。 特点 同时监视所有交易品种。 EA默认监控35个主流货币对,但用户可
    DYJ Scappingburg EA是一个全自动专家顾问。 Burg算法过滤器用于条目。顾问需要对冲和ECN账户类型。 如果订单方向错误, 订单损失将由解套策略使其扭亏为盈。 您可以随时禁用 解套 策略。 一般性建议 推荐ECN账户,xauusd点差在8和11之间或更低,欧元兑美元点差1 最低存款额是200美元。 请在产品评论区下载xauusd和EURUSD设置文件 Input Parameters [Burg] MinProfit                  =  160 -- Open positions if predicted profit >= MinProfit PastBars                   =  200     --   Number of past bars ModelOrder              =  0.37     --   Order of Burg model as a fraction of PastBars UseMOM                   =  true     --  
    DYJ ArtOfMakingMoney attempts to gauge bullish and bearish forces in the market by using two separate measures, one for each type of directional pressure. The  EA's BearsIndex  attempts to measure the market's appetite for lower prices The EA's BullsIndex attempts to measure the market's appetite for higher prices Features Monitors all pairs at the same time. The EA monitors the top 35 pairs by default, but you can select less pairs if you wish. It is a multi-currency EA that can be run from a
    DYJ Trend Analyst
    Daying Cao
    5 (1)
    我们的目标是提供无障碍和高质量的服务,使市场参与者、交易员和分析师都能获得及时的市场行情的交易决策所需的市场观察指标。 这是最优化,高度稳健和易于使用的动态趋势分析指标。 DYJ市场观察指标试图用两种不同的方法来衡量市场的看涨和看跌力量,每种方法都有一种。 该指标的熊市指数尝试衡量市场对价格下降趋势。 该指标的牛市指数尝试衡量市场对价格上涨趋势。 Pivot是市场观察指标的额外指标。Pivot含有6种策略:经典,卡玛瑞拉,无敌,斐波纳奇,网络布局,黄金分割. 另外点评里,采用多个辅助指标RSI,MACD,MA,布林带等过滤假信号. 我们的Pivot指标是基于先进的算法计算支点和支持和阻力水平。 它们对未来重要的价格水平和可能的市场逆转做出难以置信的准确预测。 适用于所有市场(外汇、大宗商品、股票、指数和其他)和时间框架。 特点: 同时监视所有对。 默认情况下,指标监视报价窗口的全部货币对。 它只从一个图(m1到mn)运行。 参数: inplanguage = english  --  英语或中文 InpCalculationMode = CALC_MODE_CLA
    The DYJ Trend Analyser EA is based on  DYJ Trend Analyst  indicator. The most optimized, highly robust and easy to use DYJ Trend Analyser EA. DYJ Trend Analyser EA attempts to gauge bullish and bearish forces in the market by using two separate measures, one for each type of directional pressure. The  EA's BearsIndex  attempts to measure the market's appetite for lower prices. The EA's BullsIndex attempts to measure the market's appetite for higher prices. Pivot Point Extra Indicator for DYJ Tr
    这是一位高级专家顾问,它的策略是在图表上出现突然剧烈波动时进行交易。 这个EA是趋势突破交易 不过,它在市场每个蜡烛上产生一笔交易 它是低风险EA,没有很多仓位,具有预定义的TP、SL和TS 特征 监控全部货币对. 这个EA能监控默认的15个设置货币对, 但也能选择较少或较多的货币对. 这个EA是多货币EA,仅仅在一个图表运行EA,推荐H1图表。 通常每单利润成功率在80%以上 参数: InpPairs  = "EURUSD,GBPUSD,GBPJPY,USDCHF,XAUUSD,USDJPY,AUDJPY,AUDUSD,NZDUSD,AUDCAD,AUDCHF,NZDCHF,NZDJPY,EURGBP,EURJPY" InpMagicnumber=36723457                  //  EA标识号码 InpAdxLevel       =  30                         //   趋势强度 AutoLotLevel      =  Second                  //  自动交易量级别 InpLotsExponent   =
    The  DYJ Hedging  is based on the following idea:crossing of two Moving Average lines (Fast and slow ) is used as a signal for opening positions. We will now apply game theory strategy on the future of per currency instead of a price chart of history. This is one level higher. Dynamic Market game theory is a special feature of Advanced Currency Health Bars indicator and you cannot find in any other Currency Meter! This is a very unique function. Dynamic Market game theory strategy Health Bars ar
    筛选:
    无评论
    回复评论
    版本 2.15 2024.06.26
    Optimize code
    版本 2.8 2024.06.25
    Optimize code
    版本 2.1 2024.06.24
    Optimize code
    版本 2.0 2024.06.21
    Optimize code
    版本 1.9 2024.06.14
    Optimize code
    版本 1.7 2024.06.11
    Optimize code
    版本 1.4 2024.06.11
    Optimize code
    版本 1.3 2024.05.14
    Optimize code
    版本 1.2 2024.04.26
    Optimize code