Basic Support and Resistance MT5
- 指标
- Mehran Sepah Mansoor
- 版本: 1.10
- 更新: 2 六月 2024
- 激活: 10
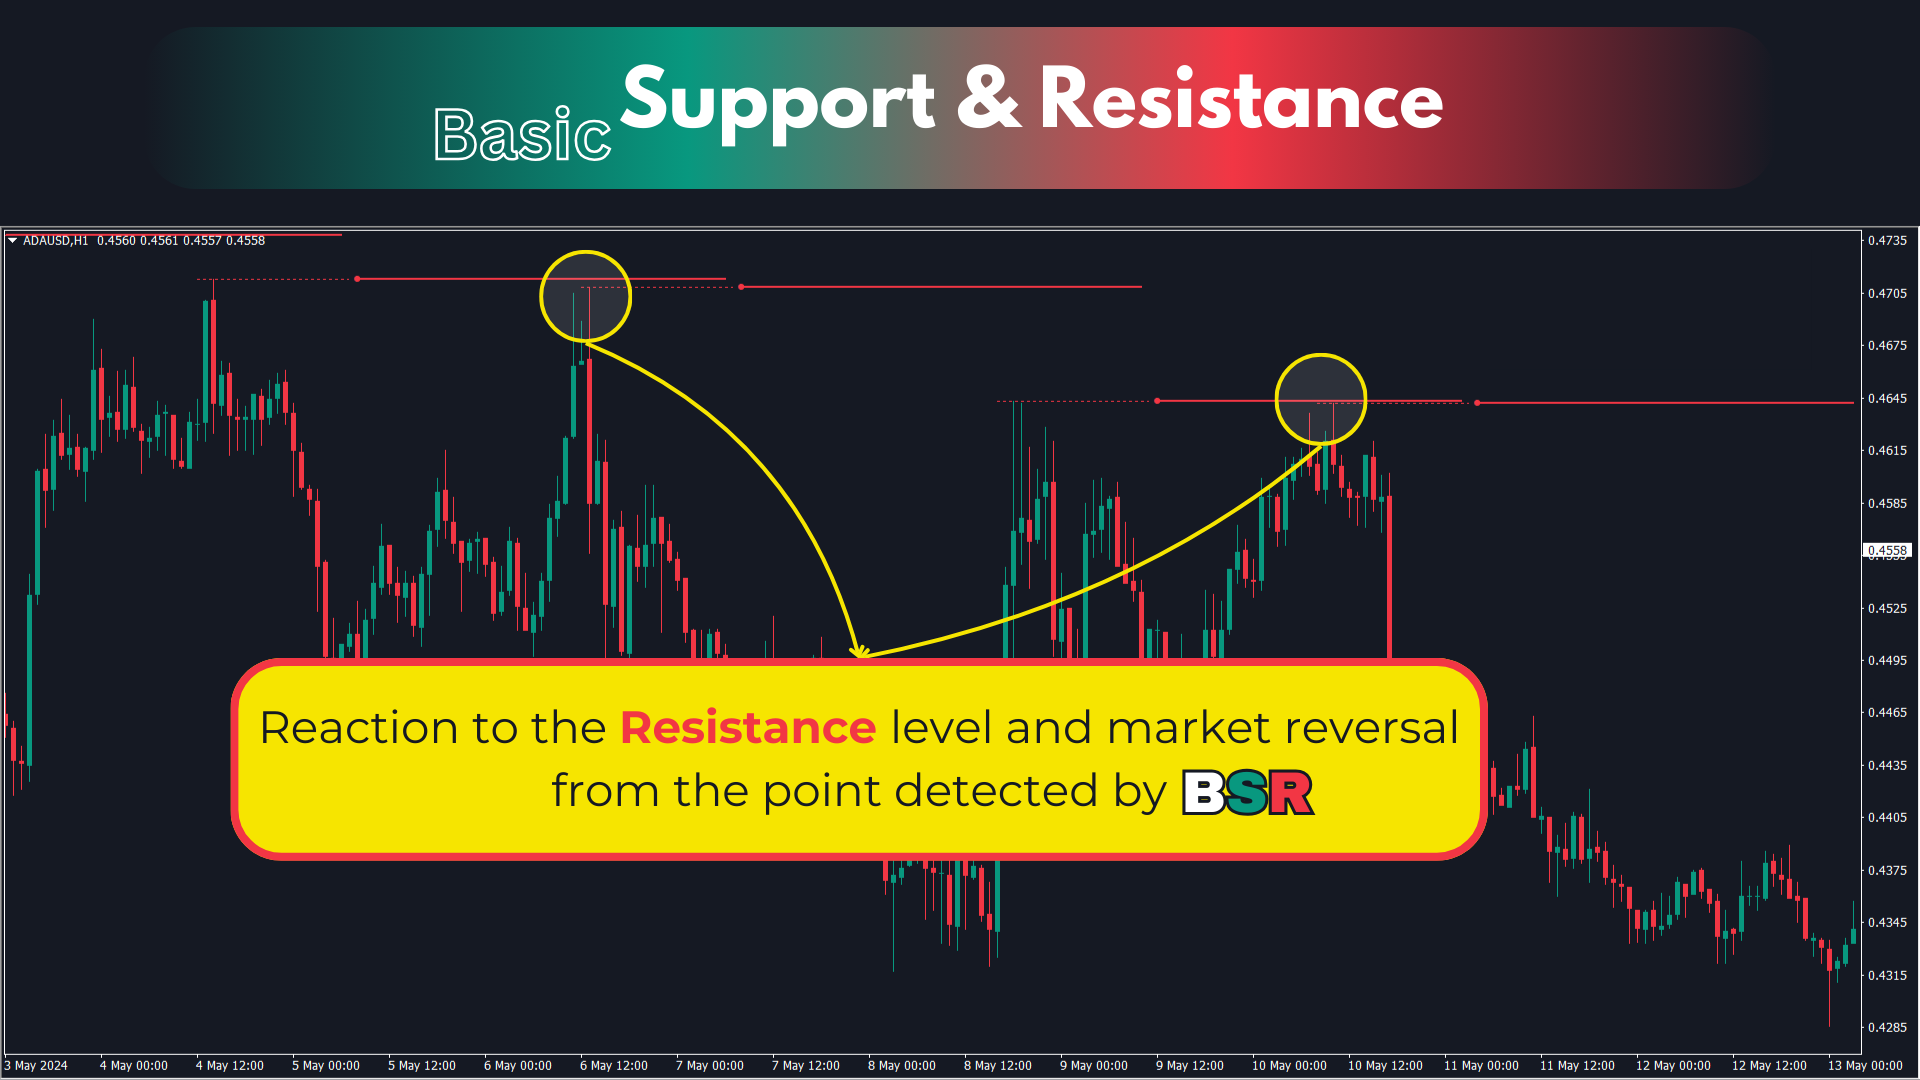
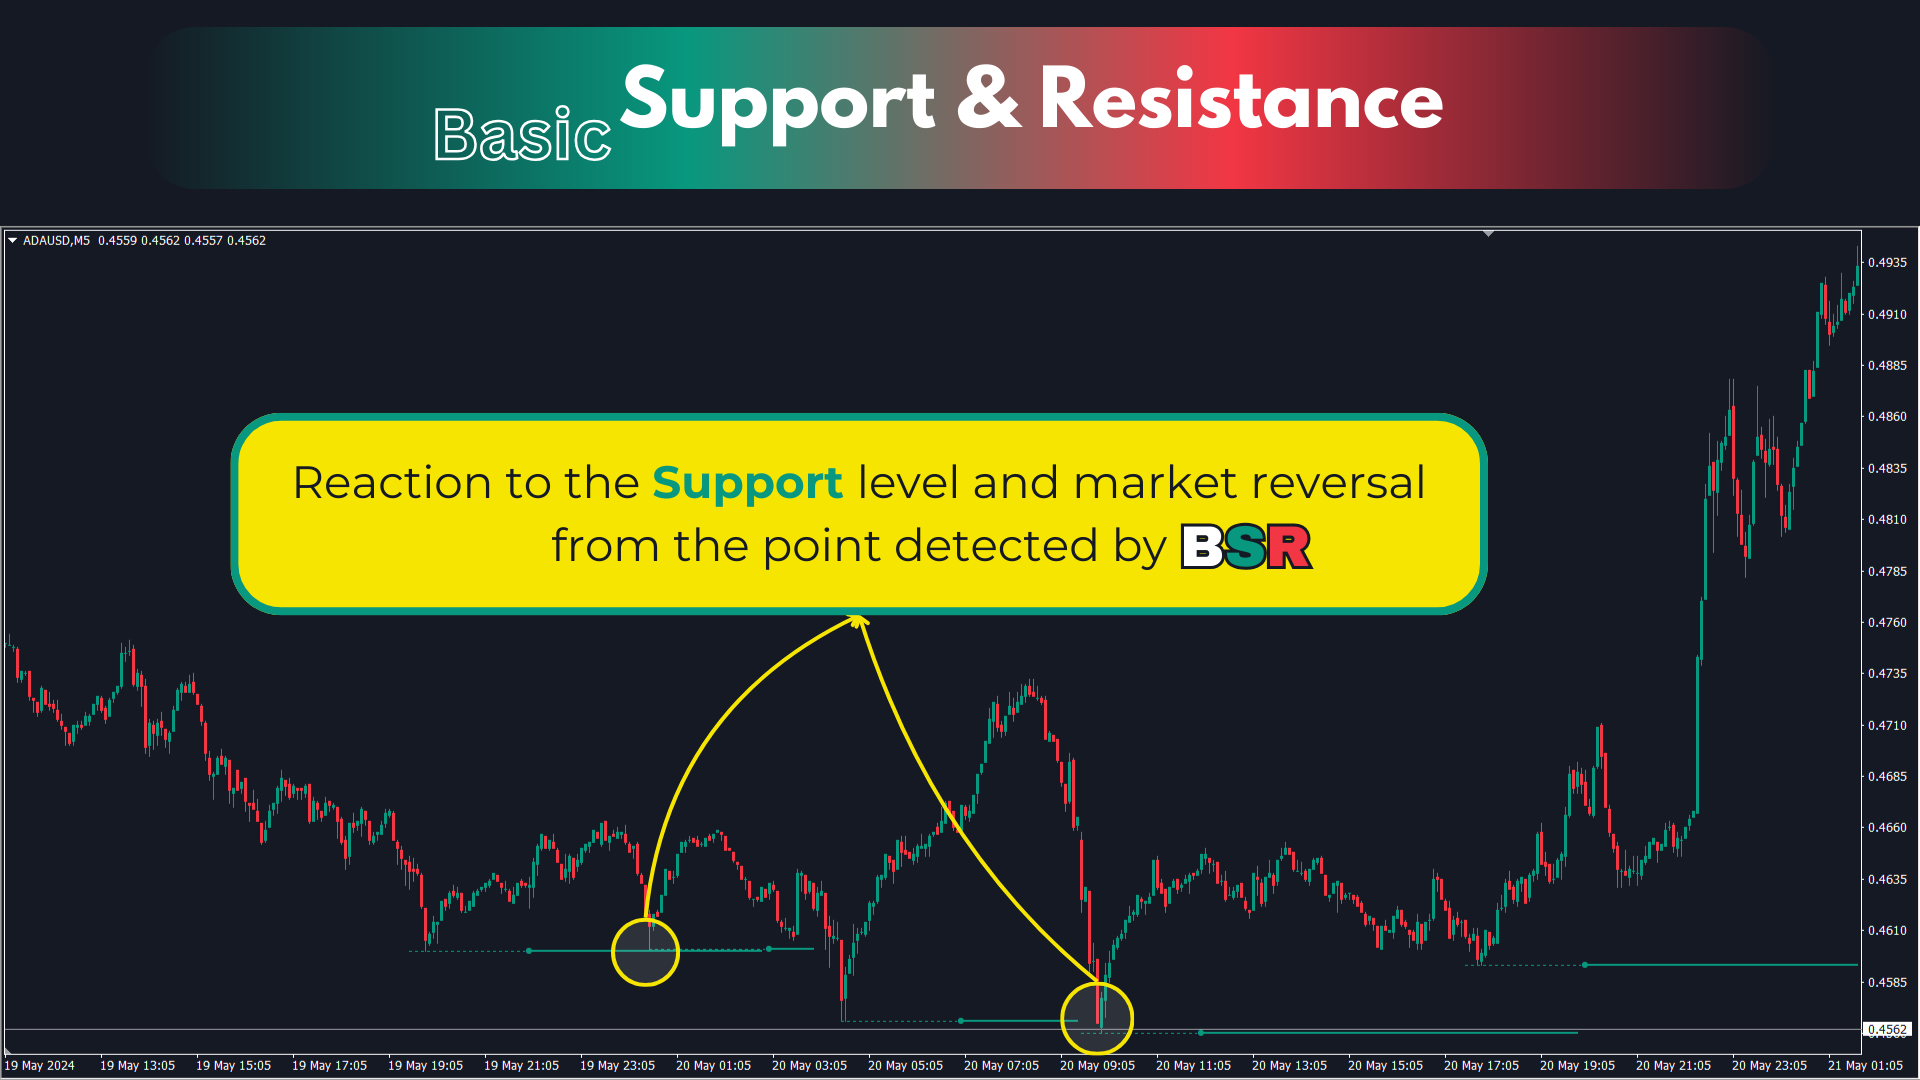
我们的 Basic Support and Resistance 指示器是提高技术分析所需的解决方案。该指标允许您在图表/MT4版本
功能
斐波那契水平的集成:
可以选择显示斐波那契水平以及支持和阻力水平,我们的指标使您对市场行为和可能的逆转区域有更深入的了解。性能优化:
只能在每个栏的打开时更新扩展线,我们的指标可确保最佳性能,而无需牺牲支持和阻力级别的准确性。输入
主设置
- Timeframe: 通过此输入,您可以选择在图表上显示较高时间范围的支撑线和阻力线。
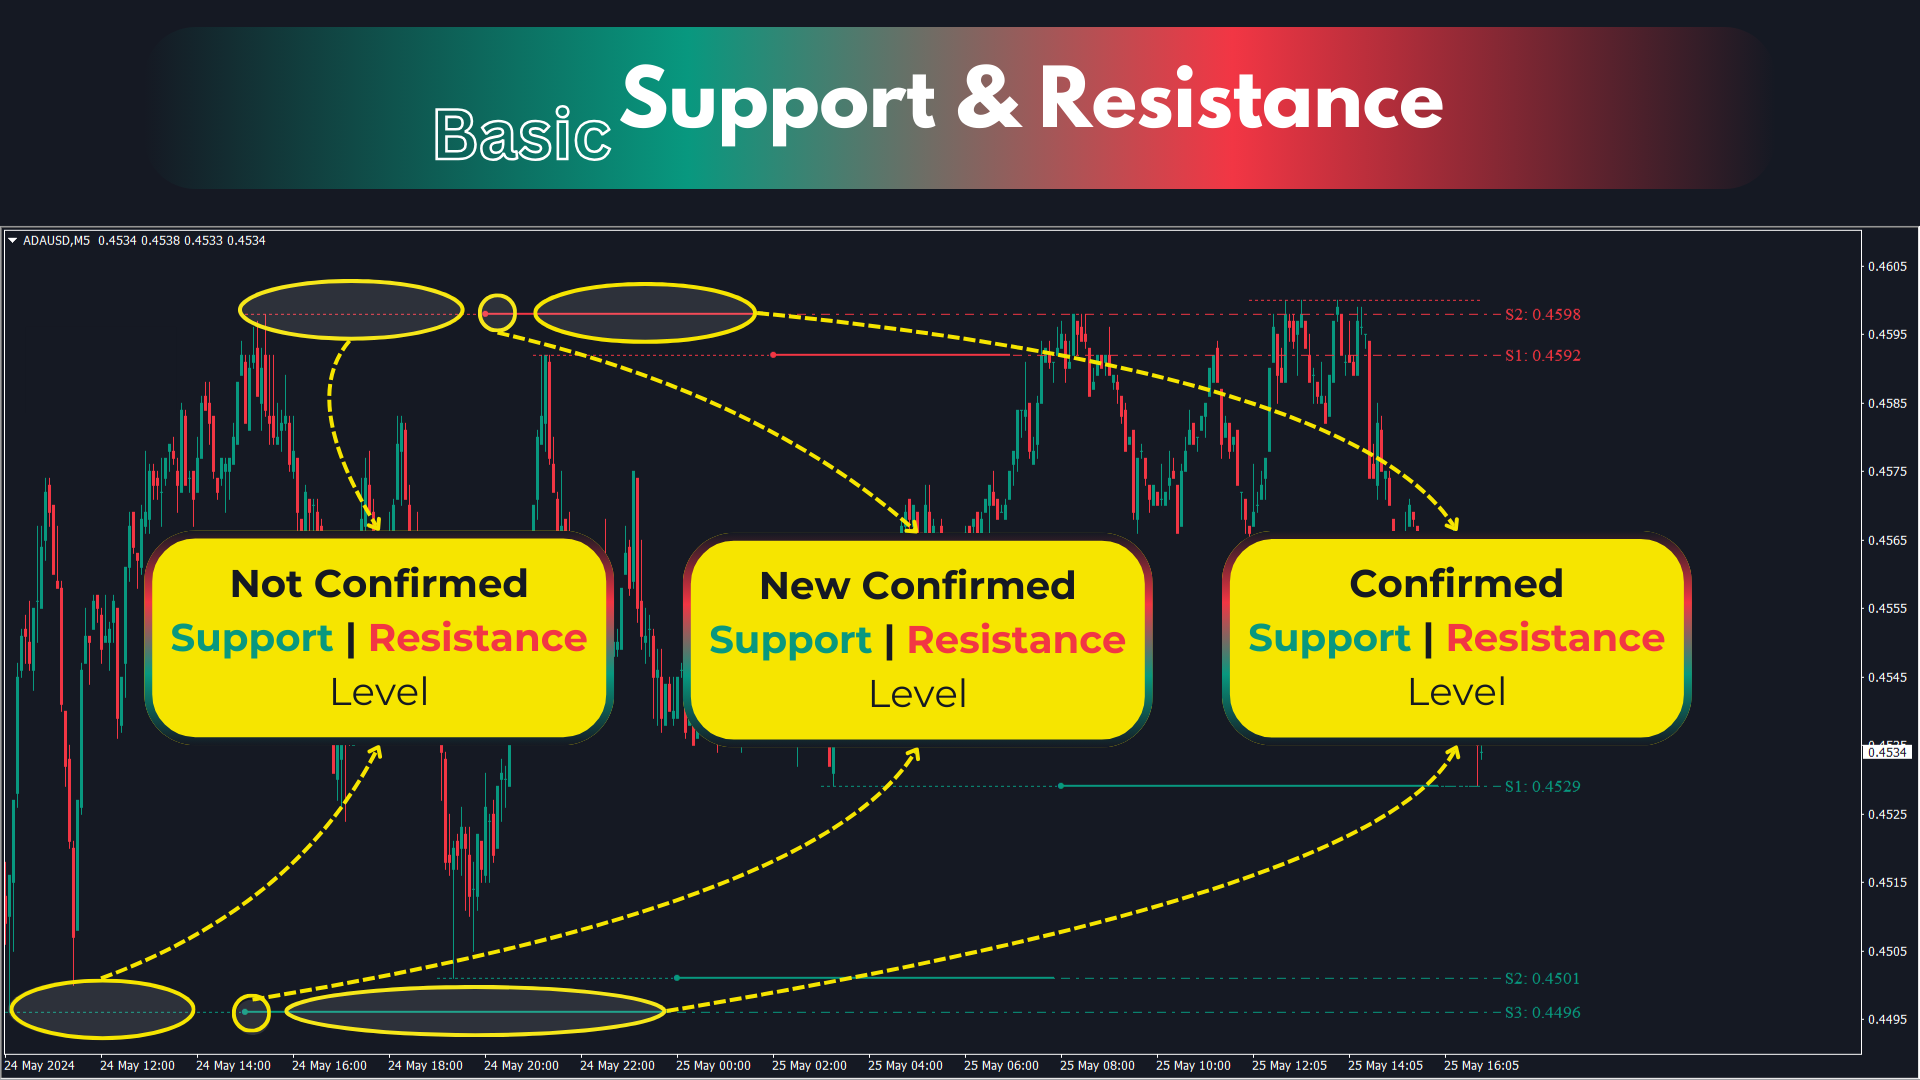
- Support/Resistance Strength [Number of Bars]: 使用此输入,您可以确定支撑和电阻的强度。数量越高,支持/阻力越强。
- Price mode: 此参数允许您选择哪种价格将用于计算支持和电阻水平。它可以是收盘价,最高价格,最低价格等。取决于您的策略和偏好,您可以选择最适合您需求的价格。
显示设置
- Display Fibonacci levels: 此参数确定是否将显示斐波那契水平以及图表上的支持和电阻级别。斐波那契水平是技术分析中使用的关键水平,并使用斐波那契序列进行计算。
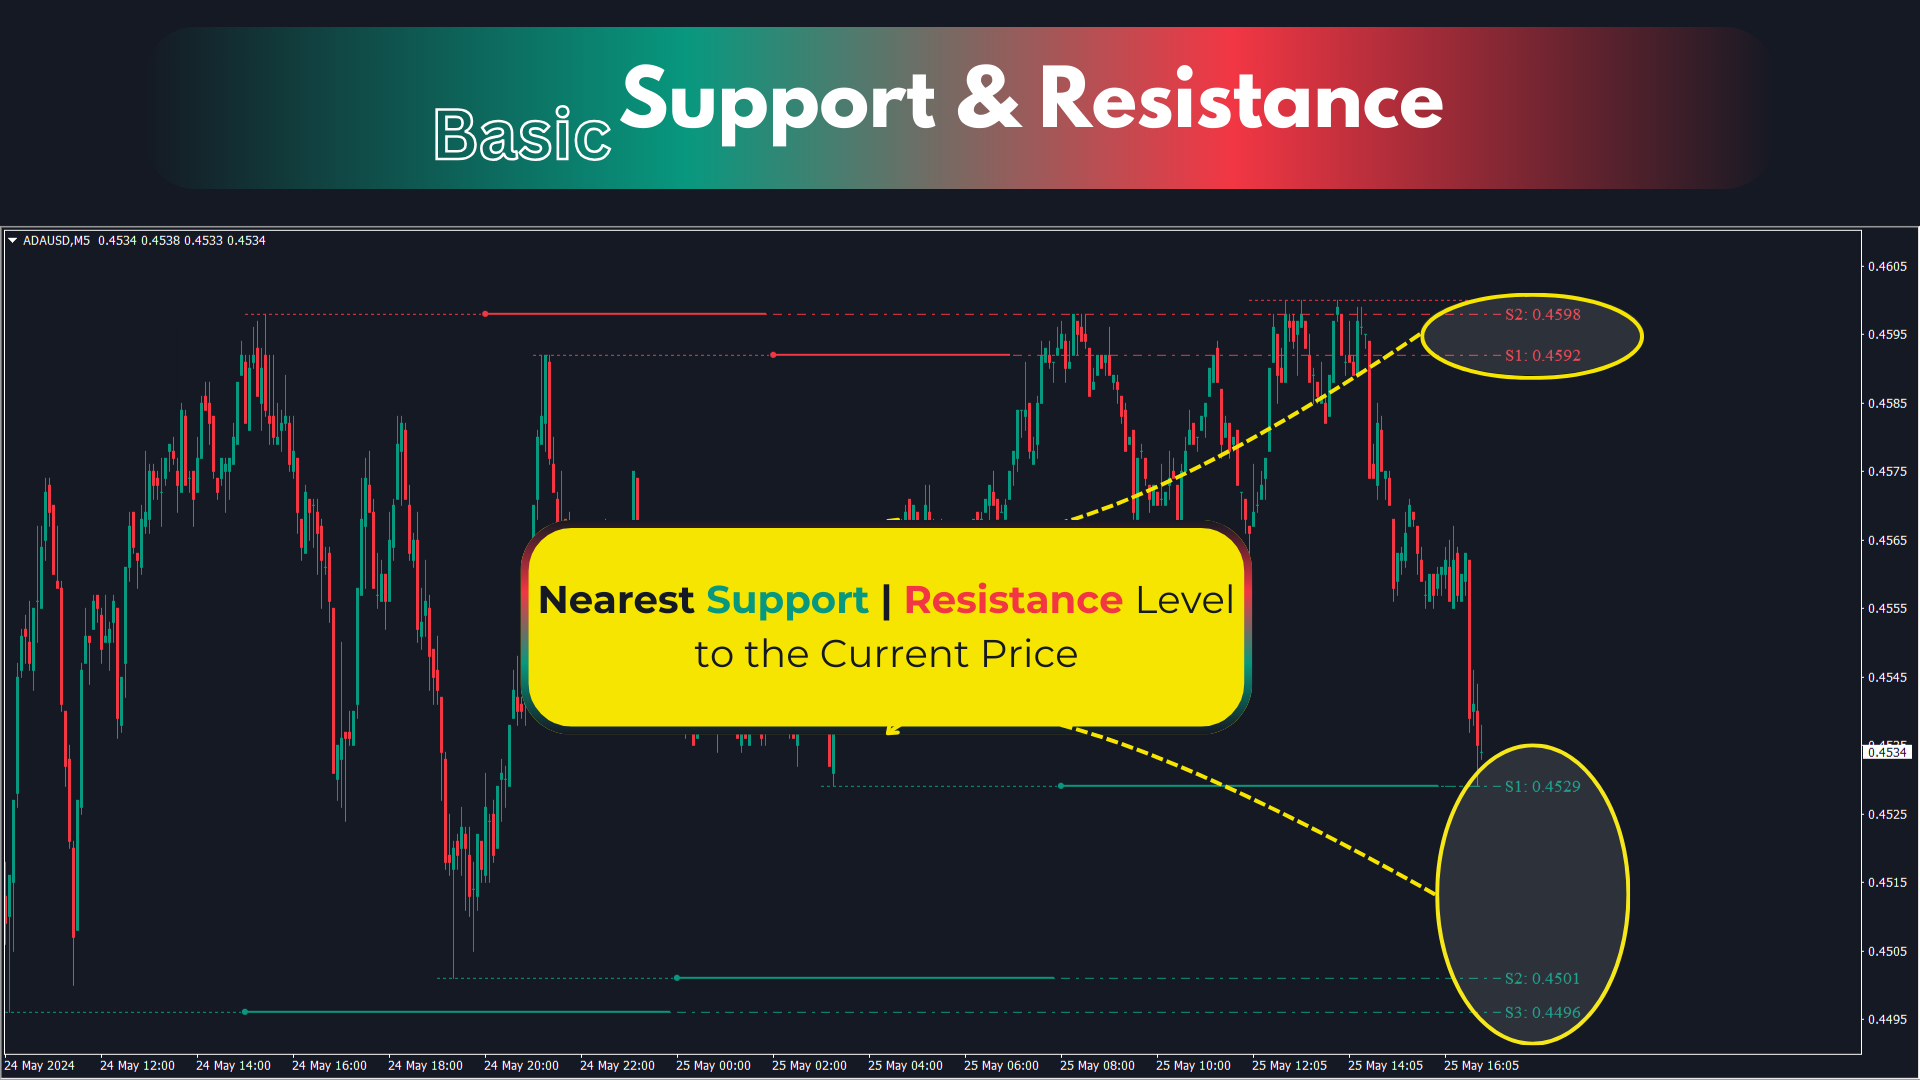
- Number extends from prev. Support/resistance: 此参数确定从先前的支持和电阻级别扩展了多少级别。例如,如果将其设置为2,则指示器将在以前的支持和电阻级别上方和下方绘制两个额外的级别。
- Update extend lines only at the opening of the bar: 此参数会在更新从支撑和电阻级别绘制的扩展线时控制。如果启用了,则只有在图表上新栏的开头才能更新行。
- Max Bars: 执行计算和显示支持和阻力线的最大蜡烛数量。
警报设置
- Pop-up alert: 警报到MT5终端
- Email alert: 电子邮件警报
- Push notification alert: 警报到电话