Moving Average Range Painter
- 指标
- Artur Alves De Carvalho
- 版本: 1.0
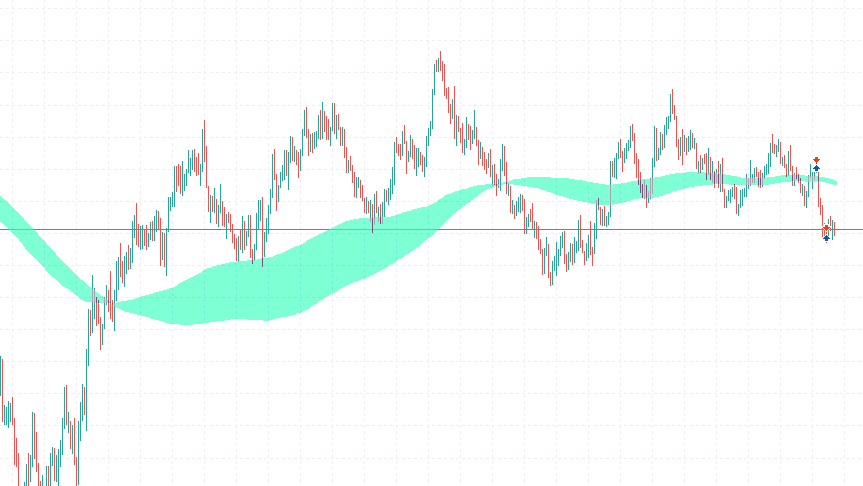
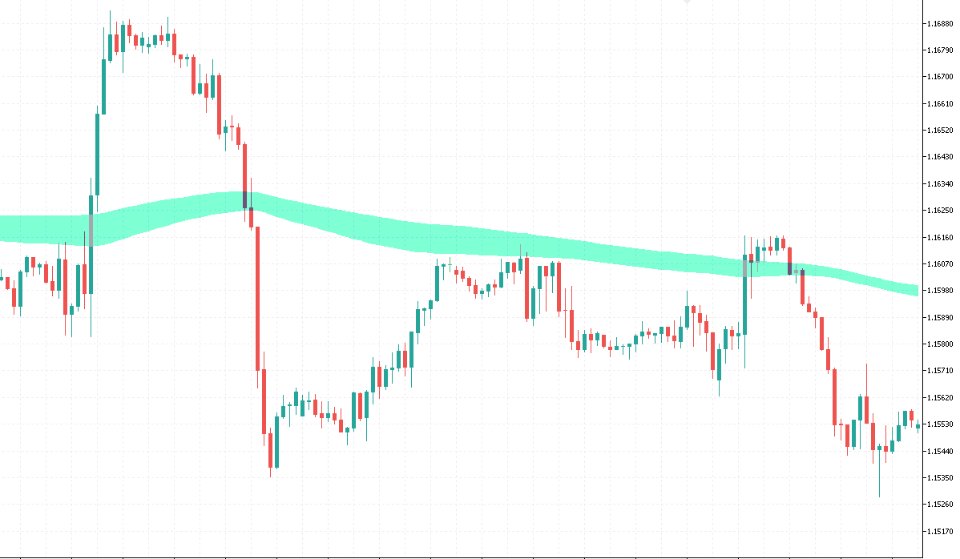
The "Moving Average Range Painter" is a robust MetaTrader 5 (MT5) indicator meticulously crafted to illustrate the fluctuating range between an exponential moving average (EMA) and a simple moving average (SMA) on any financial chart. This tool offers traders a comprehensive visual depiction of the price range within which an asset is oscillating.
Here's a succinct interpretation of what this range signifies for technical analysis:
-
Trend Dynamics: The range delineated by the EMA and SMA unveils the dynamics of the prevailing trend. A wider range typically signals a robust and sustained trend, whereas a narrower range may indicate a potential period of market consolidation or indecision.
-
Support and Resistance Zones: Unlike singular support and resistance points, the range between the EMA and SMA functions as a dynamic support and resistance zone. These zones serve as pivotal levels where price action may encounter barriers or reversals. Traders can utilize these zones to pinpoint opportune entry and exit points for their trades.
-
Trend Reversal Insights: Abrupt expansions or contractions in the range between the moving averages can signify impending trend reversals. For instance, a significant narrowing of the range following a period of expansion may foreshadow a potential trend reversal or a period of decreased market volatility, prompting traders to adapt their strategies accordingly.
-
Volatility Assessment: The width of the range also offers valuable insights into market volatility. In periods of heightened volatility, the range tends to expand as price fluctuations intensify. Conversely, during periods of subdued volatility, the range contracts, indicating a relative stabilization in price movements.
In essence, the Exponential-Simple Moving Average Range Painter empowers traders with a dynamic visualization of price action, enabling them to make well-informed trading decisions based on the evolving relationship between two pivotal moving averages. By identifying dynamic support and resistance zones and analyzing trend strength and volatility, traders can elevate their technical analysis prowess and refine their trading strategies.


